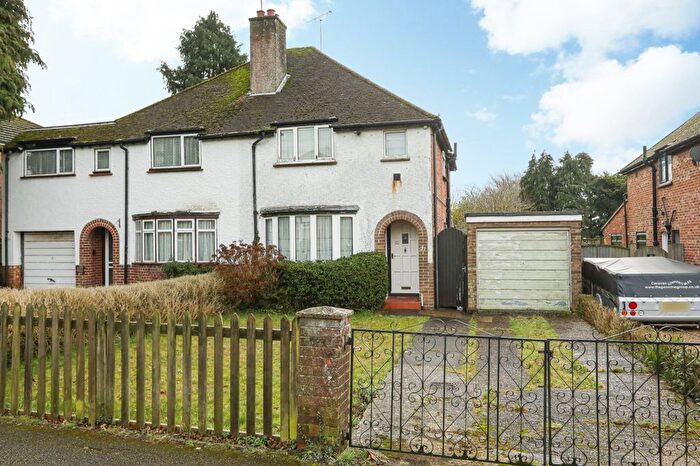
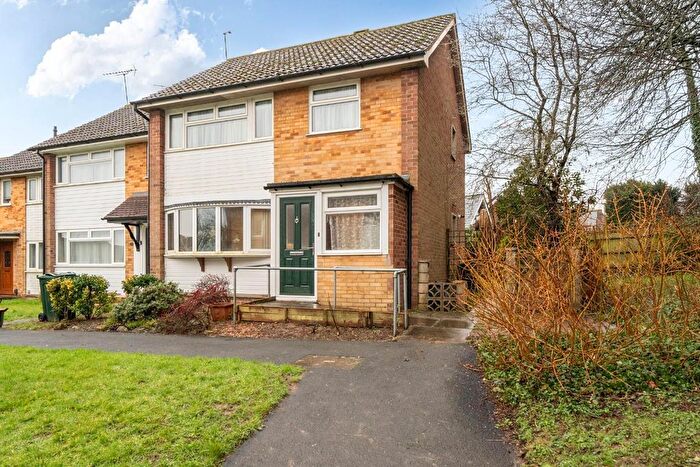
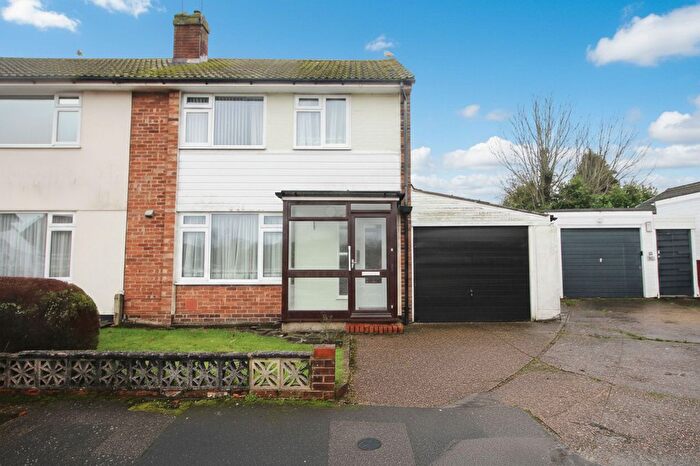
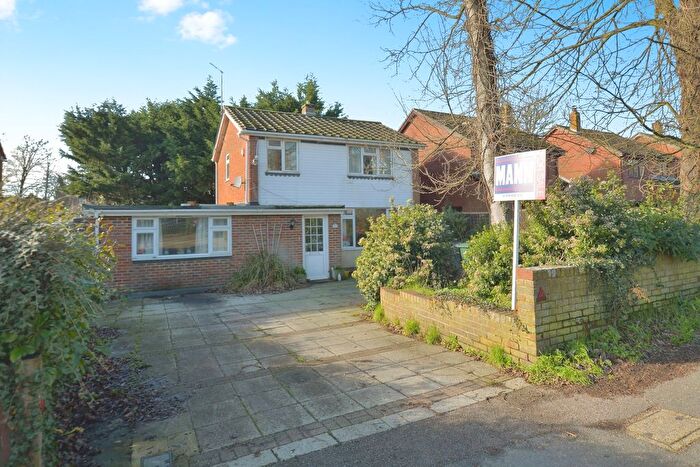
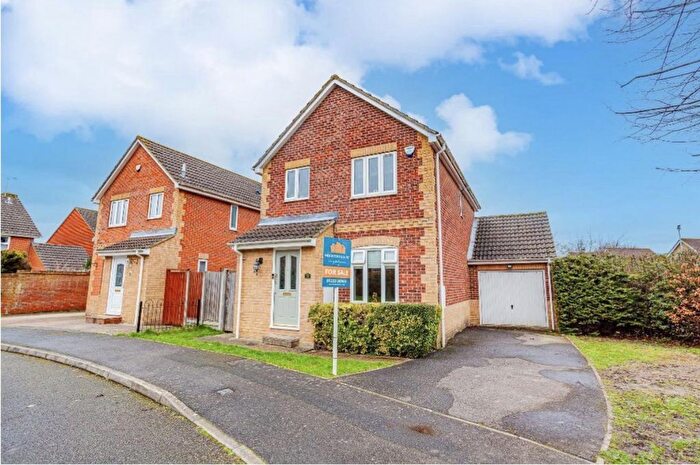
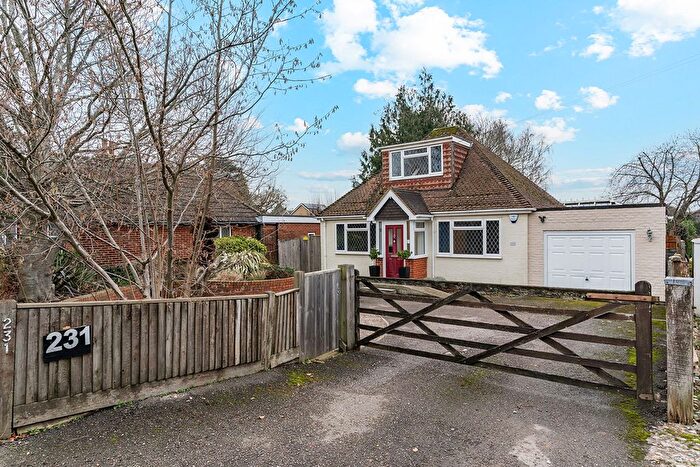
Houses for sale & to rent in Kennington, Ashford
House Prices in Kennington
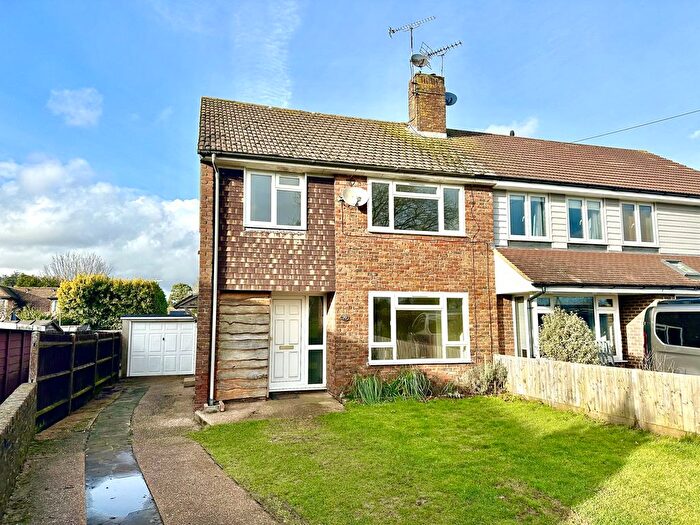
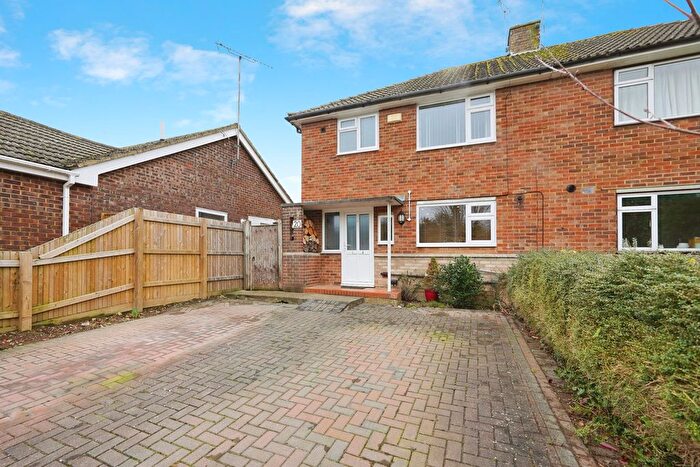
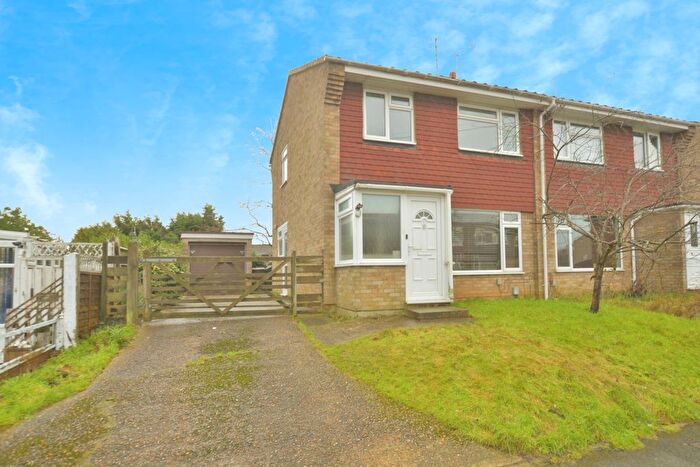
Properties in Kennington have an average house price of £416,933.00 and had 94 Property Transactions within the last 3 years¹.
Kennington is an area in Ashford, Kent with 886 households², where the most expensive property was sold for £899,995.00.
Properties for sale in Kennington
Previously listed properties in Kennington
Roads and Postcodes in Kennington
Navigate through our locations to find the location of your next house in Kennington, Ashford for sale or to rent.
| Streets | Postcodes |
|---|---|
| Ball Lane | TN25 4EB TN25 4EJ TN25 4ED TN25 4EH TN25 4PJ |
| Billington Gardens | TN24 9HF |
| Broadhurst Drive | TN24 9RQ |
| Canon Woods Way | TN24 9QY |
| Canterbury Road | TN24 9QS TN24 9QU TN25 4DU TN25 4DY TN24 9QR TN25 4DZ TN25 4EN |
| Church Road | TN24 9DG TN24 9DQ |
| East Mountain Lane | TN25 4EA |
| Faversham Road | TN24 9AE TN24 9AF TN24 9AJ TN24 9AN TN24 9AL |
| Furley Close | TN24 9EF |
| Glebe Way | TN24 9AU |
| Grosvenor Road | TN24 9PN |
| Hillcrest Close | TN24 9QT |
| Kennington Place | TN24 9HZ |
| Kings Meadow | TN25 4PS |
| Kingsley Gate | TN24 9FL |
| Lime Court | TN24 9AB |
| Lower Vicarage Road | TN24 9AP TN24 9AS TN24 9AT TN24 9BH |
| Marlborough Way | TN24 9HH |
| Mill Lane | TN25 4EL |
| Okehampton Close | TN24 9HJ |
| Orchard Lane | TN25 4DX |
| Rookery Close | TN24 9RP |
| St Marys Green | TN24 9HP |
| Studio Close | TN24 9DH |
| Tabret Close | TN24 9NE |
| The Grove | TN24 9HA |
| The Osier Field | TN25 4PL |
| The Pasture | TN24 9NG |
| The Street | TN24 9EX TN24 9HB TN24 9HD TN24 9HS |
| Tritton Close | TN24 9HN |
| Tritton Fields | TN24 9HE TN24 9HG TN24 9HL |
| Ulley Road | TN24 9HT TN24 9HU TN24 9HX TN24 9HY |
| Upper Vicarage Road | TN24 9AH TN24 9AG |
| Walnut Close | TN24 9AX |
| Willesborough Road | TN24 9QP |
| TN25 4EQ |
Transport near Kennington
-
Ashford International Station
-
Wye Station
-
Charing Station
-
Pluckley Station
-
Chilham Station
-
Ham Street Station
-
Selling Station
-
Westenhanger Station
-
Chartham Station
-
Lenham Station
- FAQ
- Price Paid By Year
- Property Type Price
Frequently asked questions about Kennington
What is the average price for a property for sale in Kennington?
The average price for a property for sale in Kennington is £416,933. This amount is 15% higher than the average price in Ashford. There are 629 property listings for sale in Kennington.
What streets have the most expensive properties for sale in Kennington?
The streets with the most expensive properties for sale in Kennington are Willesborough Road at an average of £725,000, Canterbury Road at an average of £625,400 and Ball Lane at an average of £616,666.
What streets have the most affordable properties for sale in Kennington?
The streets with the most affordable properties for sale in Kennington are Lime Court at an average of £234,875, The Pasture at an average of £270,000 and St Marys Green at an average of £273,991.
Which train stations are available in or near Kennington?
Some of the train stations available in or near Kennington are Ashford International, Wye and Charing.
Property Price Paid in Kennington by Year
The average sold property price by year was:
| Year | Average Sold Price | Price Change |
Sold Properties
|
|---|---|---|---|
| 2025 | £417,328 | -1% |
32 Properties |
| 2024 | £420,127 | 2% |
41 Properties |
| 2023 | £410,095 | -15% |
21 Properties |
| 2022 | £472,464 | 20% |
42 Properties |
| 2021 | £378,198 | -9% |
33 Properties |
| 2020 | £413,895 | 17% |
36 Properties |
| 2019 | £344,624 | 1% |
29 Properties |
| 2018 | £342,381 | 3% |
45 Properties |
| 2017 | £330,757 | -5% |
35 Properties |
| 2016 | £347,028 | 10% |
42 Properties |
| 2015 | £311,543 | 14% |
33 Properties |
| 2014 | £266,535 | -0,2% |
41 Properties |
| 2013 | £267,137 | 15% |
46 Properties |
| 2012 | £225,798 | -3% |
30 Properties |
| 2011 | £232,185 | -14% |
27 Properties |
| 2010 | £263,618 | 7% |
29 Properties |
| 2009 | £244,863 | -0,1% |
22 Properties |
| 2008 | £245,048 | -1% |
25 Properties |
| 2007 | £246,559 | 4% |
56 Properties |
| 2006 | £235,671 | 2% |
61 Properties |
| 2005 | £231,170 | 13% |
39 Properties |
| 2004 | £201,156 | 7% |
32 Properties |
| 2003 | £187,697 | 17% |
44 Properties |
| 2002 | £156,347 | 4% |
41 Properties |
| 2001 | £149,377 | 13% |
41 Properties |
| 2000 | £130,348 | 11% |
47 Properties |
| 1999 | £115,963 | 14% |
45 Properties |
| 1998 | £99,621 | 21% |
48 Properties |
| 1997 | £78,590 | -17% |
49 Properties |
| 1996 | £91,839 | 6% |
42 Properties |
| 1995 | £86,619 | - |
33 Properties |
Property Price per Property Type in Kennington
Here you can find historic sold price data in order to help with your property search.
The average Property Paid Price for specific property types in the last three years are:
| Property Type | Average Sold Price | Sold Properties |
|---|---|---|
| Semi Detached House | £369,639.00 | 38 Semi Detached Houses |
| Detached House | £533,841.00 | 38 Detached Houses |
| Terraced House | £277,309.00 | 16 Terraced Houses |
| Flat | £211,250.00 | 2 Flats |

