
Houses for sale in Highfield, Ashford
House Prices in Highfield
Properties in Highfield have an average house price of £338k and had 93 Property Transactions within the last 3 years¹.
Highfield is an area in Ashford, Kent with 943 households², where the most expensive property was sold for £1.06M.
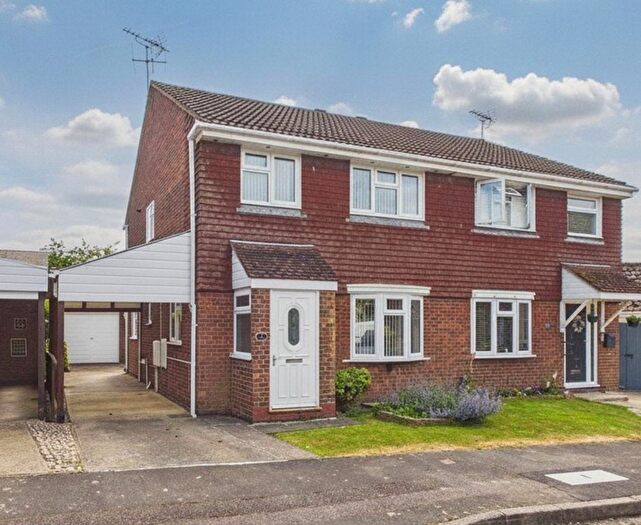
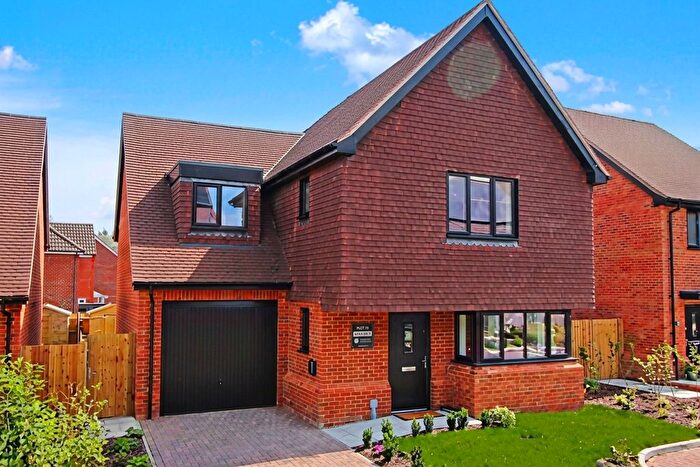
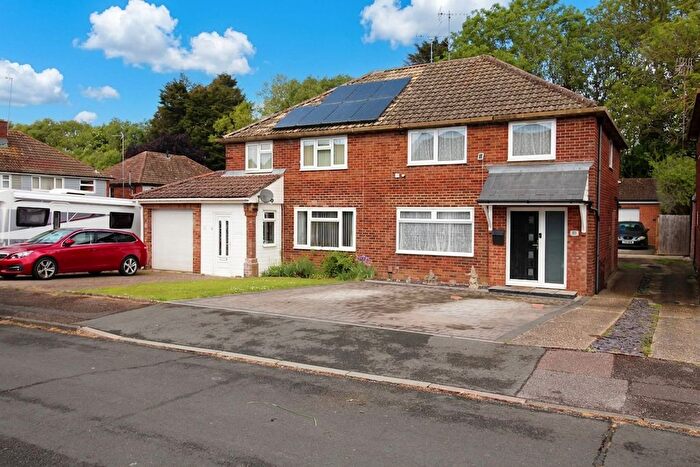
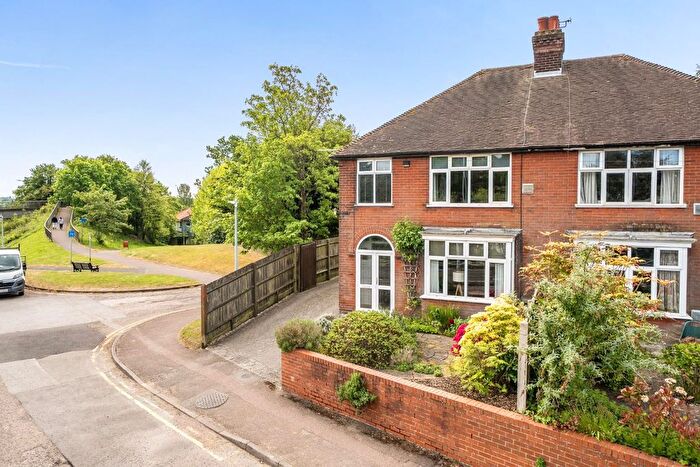
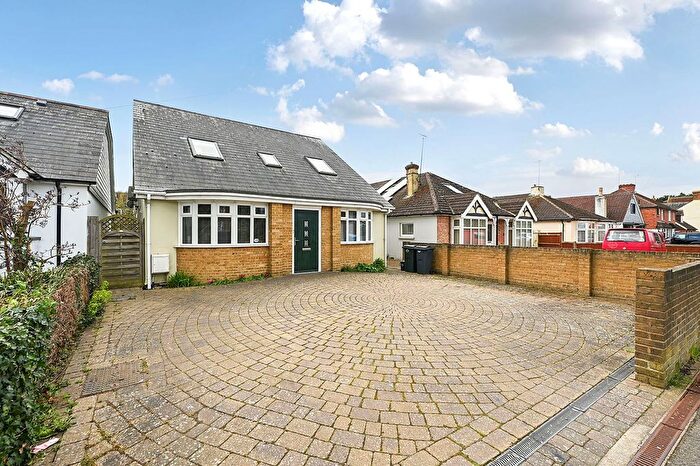
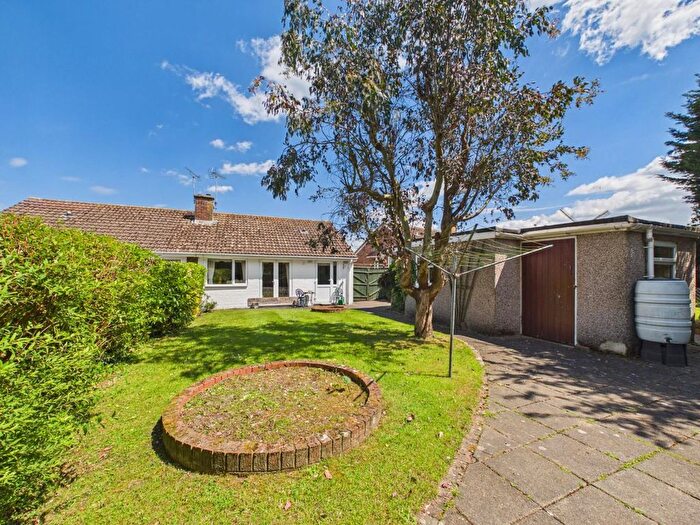
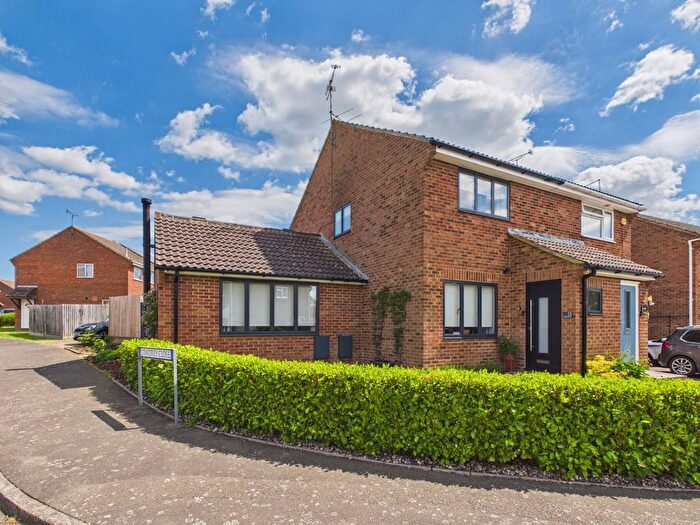
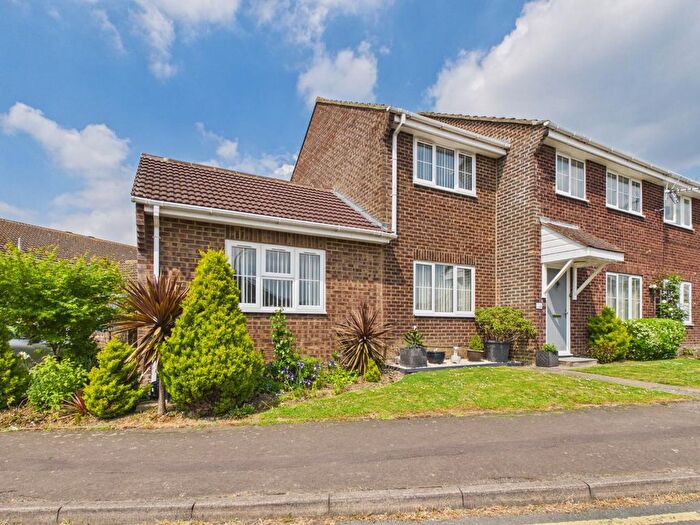
Properties for sale in Highfield
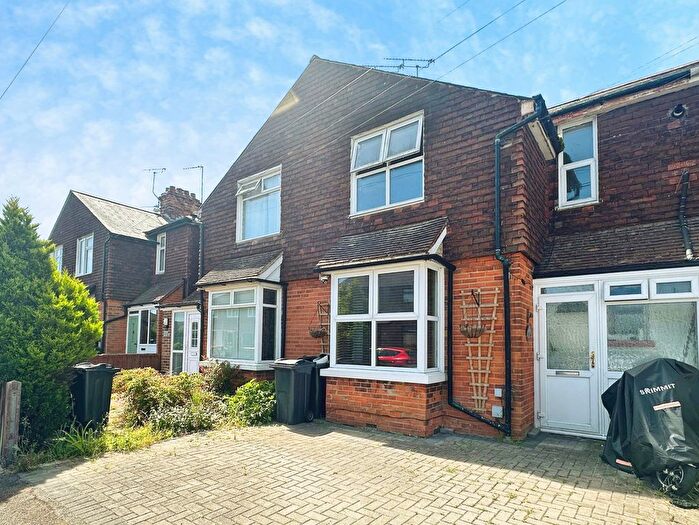
Previously listed properties in Highfield
![]()
If you are looking to sell your house, let it out, or receive a property valuation, an expert can help you.
Click the button below to get started.
Roads and Postcodes in Highfield
Navigate through our locations to find the location of your next house in Highfield, Ashford for sale or to rent.
| Streets | Postcodes |
|---|---|
| Barrey Road | TN24 0SG |
| Charlton Close | TN24 0JN |
| Church Road | TN24 0JQ TN24 0JZ TN24 0LE TN24 0LF |
| Collard Road | TN24 0JR |
| Cornwallis Close | TN24 0XE |
| Cowdrey Close | TN24 0UB |
| Drake Road | TN24 0UP TN24 0UR TN24 0UZ |
| Duckworth Close | TN24 0XD |
| Ealham Close | TN24 0UQ |
| Evans Road | TN24 0UA TN24 0UN |
| Foley Close | TN24 0XA |
| Foster Road | TN24 0FE TN24 0SH |
| Hardy Close | TN24 0XB |
| Hayward Close | TN24 0JS |
| Highfield Road | TN24 0JJ TN24 0JT TN24 0JU TN24 0JW TN24 0LN |
| Jarvis Drive | TN24 0UG |
| Jellicoe Close | TN24 0UW |
| Johnson Close | TN24 0UE |
| Julien Place | TN24 0UH |
| Kingfisher Close | TN24 0TW |
| Knott Crescent | TN24 0UF |
| Lacton Way | TN24 0JE |
| Luckhurst Road | TN24 0UL |
| Nelson Close | TN24 0UU |
| Nightingale Close | TN24 0TP |
| Raleigh Close | TN24 0UT |
| Ripley Road | TN24 0JP TN24 0UX TN24 0UY |
| Sevington Lane | TN24 0FT TN24 0LB |
| Shepherd Drive | TN24 0UJ |
| St Johns Court | TN24 0SJ |
| Troubridge Close | TN24 0XG |
| Wickenden Crescent | TN24 0JL |
| Woolmer Drive | TN24 0UD |
Property price trends in Highfield
According to the latest Land Registry data, the average home in Highfield sold for £365,000 in 2026. That figure comes from 1,427 sales logged over the past 31 years.
Prices have moved up over the last three years. Compared with 2023, when the typical sale came in around £359,116, that's a rise of roughly 1.6%.
Looking back five years, average prices are up about 10.5% since 2021, a gain of around £34,663 in cash terms.
Zoom out to the past decade for the fuller picture. Back in 2016, homes here averaged £280,457, so the typical sold price has climbed about 30.1% since then, roughly 2.7% a year. Stretch the view to fifteen years and that annual pace edges up closer to 4.6%.
Frequently asked questions about Highfield
What is the average price for a property for sale in Highfield?
The average price for a property for sale in Highfield is £337,806. This amount is 7% lower than the average price in Ashford. There are 551 property listings for sale in Highfield.
What streets have the most expensive properties for sale in Highfield?
The streets with the most expensive properties for sale in Highfield are Nightingale Close at an average of £450,000, Knott Crescent at an average of £405,000 and Kingfisher Close at an average of £403,333.
What streets have the most affordable properties for sale in Highfield?
The streets with the most affordable properties for sale in Highfield are Ealham Close at an average of £191,000, Nelson Close at an average of £247,000 and Drake Road at an average of £298,200.
Which train stations are available in or near Highfield?
Some of the train stations available in or near Highfield are Ashford International, Wye and Ham Street.
Property Price Paid in Highfield by Year
The average sold property price by year was:
| Year | Average Sold Price | Price Change |
Sold Properties
|
|---|---|---|---|
| 2026 | £365,000 | 9% |
1 Property |
| 2025 | £330,421 | 2% |
32 Properties |
| 2024 | £323,466 | -11% |
30 Properties |
| 2023 | £359,116 | 3% |
30 Properties |
| 2022 | £348,018 | 5% |
37 Properties |
| 2021 | £330,337 | 7% |
47 Properties |
| 2020 | £306,420 | 8% |
32 Properties |
| 2019 | £281,477 | 6% |
31 Properties |
| 2018 | £263,749 | -11% |
40 Properties |
| 2017 | £292,024 | 4% |
41 Properties |
Property Price per Property Type in Highfield
Here you can find historic sold price data in order to help with your property search.
The average Property Paid Price for specific property types in the last three years are:
| Property Type | Average Sold Price | Sold Properties |
|---|---|---|
| Semi Detached House | £344,744.00 | 47 Semi Detached Houses |
| Detached House | £400,000.00 | 23 Detached Houses |
| Terraced House | £285,578.00 | 19 Terraced Houses |
| Flat | £146,750.00 | 4 Flats |
