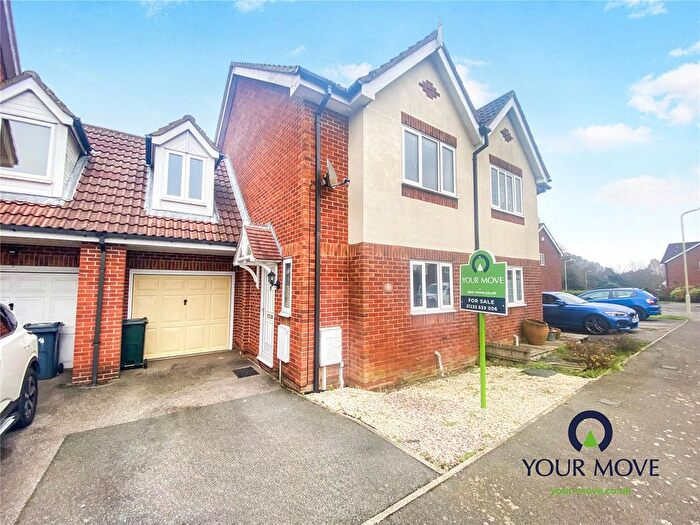
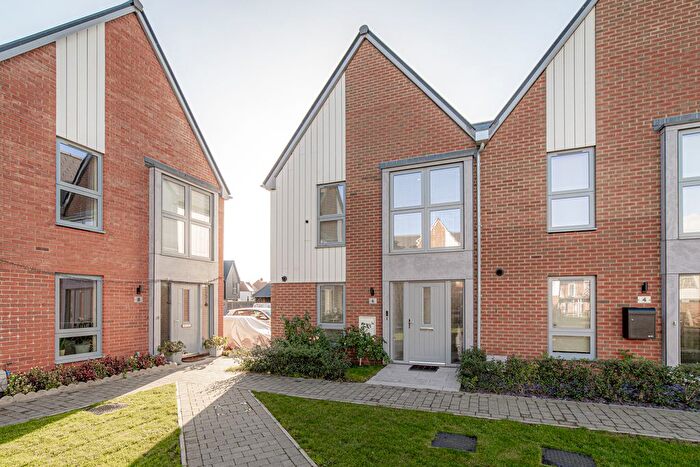
Houses for sale & to rent in Mersham, Sevington South with Finberry, Ashford
House Prices in Mersham, Sevington South with Finberry
Properties in Mersham, Sevington South with Finberry have an average house price of £328,879.00 and had 156 Property Transactions within the last 3 years¹.
Mersham, Sevington South with Finberry is an area in Ashford, Kent with 25 households², where the most expensive property was sold for £642,500.00.
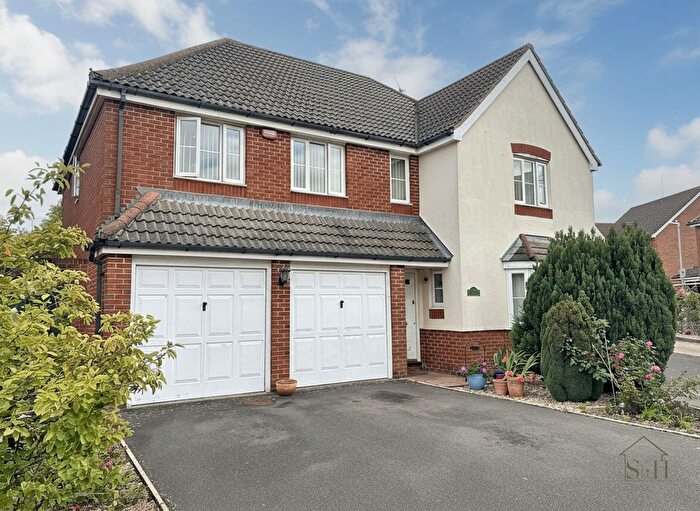
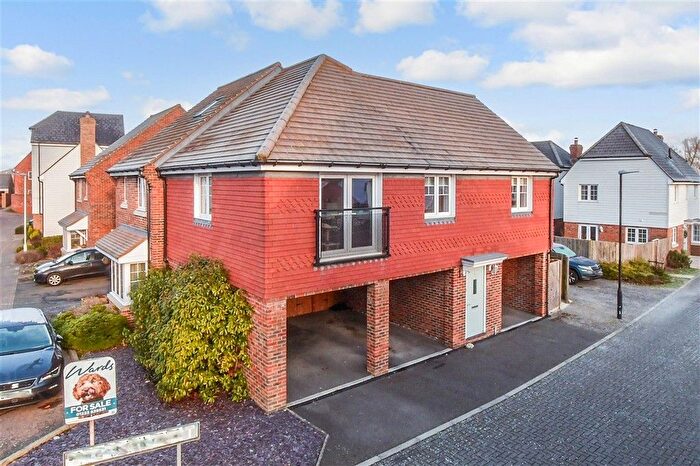
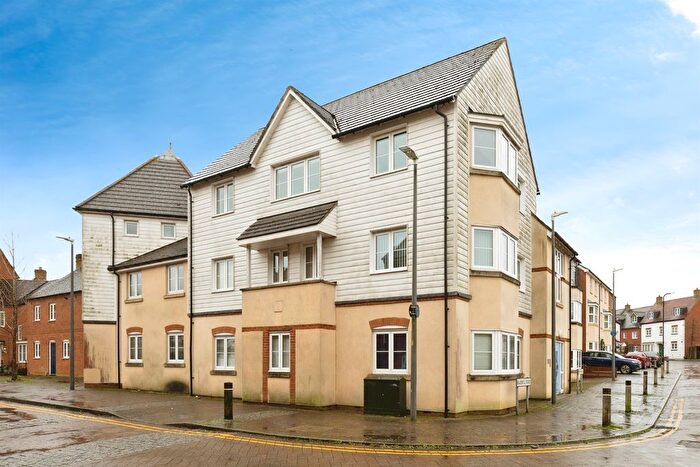
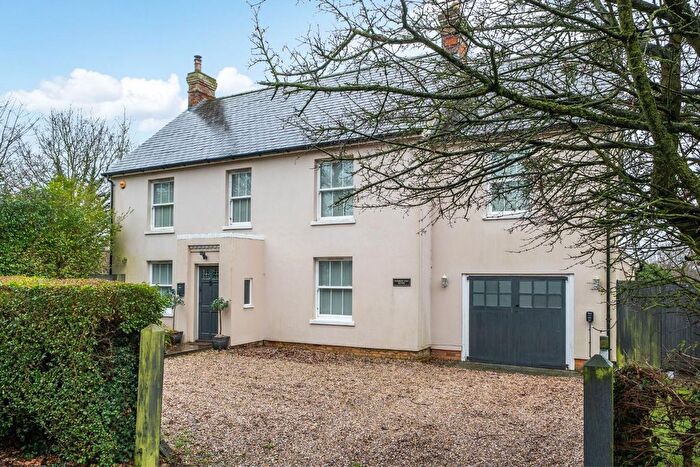
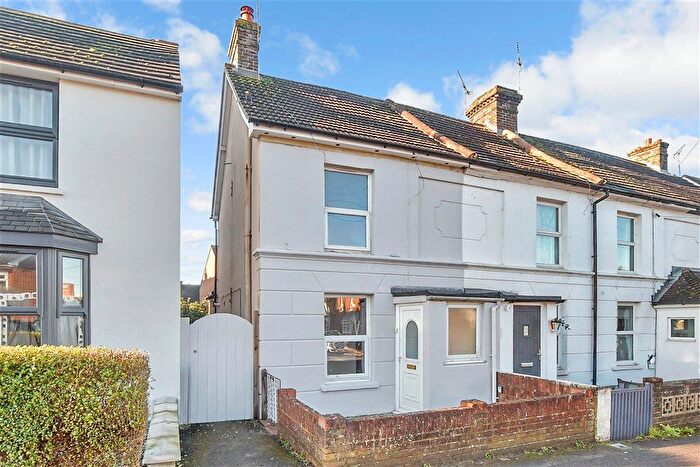
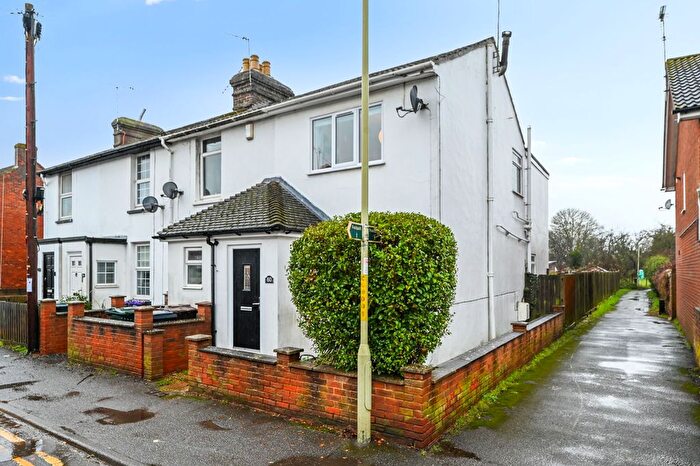
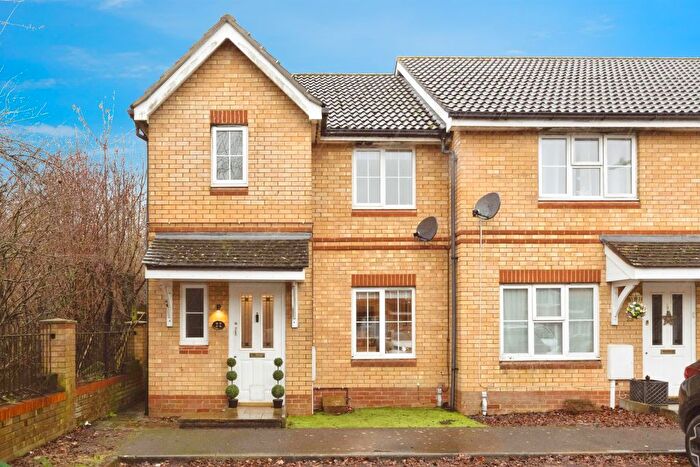
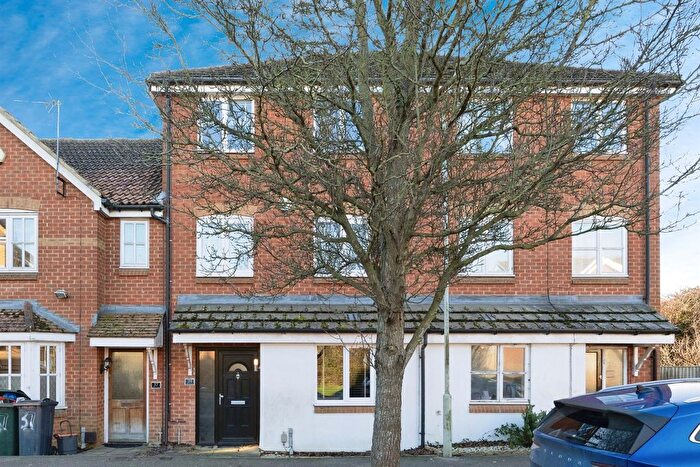
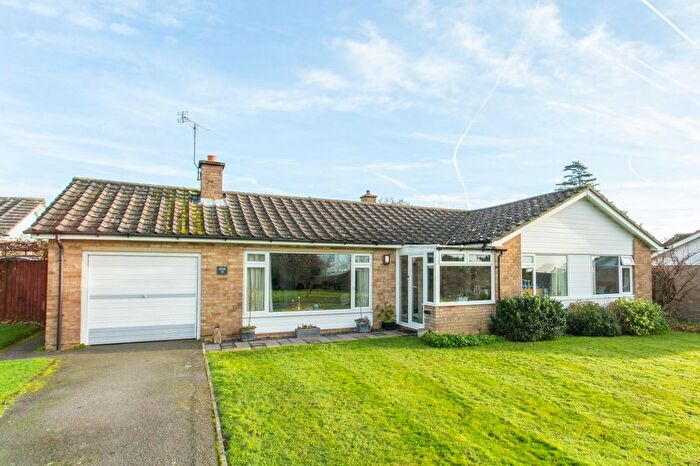
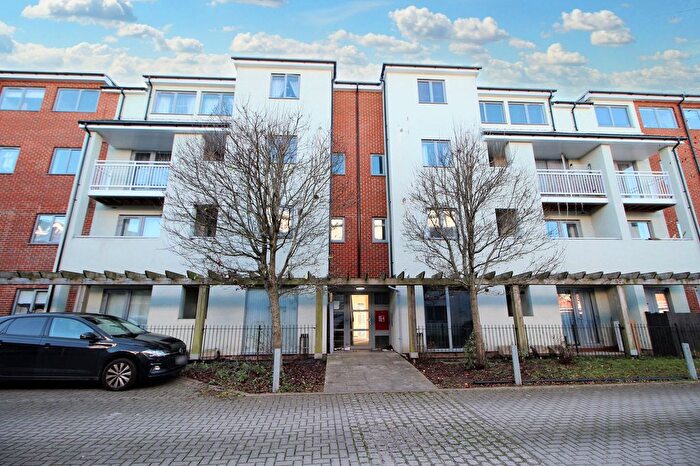
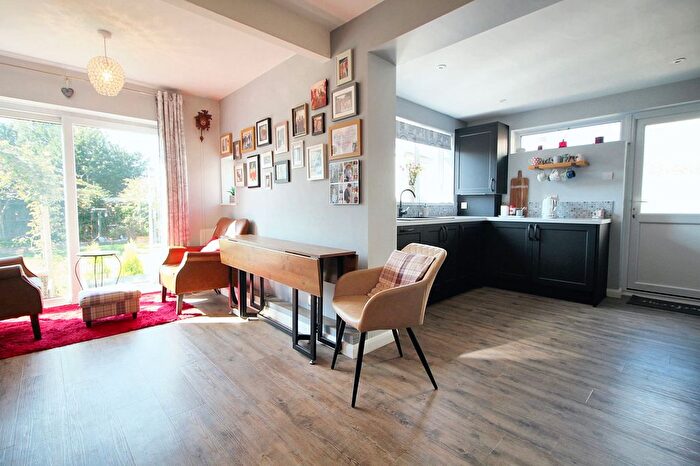
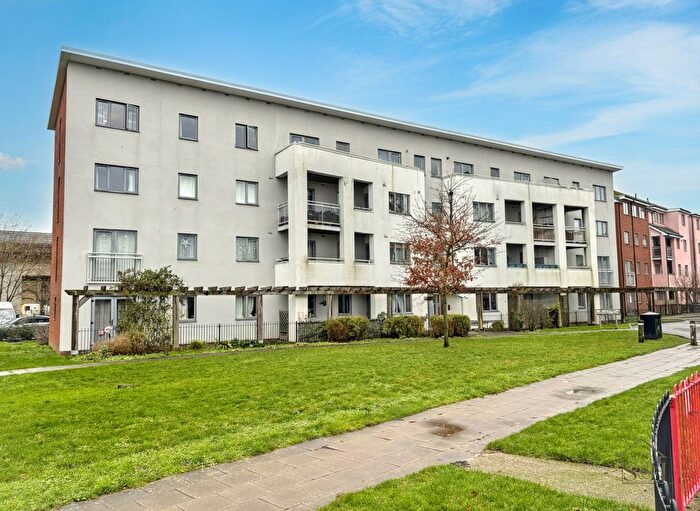
Properties for sale in Mersham, Sevington South with Finberry
Roads and Postcodes in Mersham, Sevington South with Finberry
Navigate through our locations to find the location of your next house in Mersham, Sevington South with Finberry, Ashford for sale or to rent.
| Streets | Postcodes |
|---|---|
| Arrowhead Road | TN24 0FL |
| Augustine Drive | TN25 7GH |
| Avocet Way | TN25 7FR TN25 7GS |
| Bank Road | TN25 7HP |
| Brambling Avenue | TN25 7FB |
| Bullfinch Avenue | TN25 7FS |
| Chequer Tree Farm Road | TN25 7GW |
| Church Road | TN25 6AA |
| Clover Road | TN24 0TX |
| Colliers Hill | TN25 7HT |
| Cormorant Place | TN25 7FT |
| Flood Street | TN25 6NX |
| Goldfinch Drive | TN25 7FQ |
| Harrier Drive | TN25 7GR |
| Highfield Lane | TN25 6PG |
| Housemartin Road | TN25 7NA |
| Jay Walk | TN25 7LZ |
| Kestrel Drive | TN25 7GY |
| Kingsford Close | TN25 6PD |
| Linnet Drive | TN25 7GA |
| Nuthatch Drive | TN25 7AA |
| Partridge Crescent | TN25 7JG |
| Pheasant Crescent | TN25 7NB |
| Pipin Crescent | TN25 7GL |
| Plover Avenue | TN25 7GX |
| Quarry View | TN25 6AE |
| Redwing Gardens | TN25 7LE |
| Robin Road | TN25 7GU TN25 7GP |
| Sanderling Place | TN25 7JA |
| Shearwater Close | TN25 7JP |
| Song Thrush Drive | TN25 7FP |
| Starling Drive | TN25 7GB |
| Stonechat Way | TN25 7GZ |
| Swift Avenue | TN25 7GD |
| Swithun Road | TN25 7GJ |
| The Street | TN25 6NF TN25 6NG |
| Turnstone Place | TN25 7LB |
| Wagtail Walk | TN25 7GE TN25 7GQ |
| Waterbrook Avenue | TN24 0GB |
| Whinchat Close | TN25 7JW |
| Woodlark Close | TN25 7JQ |
| Wren Drive | TN25 7GG |
| TN24 0LH TN25 5NG TN25 5NQ TN25 6PS TN25 7HF TN25 6GE |
Transport near Mersham, Sevington South with Finberry
- FAQ
- Price Paid By Year
- Property Type Price
Frequently asked questions about Mersham, Sevington South with Finberry
What is the average price for a property for sale in Mersham, Sevington South with Finberry?
The average price for a property for sale in Mersham, Sevington South with Finberry is £328,879. This amount is 10% lower than the average price in Ashford. There are 2,375 property listings for sale in Mersham, Sevington South with Finberry.
What streets have the most expensive properties for sale in Mersham, Sevington South with Finberry?
The streets with the most expensive properties for sale in Mersham, Sevington South with Finberry are Wren Drive at an average of £482,500, Augustine Drive at an average of £427,363 and Goldfinch Drive at an average of £391,541.
What streets have the most affordable properties for sale in Mersham, Sevington South with Finberry?
The streets with the most affordable properties for sale in Mersham, Sevington South with Finberry are Avocet Way at an average of £223,800, Nuthatch Drive at an average of £246,571 and The Street at an average of £267,500.
Which train stations are available in or near Mersham, Sevington South with Finberry?
Some of the train stations available in or near Mersham, Sevington South with Finberry are Ashford International, Ham Street and Wye.
Property Price Paid in Mersham, Sevington South with Finberry by Year
The average sold property price by year was:
| Year | Average Sold Price | Price Change |
Sold Properties
|
|---|---|---|---|
| 2025 | £343,166 | 9% |
36 Properties |
| 2024 | £312,206 | -1% |
29 Properties |
| 2023 | £315,601 | -6% |
32 Properties |
| 2022 | £335,557 | 3% |
59 Properties |
| 2021 | £324,755 | 11% |
57 Properties |
| 2020 | £289,354 | -7% |
45 Properties |
| 2019 | £308,627 | -11% |
65 Properties |
| 2018 | £342,091 | -2% |
119 Properties |
| 2017 | £348,511 | 13% |
92 Properties |
| 2016 | £301,511 | -3% |
86 Properties |
| 2015 | £310,734 | 13% |
58 Properties |
| 2014 | £269,846 | - |
13 Properties |
Property Price per Property Type in Mersham, Sevington South with Finberry
Here you can find historic sold price data in order to help with your property search.
The average Property Paid Price for specific property types in the last three years are:
| Property Type | Average Sold Price | Sold Properties |
|---|---|---|
| Semi Detached House | £340,900.00 | 30 Semi Detached Houses |
| Terraced House | £292,318.00 | 55 Terraced Houses |
| Flat | £188,380.00 | 25 Flats |
| Detached House | £441,111.00 | 46 Detached Houses |

