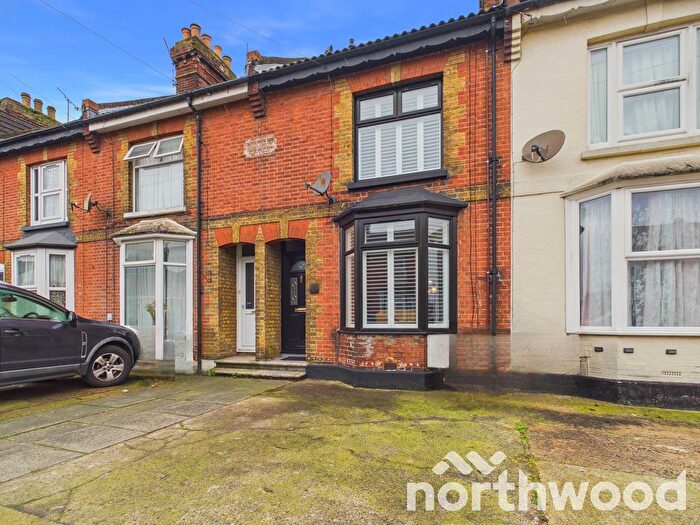
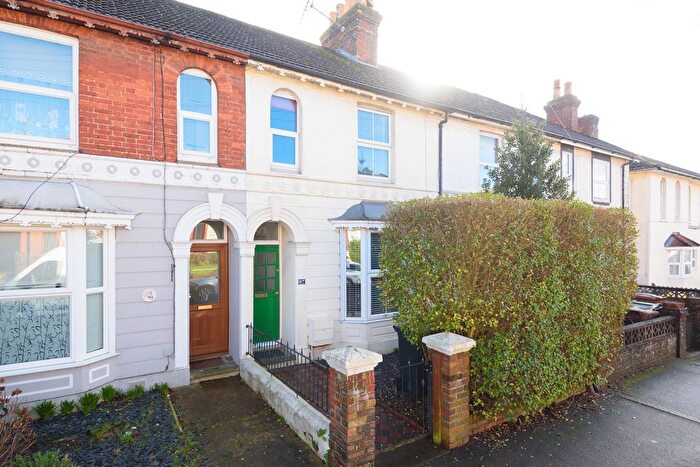
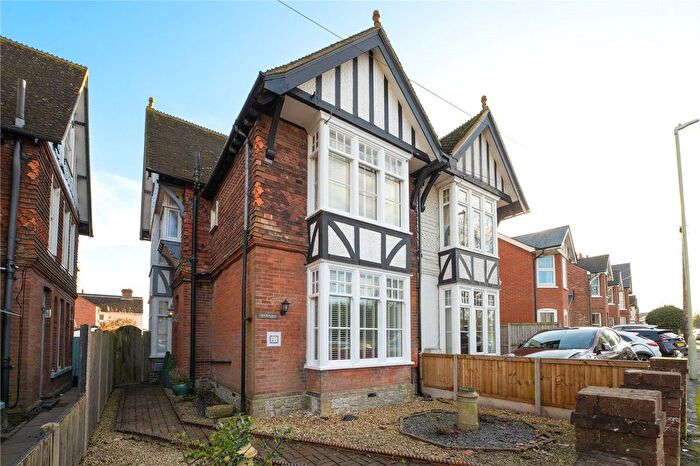
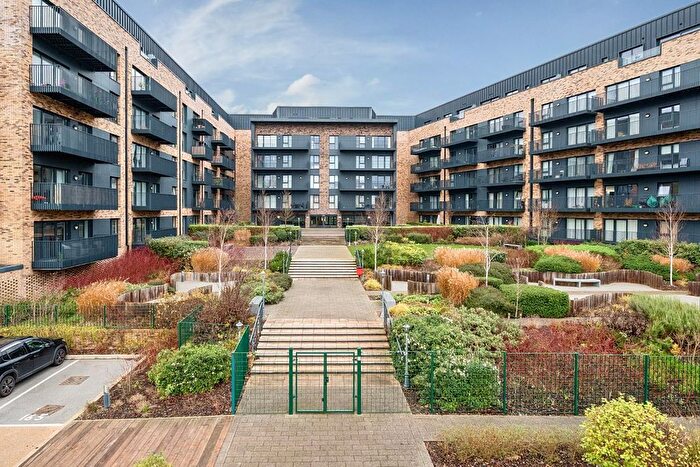
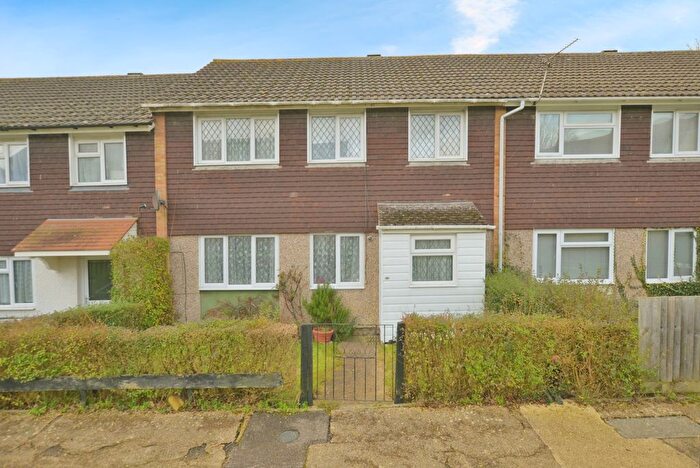
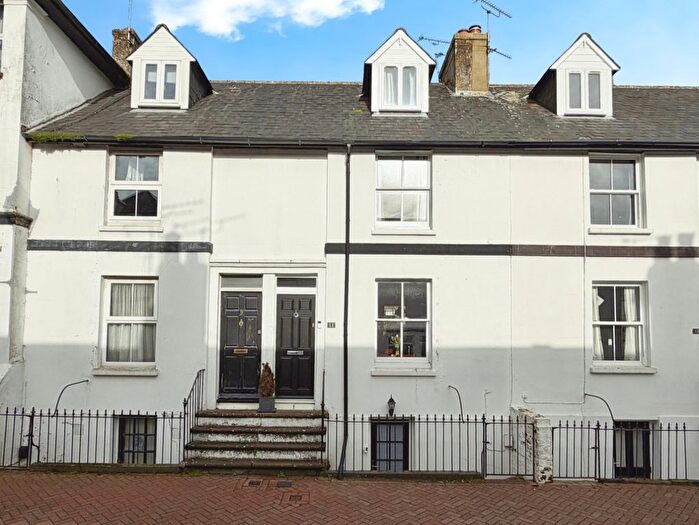
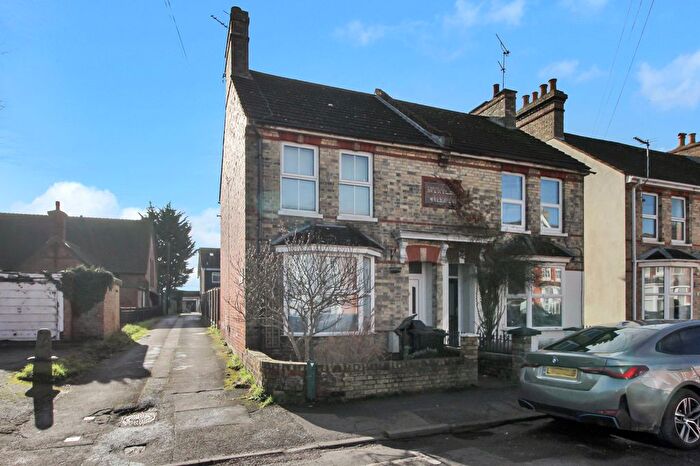
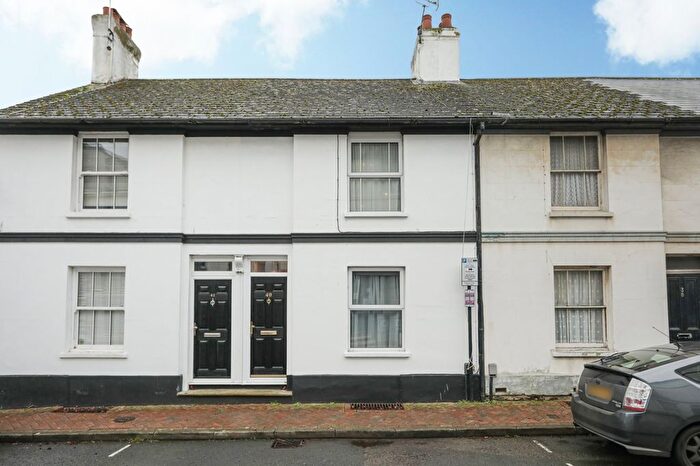
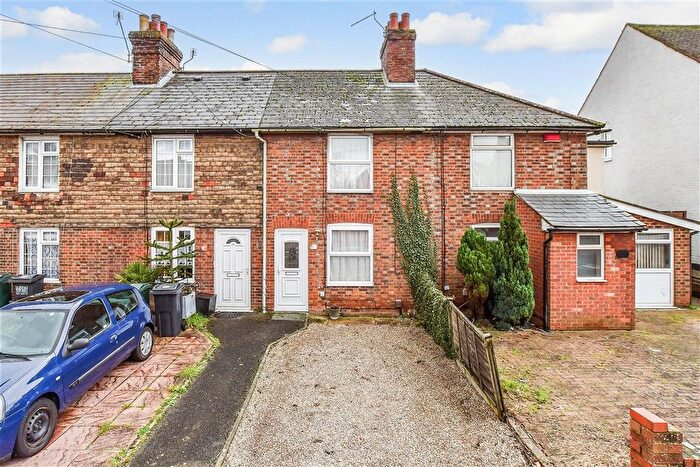
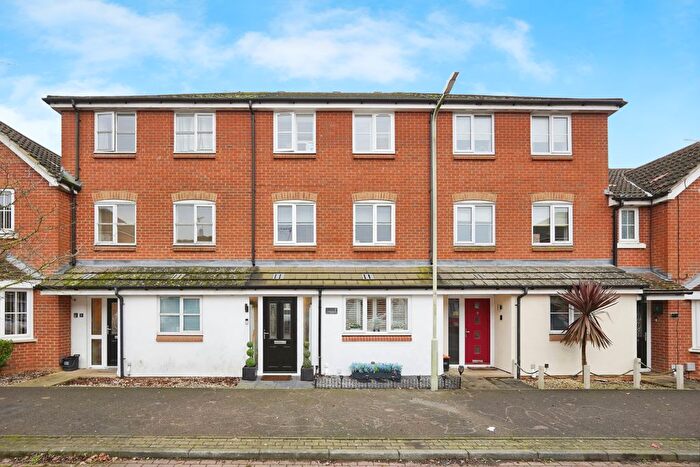
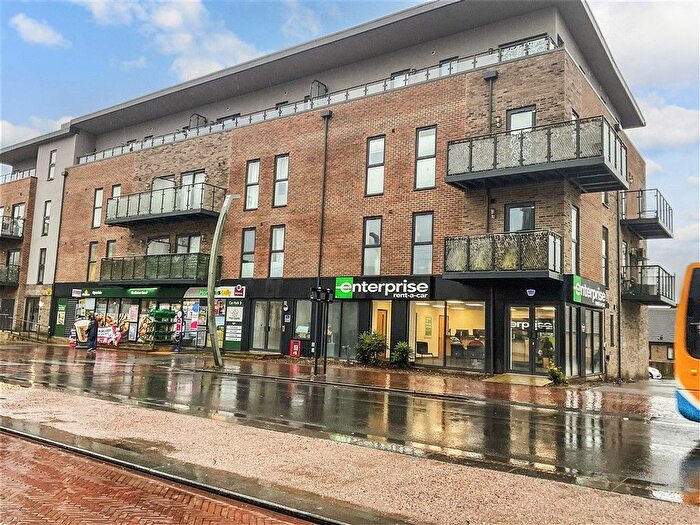
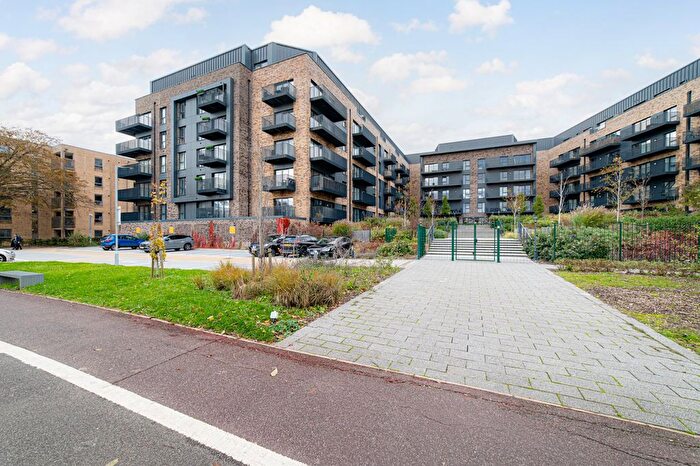
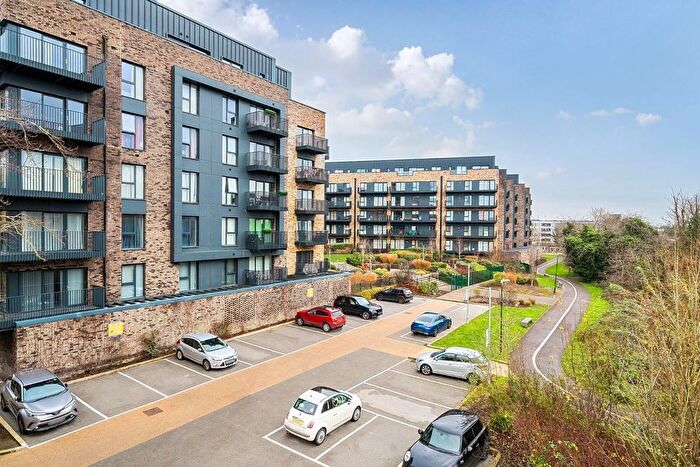
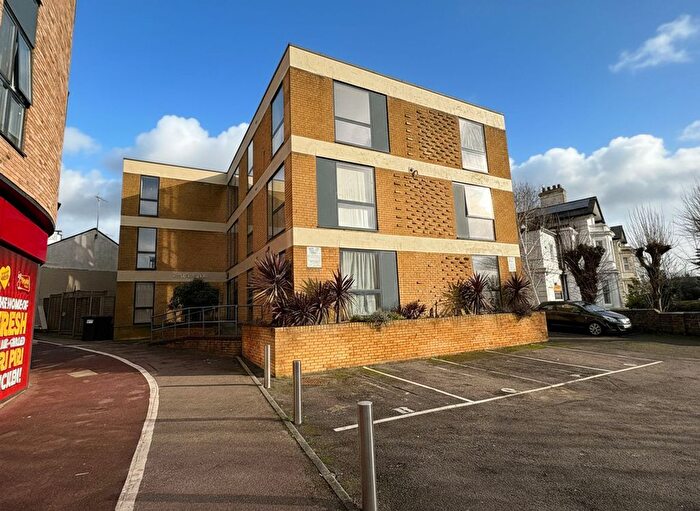
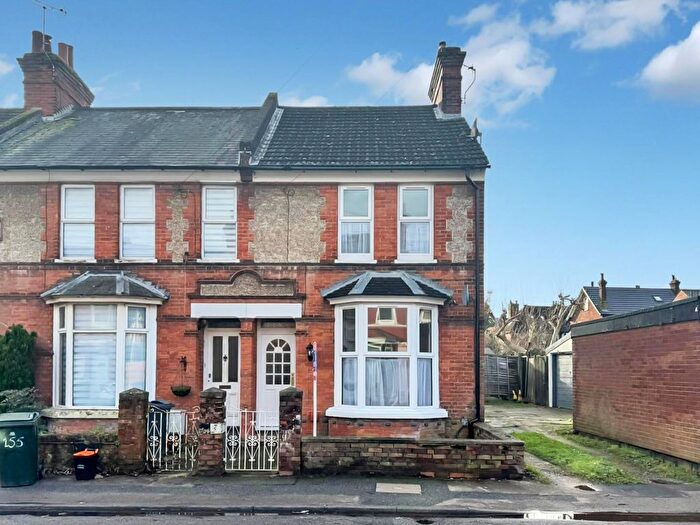
Houses for sale & to rent in Norman, Ashford
House Prices in Norman
Properties in Norman have an average house price of £254,580.00 and had 120 Property Transactions within the last 3 years¹.
Norman is an area in Ashford, Kent with 1,221 households², where the most expensive property was sold for £425,000.00.
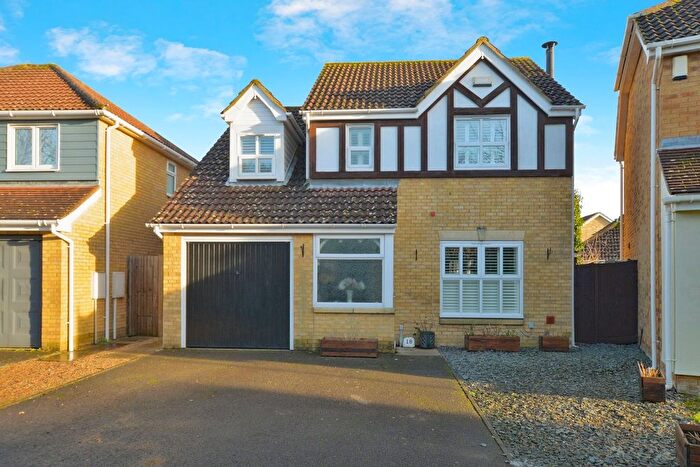
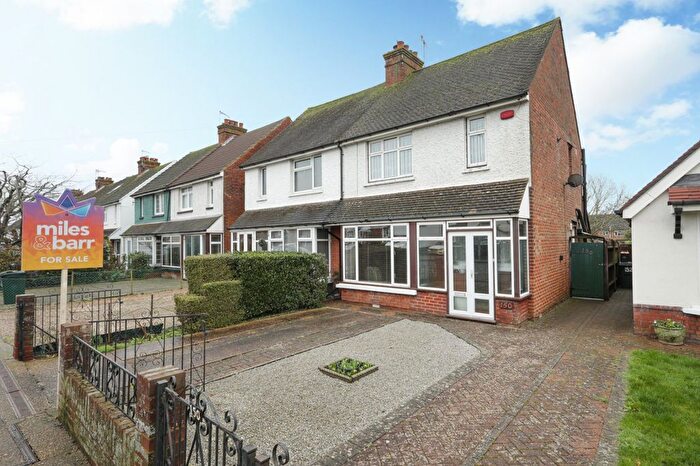
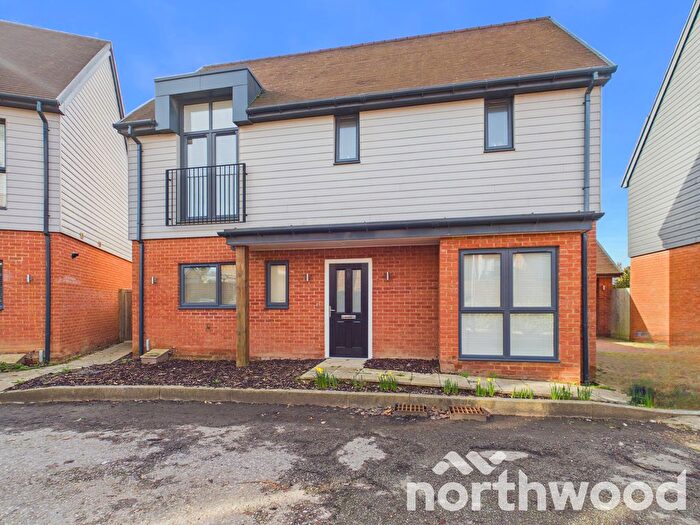
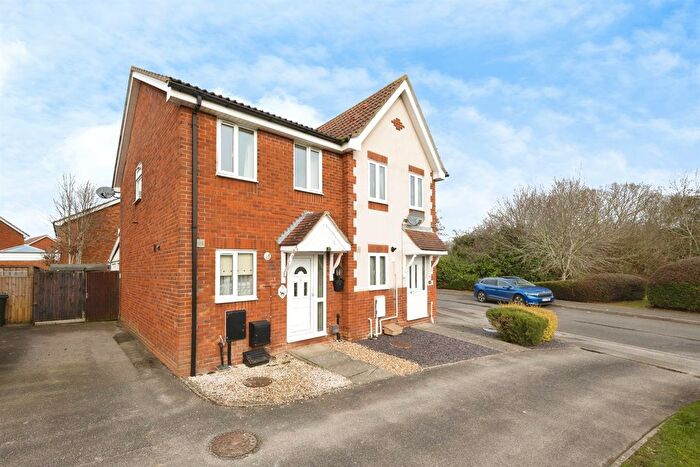
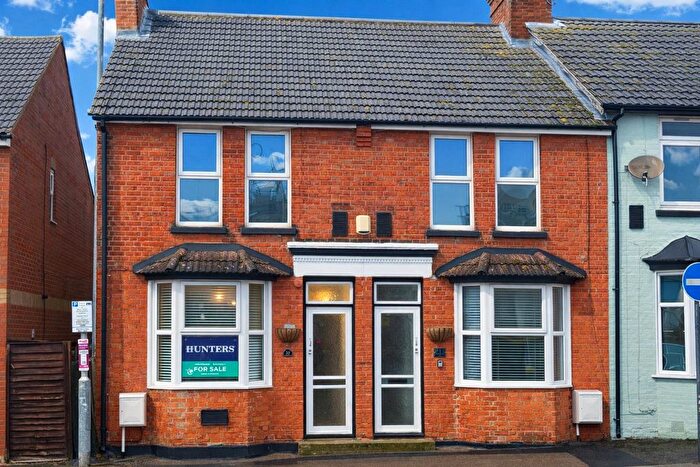
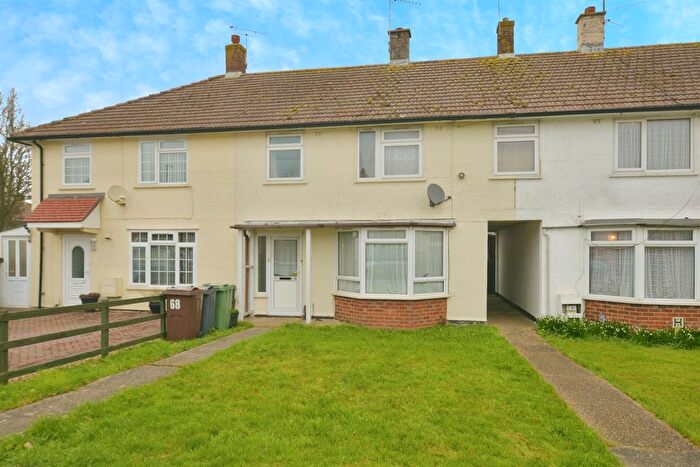
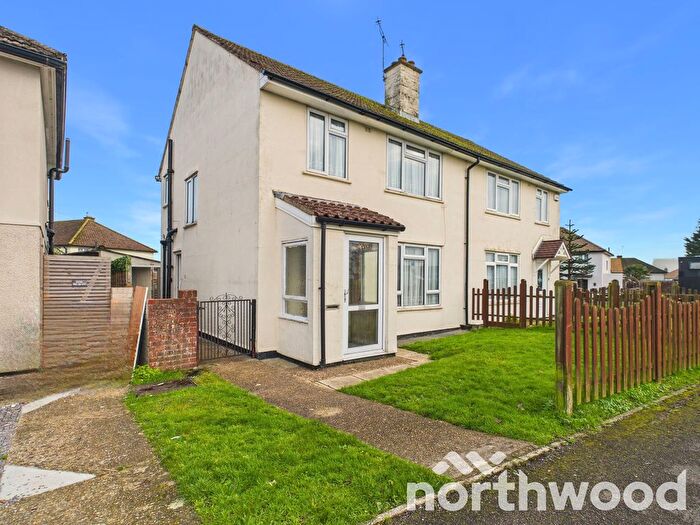
Properties for sale in Norman
Previously listed properties in Norman
Roads and Postcodes in Norman
Navigate through our locations to find the location of your next house in Norman, Ashford for sale or to rent.
| Streets | Postcodes |
|---|---|
| Ashford Designer Outlet | TN24 0DQ TN24 0SD |
| Austin Road | TN23 6JP TN23 6JR |
| Beaver Industrial Estate | TN23 7SH |
| Beaver Road | TN23 7SE TN23 7SF TN23 7SG TN23 7SJ TN23 7SP TN23 7SR TN23 7SS TN23 7ST TN23 7SW |
| Berry Place | TN23 4AS |
| Bramley Gardens | TN23 6GY |
| Cade Road | TN23 6JE |
| Carlen Cottages | TN23 7TN |
| Cherry Gardens | TN23 6LG |
| Concorde Mews | TN23 6AD |
| Denbigh Place | TN23 7TB |
| Denmark Terrace | TN23 7SZ |
| Denness Road | TN23 6JH |
| Ellingham Industrial Centre | TN23 6JU TN23 6JZ TN23 6LZ TN23 6NF |
| Forresters Place | TN23 7TH |
| Gallagher Retail Park | TN23 7DH |
| Hampden Lane | TN23 6JJ |
| Hampden Mews | TN23 6HX |
| Hampden Road | TN23 6JL TN23 6JN |
| Ireland Terrace | TN23 6AB |
| Kimberley Way | TN24 0SE |
| Kingsford Terrace | TN23 5AB |
| Kingsnorth Industrial Estate | TN23 6JY TN23 6LN |
| Kingsnorth Road | TN23 6HS TN23 6HT TN23 6HU TN23 6HY TN23 6HZ TN23 6JB TN23 6LS TN23 6LT TN23 6LU TN23 6LX TN23 6NB TN23 6ND TN23 6NE |
| Lower Denmark Road | TN23 7SU TN23 7SX TN23 7SY |
| Malcolm Sargent Road | TN23 6JW |
| Mortimer Close | TN23 6JF |
| Norman Road | TN23 7AD TN23 7DG |
| Park Place | TN23 6SL |
| Providence Street | TN23 7TW |
| Rigden Road | TN23 6JG TN23 6JQ |
| Riversdale Road | TN23 7TP TN23 7TR |
| Rose Villas | TN23 7TA |
| St Stephens Mews | TN23 5AW |
| Stanhope Road | TN23 5SZ |
| Sydney Street | TN23 7UA |
| Tennyson Road | TN23 6LP TN23 6LR |
| The Poplars | TN23 6HR |
| Thomas Close | TN23 6HA |
| Torrington Place | TN23 7TJ |
| Torrington Road | TN23 7TD TN23 7TF TN23 7TG TN23 7TE |
| Upper Denmark Road | TN23 7TZ |
| Whitfeld Cottages | TN23 7TT |
| Whitfeld Road | TN23 7TS TN23 7TU TN23 7TX TN23 7AB |
| Wotton Road | TN23 6JS TN23 6LL TN23 6LW |
Transport near Norman
- FAQ
- Price Paid By Year
- Property Type Price
Frequently asked questions about Norman
What is the average price for a property for sale in Norman?
The average price for a property for sale in Norman is £254,580. This amount is 30% lower than the average price in Ashford. There are 930 property listings for sale in Norman.
What streets have the most expensive properties for sale in Norman?
The streets with the most expensive properties for sale in Norman are Cherry Gardens at an average of £400,000, Riversdale Road at an average of £301,125 and Rose Villas at an average of £300,000.
What streets have the most affordable properties for sale in Norman?
The streets with the most affordable properties for sale in Norman are Whitfeld Cottages at an average of £159,000, Sydney Street at an average of £220,250 and Providence Street at an average of £221,382.
Which train stations are available in or near Norman?
Some of the train stations available in or near Norman are Ashford International, Wye and Ham Street.
Property Price Paid in Norman by Year
The average sold property price by year was:
| Year | Average Sold Price | Price Change |
Sold Properties
|
|---|---|---|---|
| 2025 | £263,819 | 4% |
36 Properties |
| 2024 | £253,261 | 2% |
41 Properties |
| 2023 | £248,103 | -4% |
43 Properties |
| 2022 | £257,175 | 10% |
45 Properties |
| 2021 | £231,823 | 4% |
69 Properties |
| 2020 | £223,309 | 5% |
46 Properties |
| 2019 | £211,205 | 1% |
44 Properties |
| 2018 | £208,453 | 6% |
48 Properties |
| 2017 | £195,528 | 5% |
47 Properties |
| 2016 | £186,667 | 10% |
53 Properties |
| 2015 | £168,497 | 11% |
69 Properties |
| 2014 | £150,615 | 2% |
61 Properties |
| 2013 | £147,662 | 9% |
48 Properties |
| 2012 | £134,974 | -2% |
25 Properties |
| 2011 | £137,350 | -3% |
40 Properties |
| 2010 | £140,807 | -7% |
26 Properties |
| 2009 | £150,681 | -1% |
38 Properties |
| 2008 | £151,597 | 2% |
42 Properties |
| 2007 | £148,162 | 6% |
83 Properties |
| 2006 | £139,585 | 5% |
98 Properties |
| 2005 | £132,406 | 5% |
77 Properties |
| 2004 | £125,509 | 17% |
80 Properties |
| 2003 | £104,203 | 18% |
69 Properties |
| 2002 | £85,321 | 16% |
81 Properties |
| 2001 | £71,445 | 10% |
80 Properties |
| 2000 | £64,042 | 20% |
64 Properties |
| 1999 | £51,106 | 5% |
54 Properties |
| 1998 | £48,460 | 8% |
50 Properties |
| 1997 | £44,408 | -1% |
60 Properties |
| 1996 | £44,659 | 10% |
47 Properties |
| 1995 | £40,029 | - |
46 Properties |
Property Price per Property Type in Norman
Here you can find historic sold price data in order to help with your property search.
The average Property Paid Price for specific property types in the last three years are:
| Property Type | Average Sold Price | Sold Properties |
|---|---|---|
| Semi Detached House | £279,210.00 | 19 Semi Detached Houses |
| Detached House | £343,571.00 | 7 Detached Houses |
| Terraced House | £245,360.00 | 92 Terraced Houses |
| Flat | £133,250.00 | 2 Flats |

