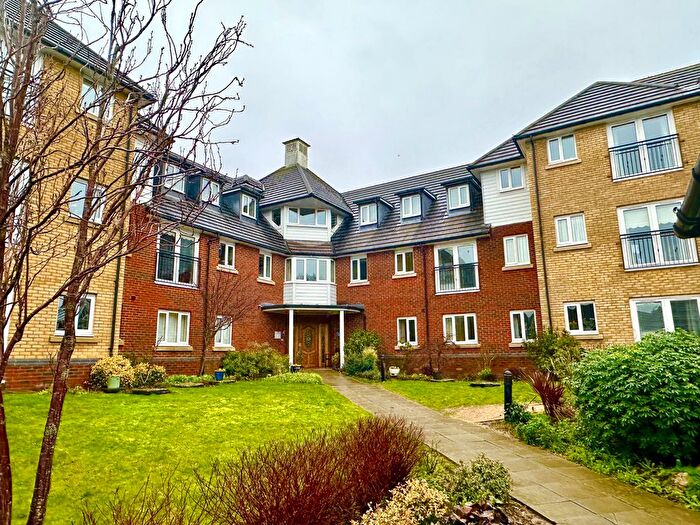
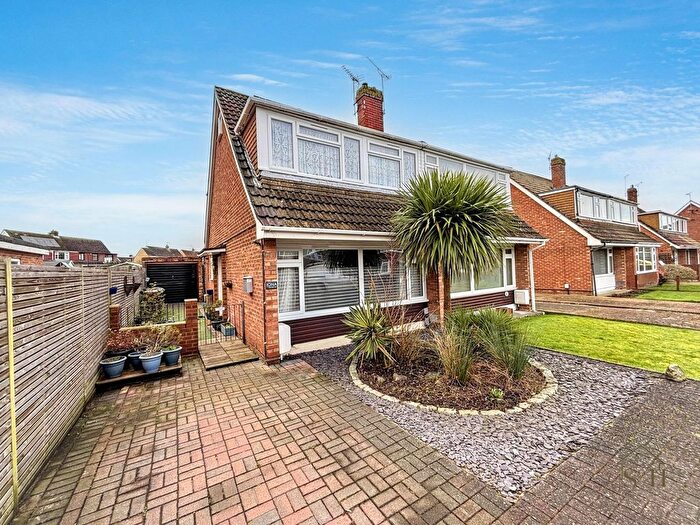
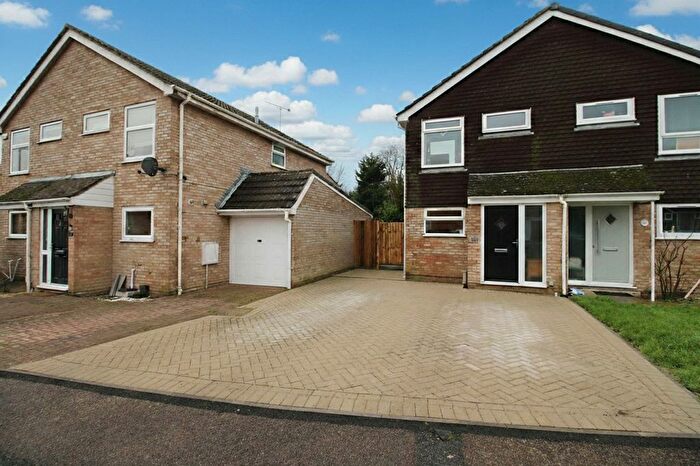
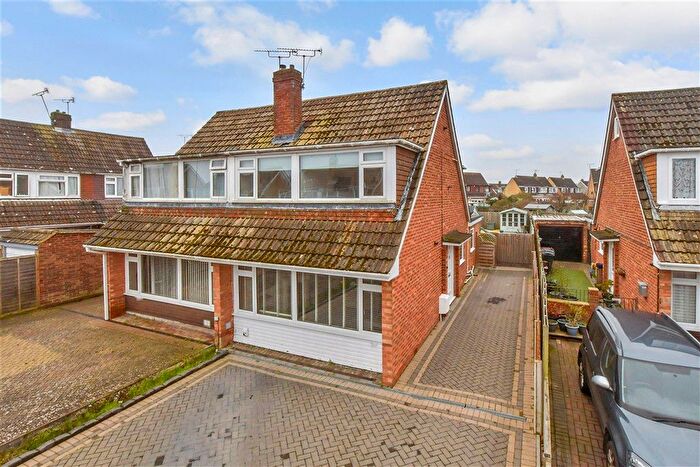
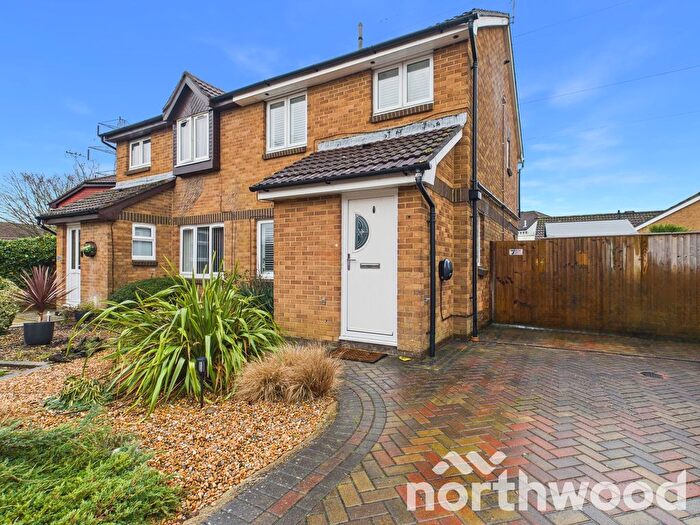
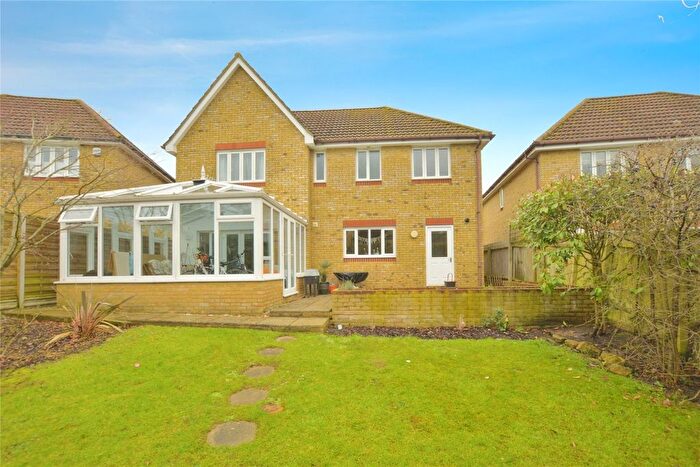
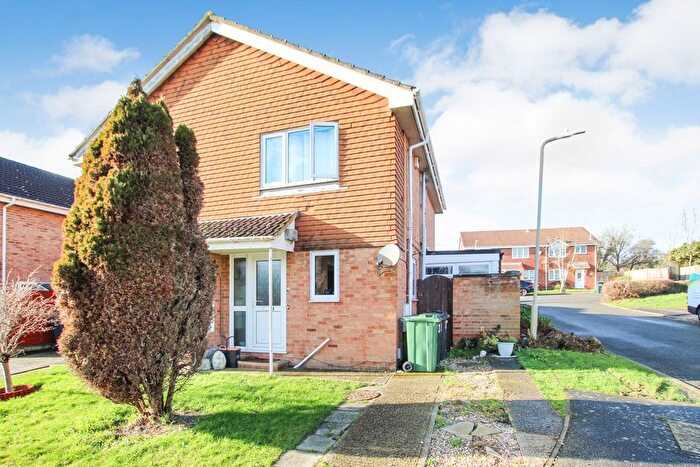
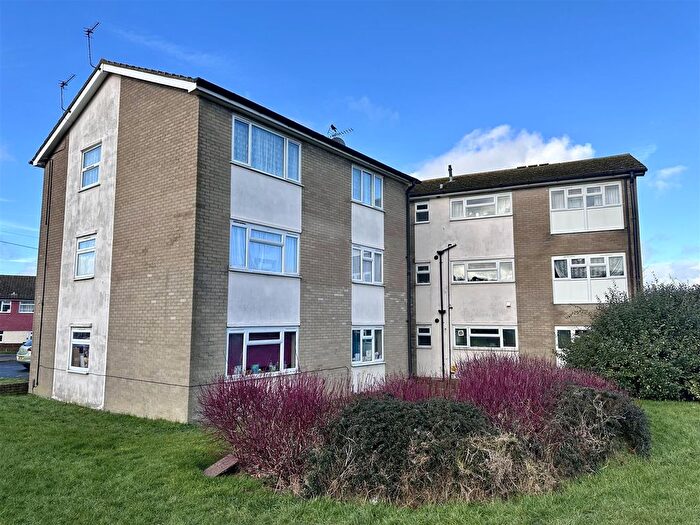
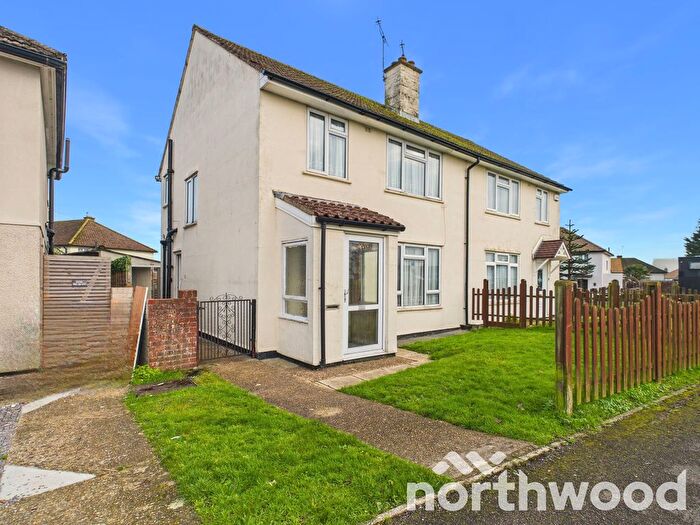
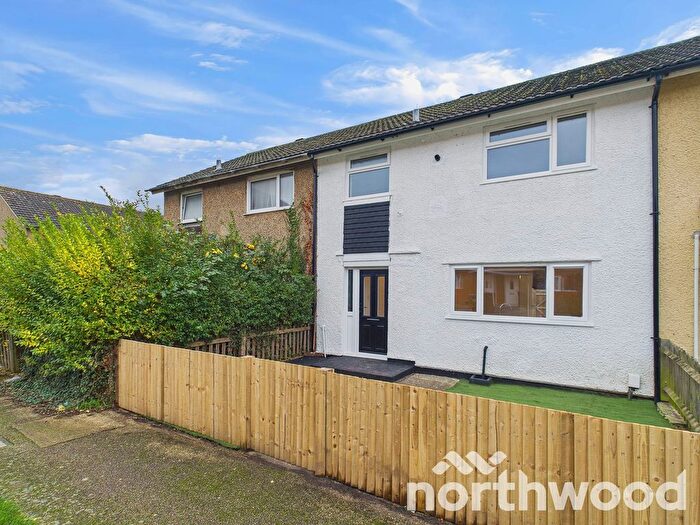
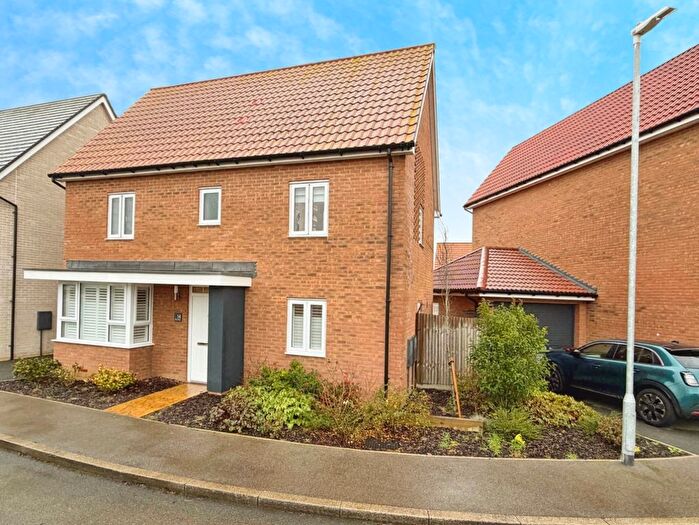
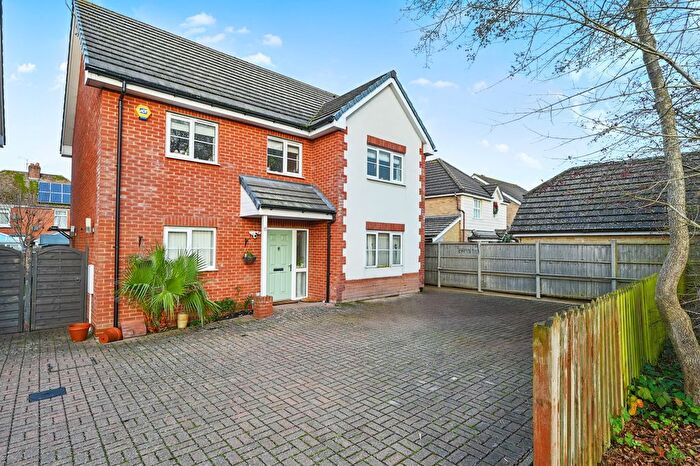
Houses for sale & to rent in Washford, Ashford
House Prices in Washford
Properties in Washford have an average house price of £300,404.00 and had 147 Property Transactions within the last 3 years¹.
Washford is an area in Ashford, Kent with 1,288 households², where the most expensive property was sold for £525,000.00.
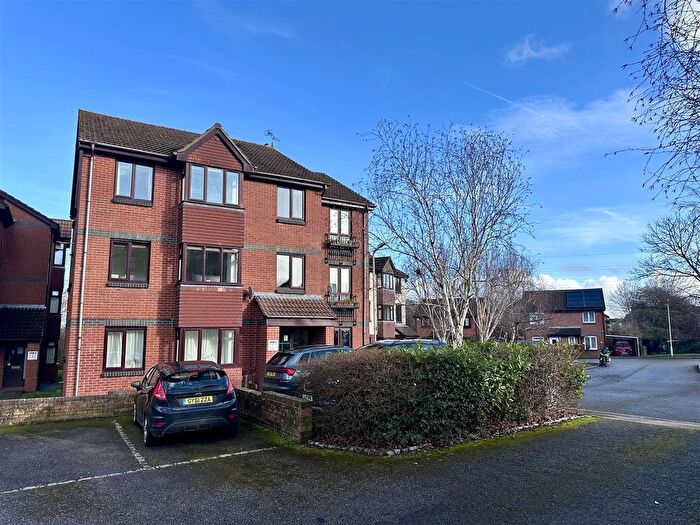
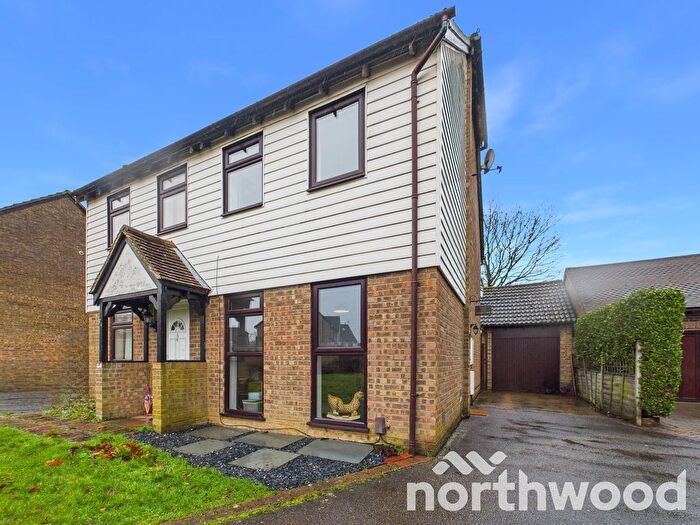
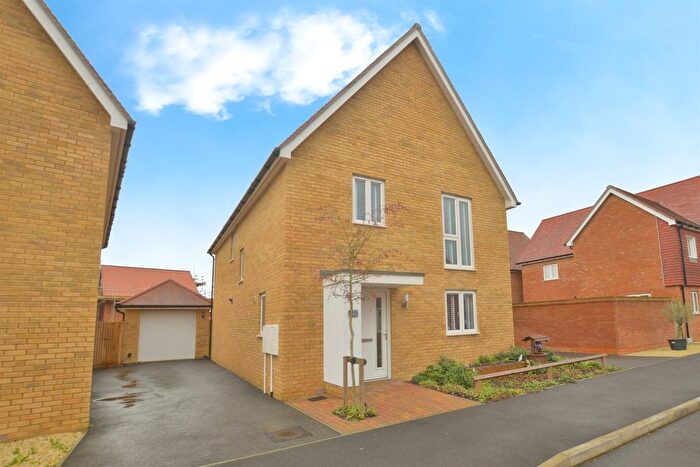
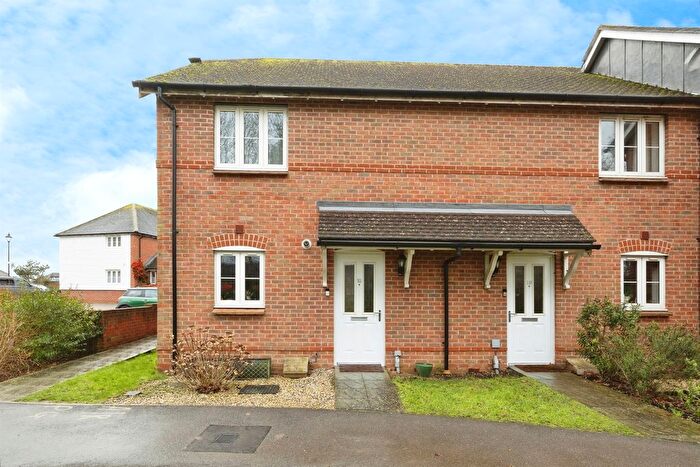
Properties for sale in Washford
Roads and Postcodes in Washford
Navigate through our locations to find the location of your next house in Washford, Ashford for sale or to rent.
| Streets | Postcodes |
|---|---|
| Bargates | TN23 5UD |
| Barley Way | TN23 3JA |
| Bensted | TN23 5YQ |
| Brentwood | TN23 5YH |
| Brisley Close | TN23 3HE TN23 3HF TN23 3HH |
| Brisley Court | TN23 3GE |
| Broadmead | TN23 5LJ |
| Charminster | TN23 5UH |
| Claygate | TN23 5YG |
| Colemans Close | TN23 3FW |
| Collie Drive | TN23 3GR |
| Collingbourne | TN23 5UE |
| Coulter Road | TN23 3HQ TN23 3JQ |
| Croftwood | TN23 5JW |
| Down Court | TN23 5YJ |
| Farmers Way | TN23 3FY |
| Flimwell | TN23 5LF |
| Forum Way | TN23 3RJ |
| Godwin Court | TN23 3FX |
| Green Lane | TN23 5YE |
| Greencroft | TN23 5LG |
| Harrow Way | TN23 3JB |
| Hay Wain Close | TN23 3QL |
| Hedgers Way | TN23 3GN |
| Hestia Way | TN23 3RH |
| Hever Gardens | TN23 5GN |
| Holdenhurst | TN23 5UT |
| Jupiter Lane | TN23 3RL |
| Langney Drive | TN23 5UF TN23 5UL |
| Lodge Close | TN23 5FB |
| Merino Way | TN23 3GS |
| Millbank Road | TN23 3JD |
| Newlands | TN23 5LA |
| Octavian Way | TN23 3RN |
| Penn Hill | TN23 5UG |
| Perch Close | TN23 5FN |
| Ploughmans Way | TN23 3HU |
| Richborough Way | TN23 3RP |
| Shepherd Close | TN23 3GT |
| Southbourne | TN23 5UB |
| Speldhurst Close | TN23 5GL TN23 5TN TN23 5TP TN23 5TR TN23 5TS TN23 5TW TN23 5TJ |
| The Burrows | TN23 5FL |
| The Haven | TN23 3NA |
| Washford Farm Road | TN23 5YA TN23 5YB TN23 5YD |
| Wesley School Road | TN23 5LW |
| Westbourne | TN23 5UY |
| Westmoors | TN23 5UQ |
| Willingdon | TN23 5YF |
| Wivenhoe | TN23 5YL |
| Woodside | TN23 5LQ |
| TN23 3JF |
Transport near Washford
- FAQ
- Price Paid By Year
- Property Type Price
Frequently asked questions about Washford
What is the average price for a property for sale in Washford?
The average price for a property for sale in Washford is £300,404. This amount is 17% lower than the average price in Ashford. There are 1,042 property listings for sale in Washford.
What streets have the most expensive properties for sale in Washford?
The streets with the most expensive properties for sale in Washford are Brisley Court at an average of £525,000, Shepherd Close at an average of £487,500 and Millbank Road at an average of £477,000.
What streets have the most affordable properties for sale in Washford?
The streets with the most affordable properties for sale in Washford are Hever Gardens at an average of £194,250, Hestia Way at an average of £211,800 and Colemans Close at an average of £223,333.
Which train stations are available in or near Washford?
Some of the train stations available in or near Washford are Ashford International, Ham Street and Pluckley.
Property Price Paid in Washford by Year
The average sold property price by year was:
| Year | Average Sold Price | Price Change |
Sold Properties
|
|---|---|---|---|
| 2025 | £324,236 | 10% |
57 Properties |
| 2024 | £292,101 | 6% |
54 Properties |
| 2023 | £275,124 | -12% |
36 Properties |
| 2022 | £307,902 | 13% |
77 Properties |
| 2021 | £268,948 | 1% |
74 Properties |
| 2020 | £267,129 | 6% |
60 Properties |
| 2019 | £251,840 | -1% |
62 Properties |
| 2018 | £255,086 | 3% |
65 Properties |
| 2017 | £246,456 | -1% |
76 Properties |
| 2016 | £247,876 | 14% |
63 Properties |
| 2015 | £213,971 | 2% |
124 Properties |
| 2014 | £210,152 | 3% |
90 Properties |
| 2013 | £203,444 | 11% |
60 Properties |
| 2012 | £180,535 | 3% |
42 Properties |
| 2011 | £175,996 | 1% |
78 Properties |
| 2010 | £173,508 | 8% |
92 Properties |
| 2009 | £160,123 | -4% |
47 Properties |
| 2008 | £167,150 | -9% |
38 Properties |
| 2007 | £181,949 | -6% |
85 Properties |
| 2006 | £192,566 | 6% |
139 Properties |
| 2005 | £181,912 | 4% |
127 Properties |
| 2004 | £173,948 | 16% |
136 Properties |
| 2003 | £146,670 | 7% |
139 Properties |
| 2002 | £136,490 | 14% |
141 Properties |
| 2001 | £116,946 | 18% |
104 Properties |
| 2000 | £96,034 | 38% |
90 Properties |
| 1999 | £59,884 | 5% |
48 Properties |
| 1998 | £56,880 | 7% |
49 Properties |
| 1997 | £53,094 | 5% |
65 Properties |
| 1996 | £50,627 | 4% |
37 Properties |
| 1995 | £48,531 | - |
40 Properties |
Property Price per Property Type in Washford
Here you can find historic sold price data in order to help with your property search.
The average Property Paid Price for specific property types in the last three years are:
| Property Type | Average Sold Price | Sold Properties |
|---|---|---|
| Semi Detached House | £297,291.00 | 72 Semi Detached Houses |
| Detached House | £425,807.00 | 26 Detached Houses |
| Terraced House | £256,337.00 | 37 Terraced Houses |
| Flat | £183,250.00 | 12 Flats |

