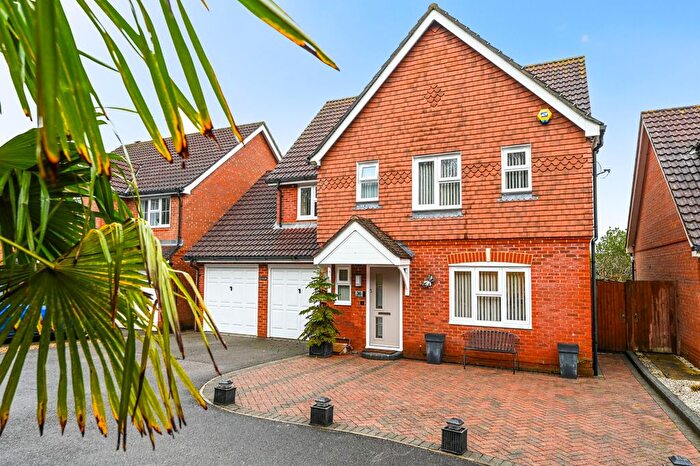
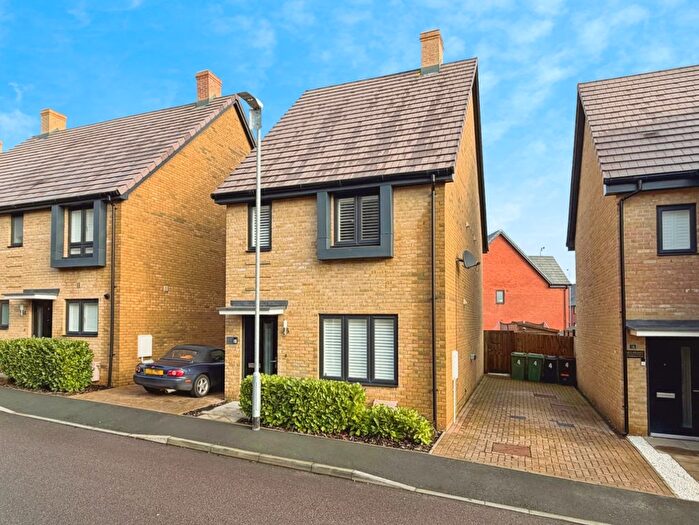
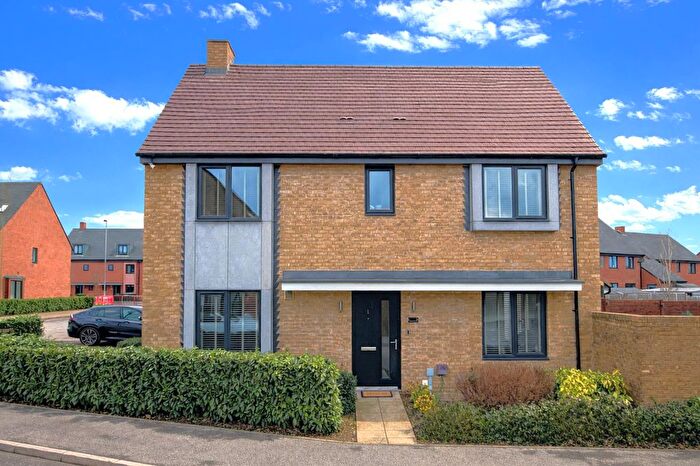
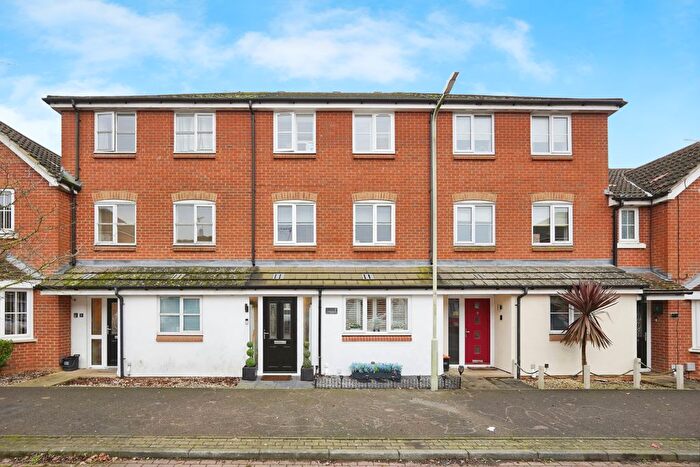
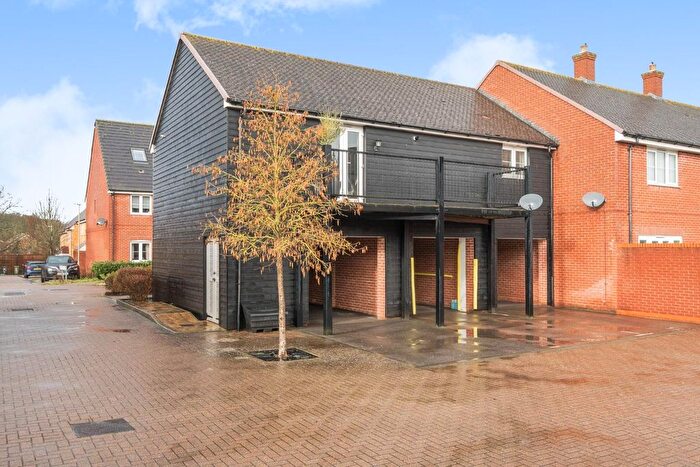
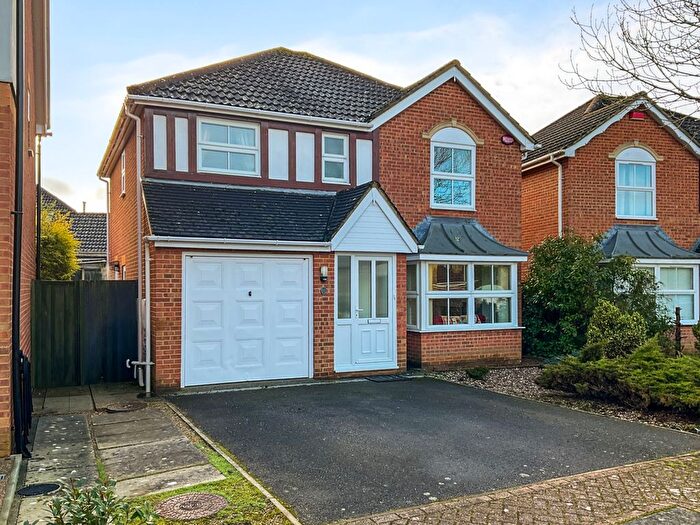
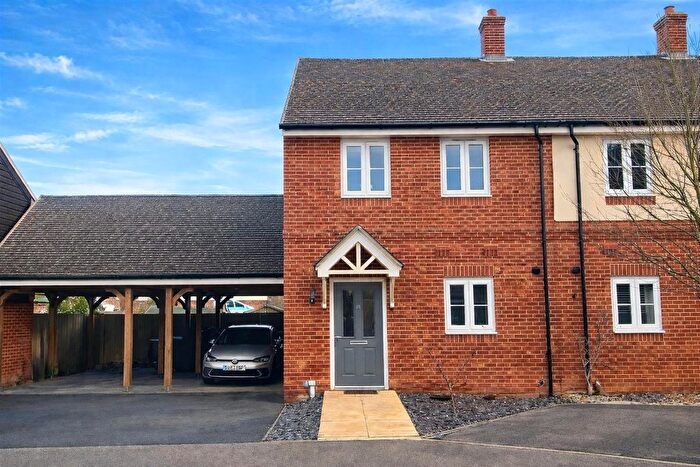
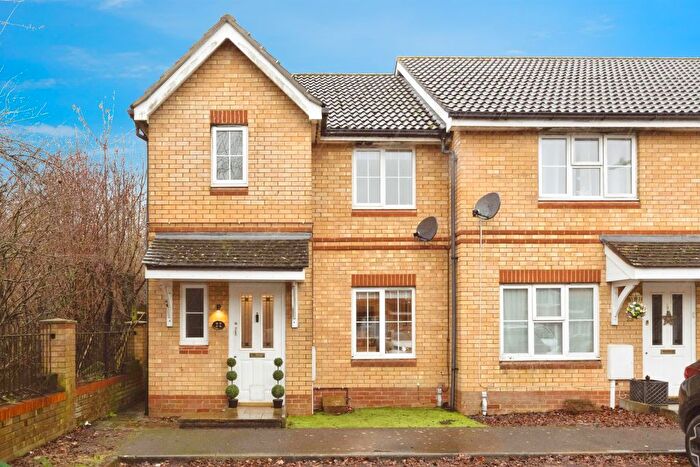
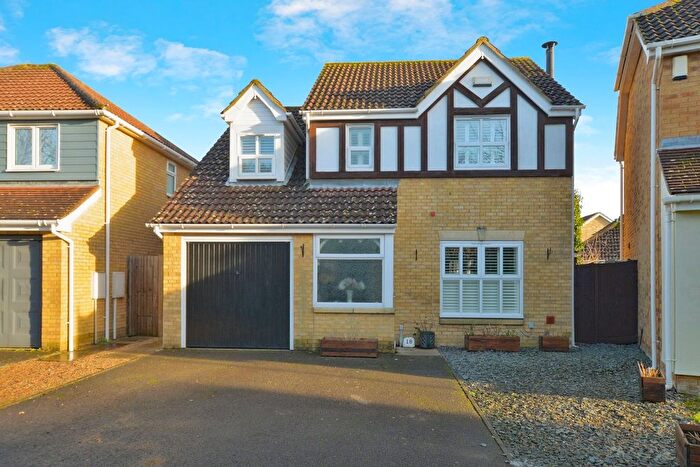
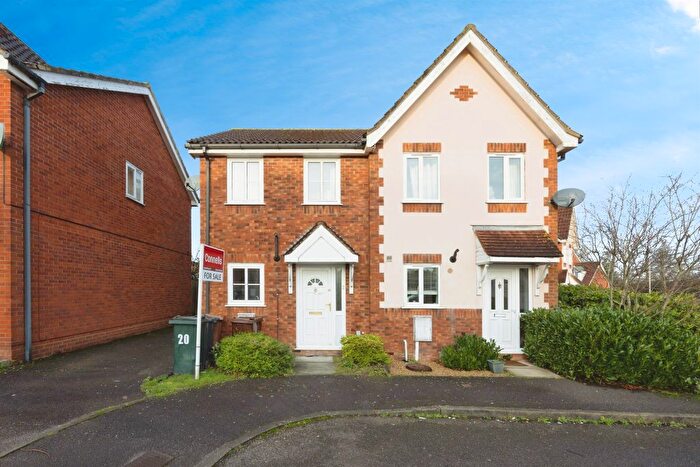
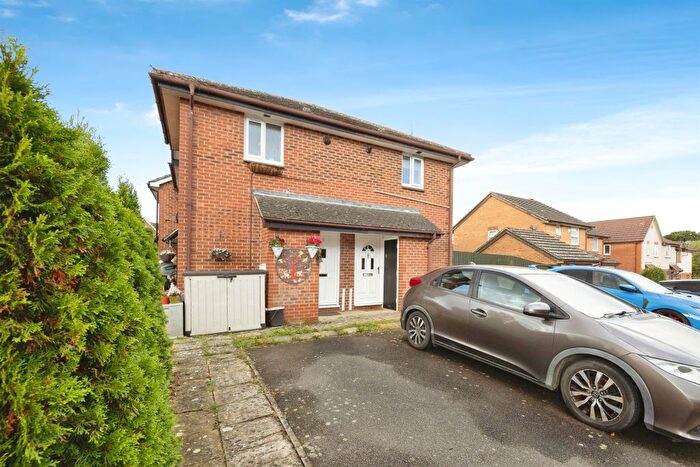
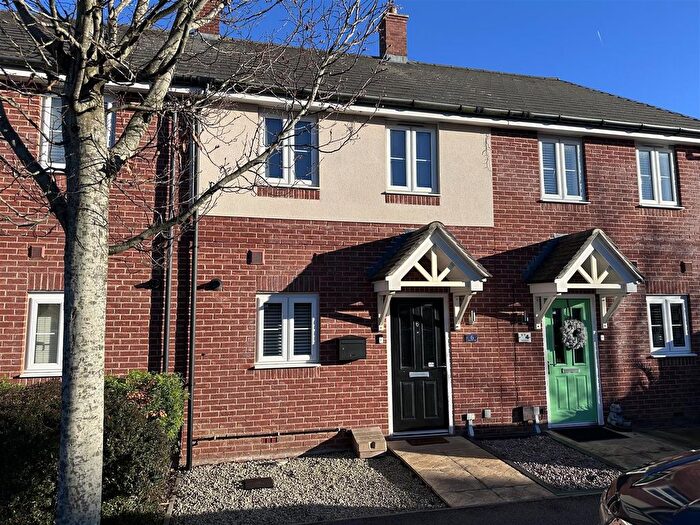
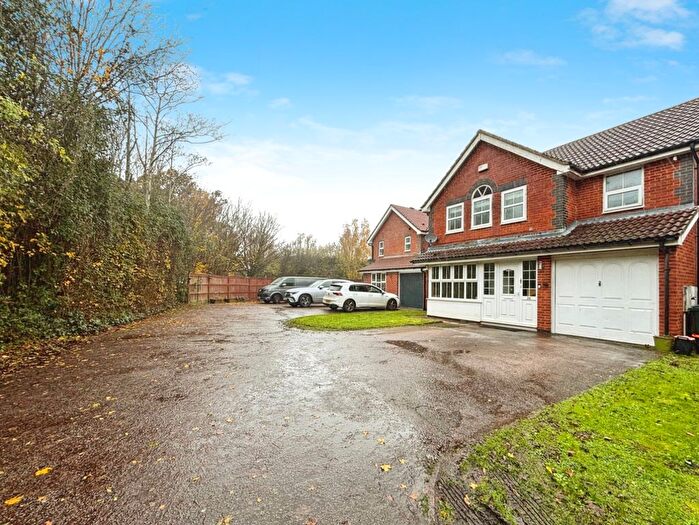
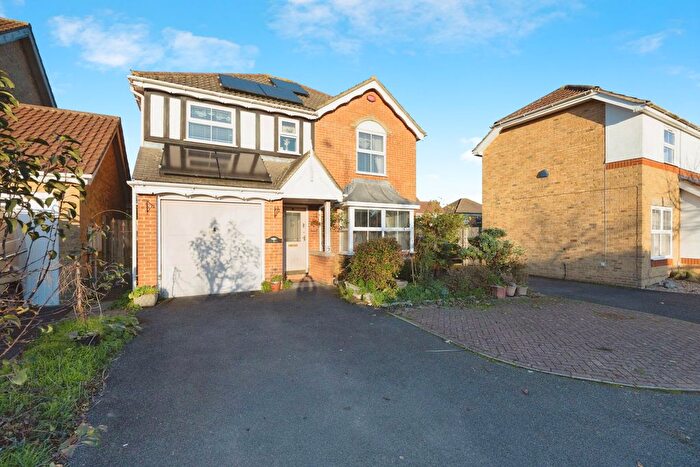
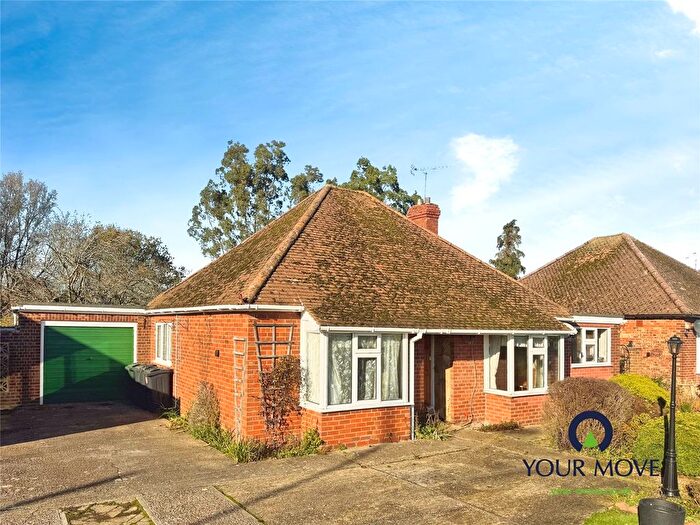
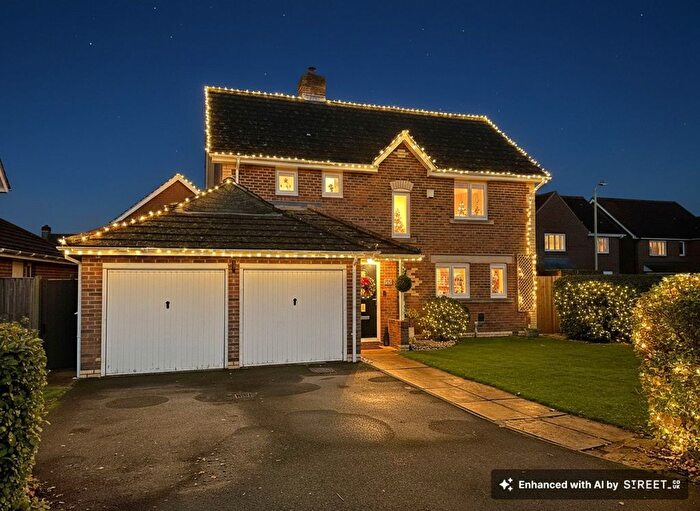
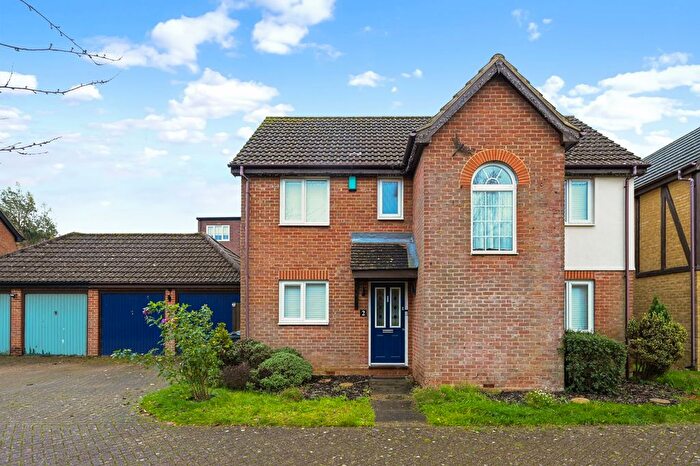
Houses for sale & to rent in Park Farm South, Ashford
House Prices in Park Farm South
Properties in Park Farm South have an average house price of £328,954.00 and had 141 Property Transactions within the last 3 years¹.
Park Farm South is an area in Ashford, Kent with 1,079 households², where the most expensive property was sold for £600,000.00.
Properties for sale in Park Farm South
Previously listed properties in Park Farm South
Roads and Postcodes in Park Farm South
Navigate through our locations to find the location of your next house in Park Farm South, Ashford for sale or to rent.
| Streets | Postcodes |
|---|---|
| Bishopswood | TN23 3RD |
| Blackthorn Way | TN23 3QB |
| Bluebell Road | TN23 3GJ TN23 3NW |
| Bramble Walk | TN23 3GF |
| Bridleway Lane | TN23 3LN |
| Bryony Drive | TN23 3RE TN23 3RF TN23 3RG |
| Chaffinch Drive | TN23 3QD |
| Dove Close | TN23 3NU |
| Field View | TN23 3NZ |
| Hawthorn Road | TN23 3LT |
| Kestrel Close | TN23 3RB |
| Lapwing Drive | TN23 3QJ |
| New Rectory Lane | TN23 3LY |
| Orchid Court | TN23 3GG |
| Poppy Mead | TN23 3GL |
| Primrose Drive | TN23 3NP |
| Reed Crescent | TN23 3PA |
| Ruffetts Wood | TN23 3QQ |
| Silver Birch Grove | TN23 3LX |
| Skylark Way | TN23 3QH |
| Snowbell Road | TN23 3NF |
| Violet Way | TN23 3GH |
| Wood Lane | TN23 3AG TN23 3AQ |
Transport near Park Farm South
-
Ashford International Station
-
Ham Street Station
-
Wye Station
-
Pluckley Station
-
Appledore Station
-
Charing Station
-
Westenhanger Station
-
Sandling Station
-
Chilham Station
- FAQ
- Price Paid By Year
- Property Type Price
Frequently asked questions about Park Farm South
What is the average price for a property for sale in Park Farm South?
The average price for a property for sale in Park Farm South is £328,954. This amount is 9% lower than the average price in Ashford. There are 548 property listings for sale in Park Farm South.
What streets have the most expensive properties for sale in Park Farm South?
The streets with the most expensive properties for sale in Park Farm South are Ruffetts Wood at an average of £528,125, Primrose Drive at an average of £511,166 and Snowbell Road at an average of £492,500.
What streets have the most affordable properties for sale in Park Farm South?
The streets with the most affordable properties for sale in Park Farm South are Lapwing Drive at an average of £201,250, Poppy Mead at an average of £226,000 and Bryony Drive at an average of £250,386.
Which train stations are available in or near Park Farm South?
Some of the train stations available in or near Park Farm South are Ashford International, Ham Street and Wye.
Property Price Paid in Park Farm South by Year
The average sold property price by year was:
| Year | Average Sold Price | Price Change |
Sold Properties
|
|---|---|---|---|
| 2025 | £321,473 | -1% |
58 Properties |
| 2024 | £325,780 | -5% |
36 Properties |
| 2023 | £340,617 | 5% |
47 Properties |
| 2022 | £323,842 | 16% |
54 Properties |
| 2021 | £272,656 | -5% |
102 Properties |
| 2020 | £286,767 | 9% |
61 Properties |
| 2019 | £260,997 | -12% |
65 Properties |
| 2018 | £291,160 | 7% |
51 Properties |
| 2017 | £271,038 | 5% |
50 Properties |
| 2016 | £258,159 | -1% |
53 Properties |
| 2015 | £259,544 | 17% |
51 Properties |
| 2014 | £216,623 | -4% |
67 Properties |
| 2013 | £225,738 | 9% |
44 Properties |
| 2012 | £206,060 | 6% |
33 Properties |
| 2011 | £193,163 | 2% |
43 Properties |
| 2010 | £188,429 | 7% |
65 Properties |
| 2009 | £174,744 | -10% |
68 Properties |
| 2008 | £192,723 | -8% |
99 Properties |
| 2007 | £208,884 | 4% |
147 Properties |
| 2006 | £199,524 | 3% |
73 Properties |
| 2005 | £193,788 | 12% |
72 Properties |
| 2004 | £169,965 | -5% |
117 Properties |
| 2003 | £178,255 | 20% |
137 Properties |
| 2002 | £142,873 | 13% |
168 Properties |
| 2001 | £124,719 | 14% |
148 Properties |
| 2000 | £106,825 | 12% |
157 Properties |
| 1999 | £94,325 | -12% |
97 Properties |
| 1998 | £105,987 | -12% |
33 Properties |
| 1997 | £118,264 | 23% |
66 Properties |
| 1996 | £90,916 | 5% |
70 Properties |
| 1995 | £86,340 | - |
64 Properties |
Property Price per Property Type in Park Farm South
Here you can find historic sold price data in order to help with your property search.
The average Property Paid Price for specific property types in the last three years are:
| Property Type | Average Sold Price | Sold Properties |
|---|---|---|
| Semi Detached House | £321,934.00 | 29 Semi Detached Houses |
| Terraced House | £280,124.00 | 56 Terraced Houses |
| Flat | £183,214.00 | 14 Flats |
| Detached House | £447,488.00 | 42 Detached Houses |

