
Houses for sale in Aylesford, Kent
House Prices in Aylesford
Properties in Aylesford have an average house price of £375k and had 913 Property Transactions within the last 3 years.¹
Aylesford is an area in Kent with 8,948 households², where the most expensive property was sold for £1.53M.
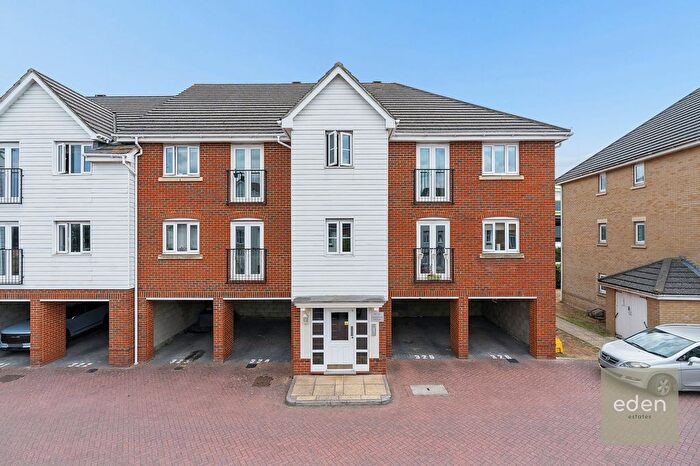
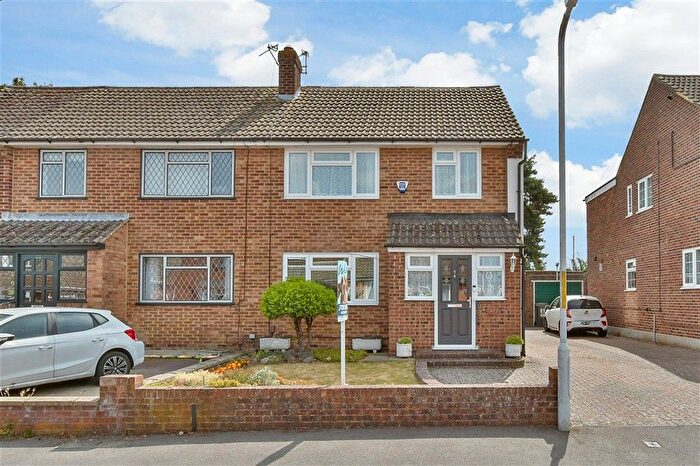
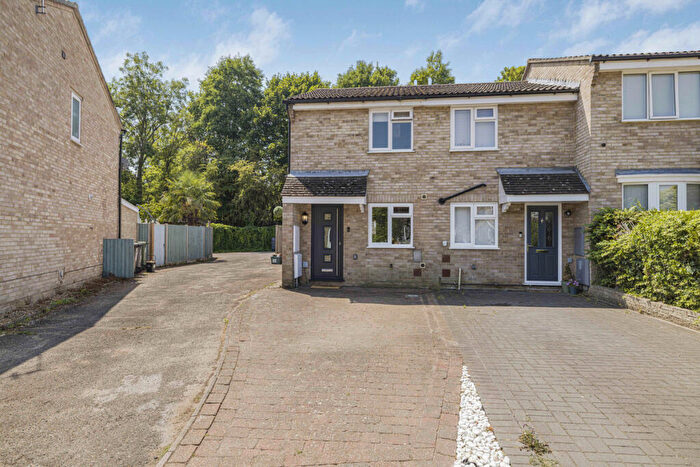
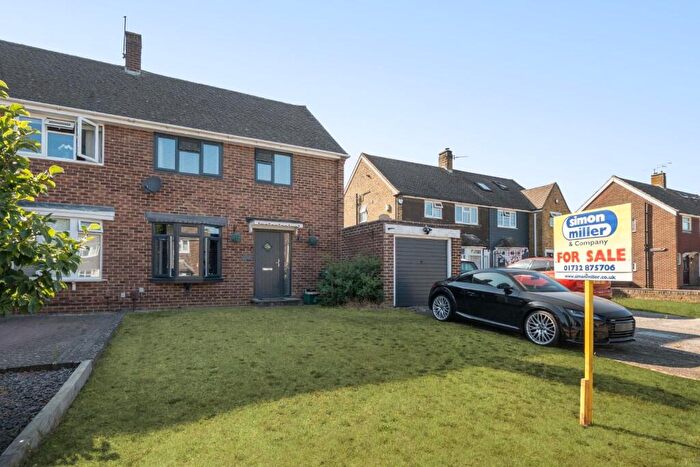
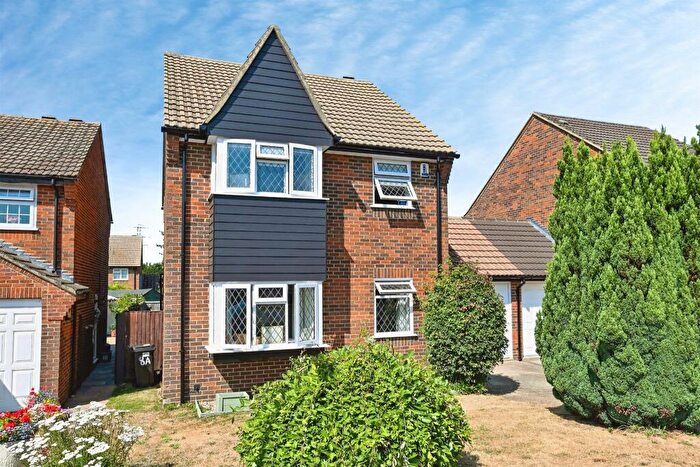
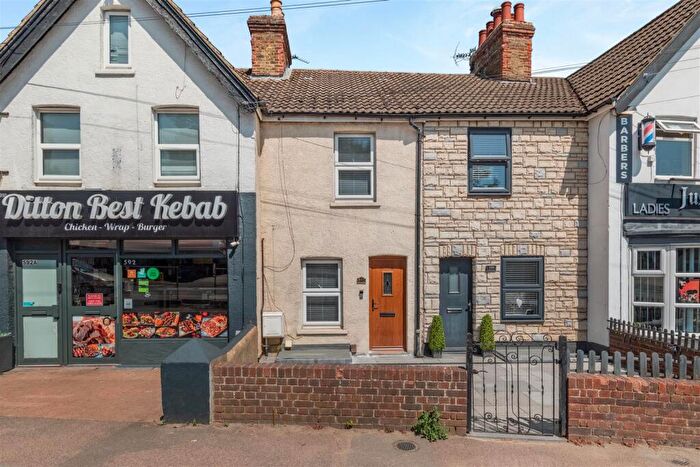
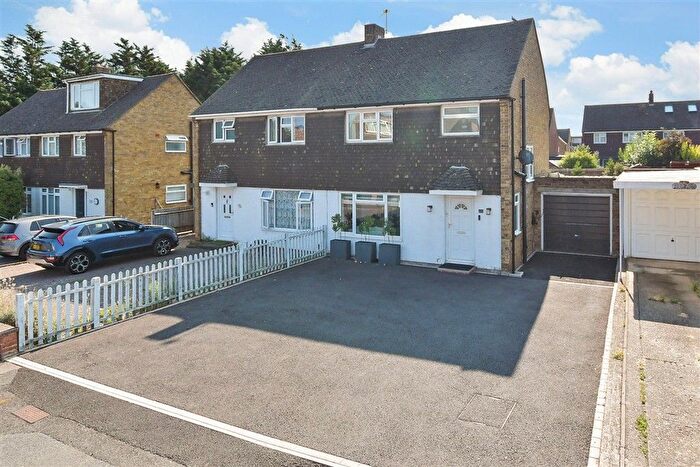
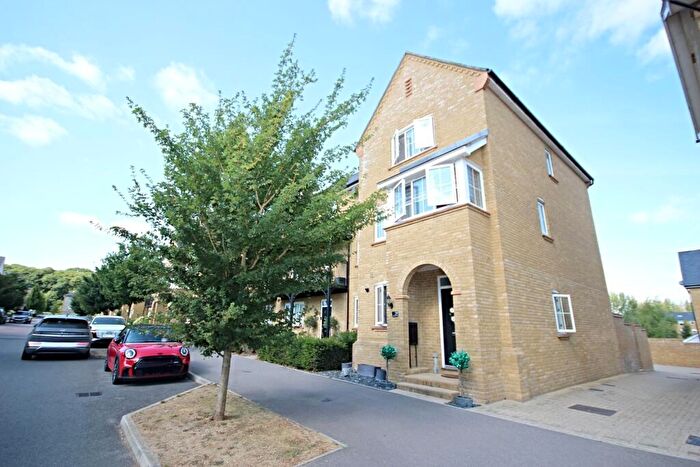
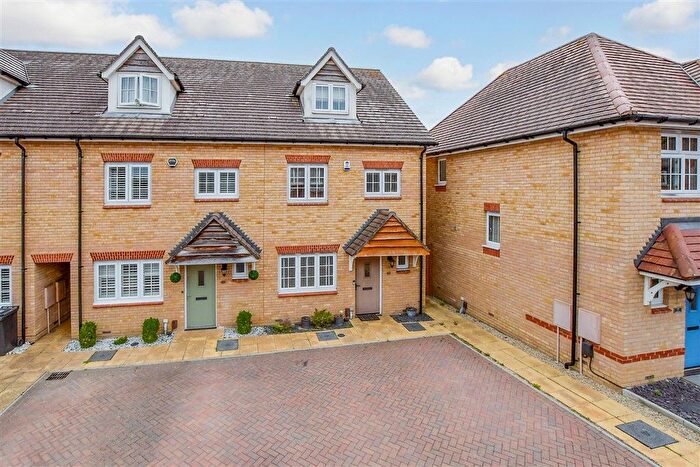
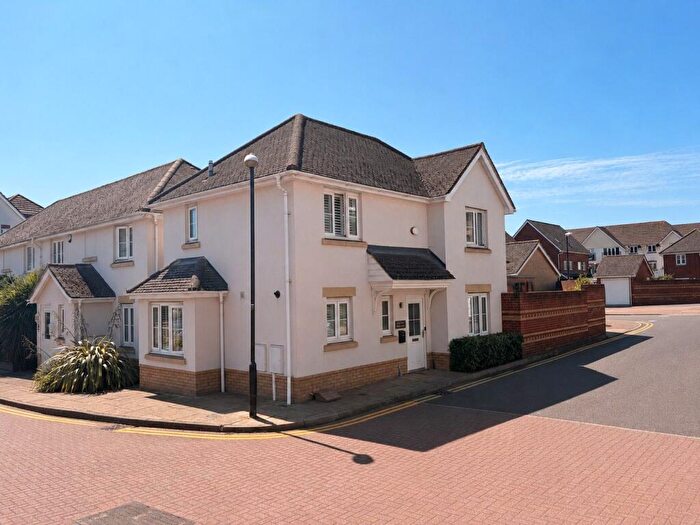
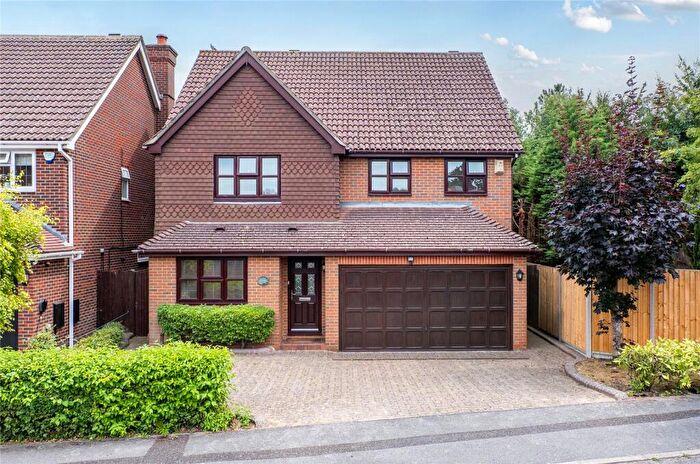
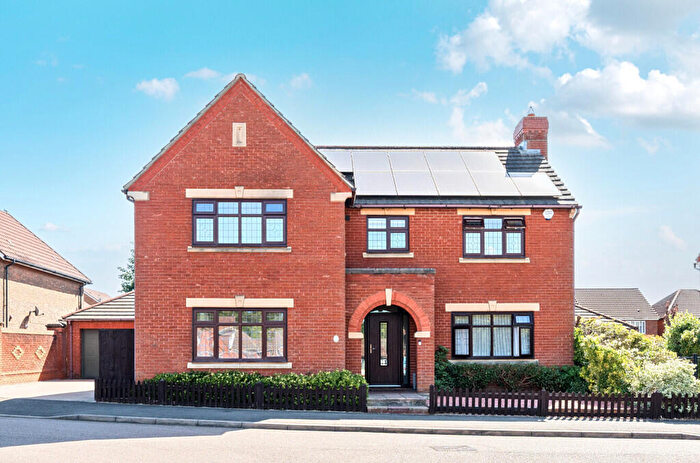
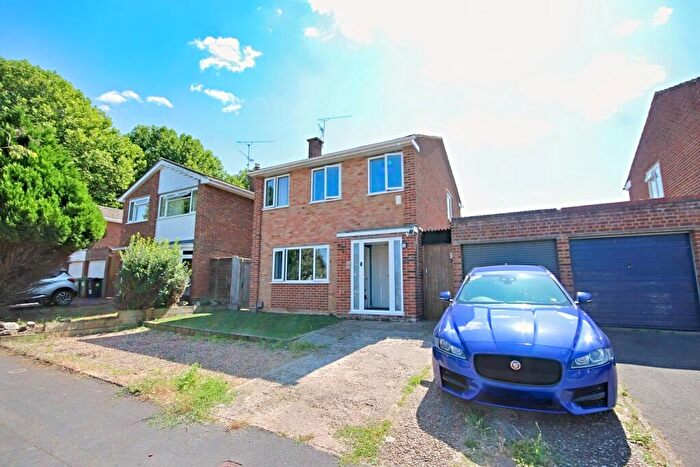
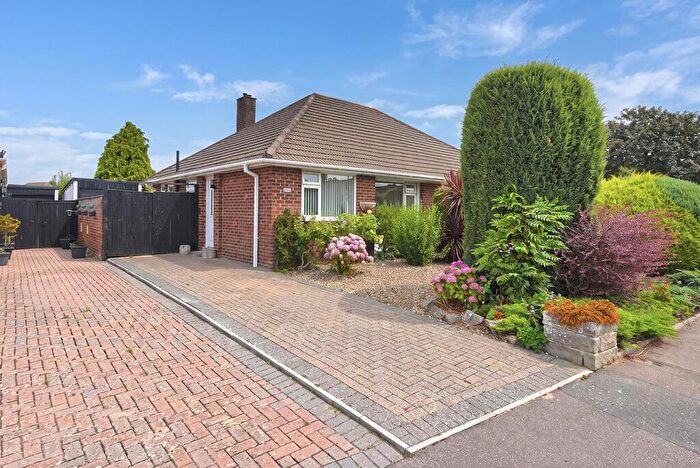
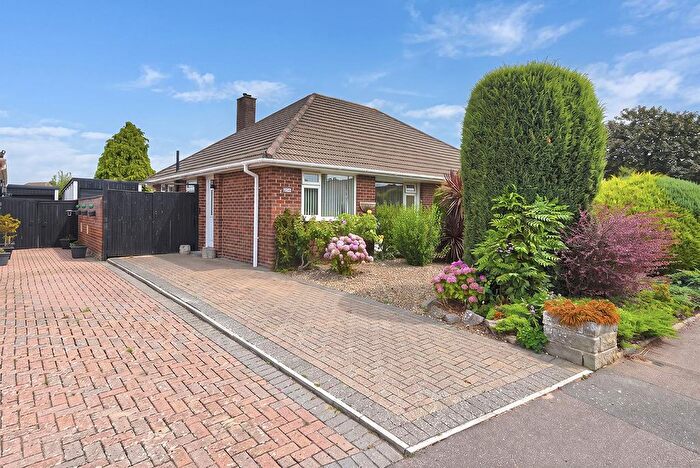
Properties for sale in Aylesford
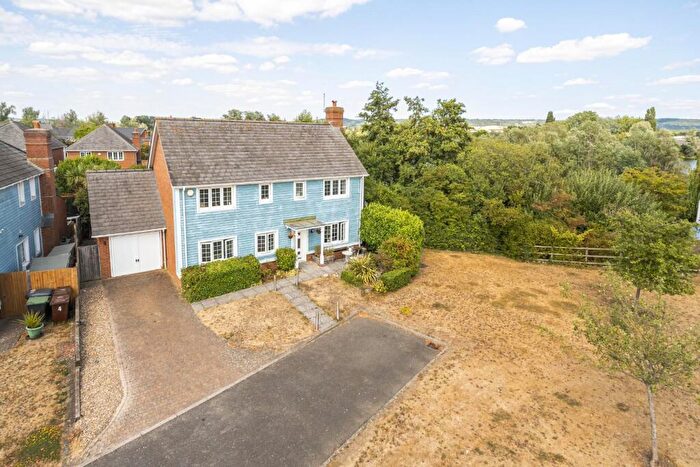
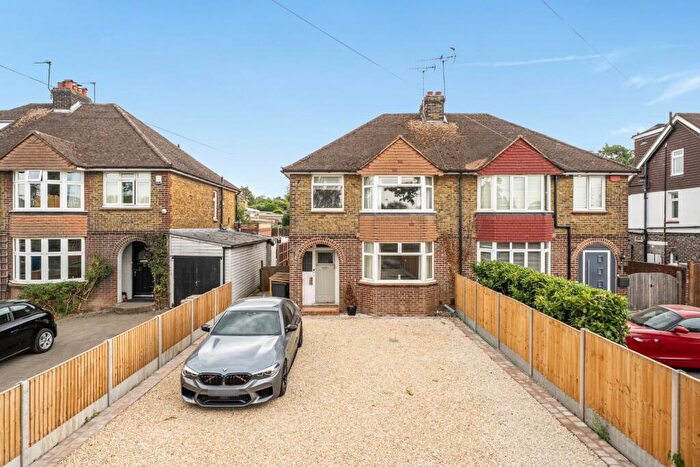
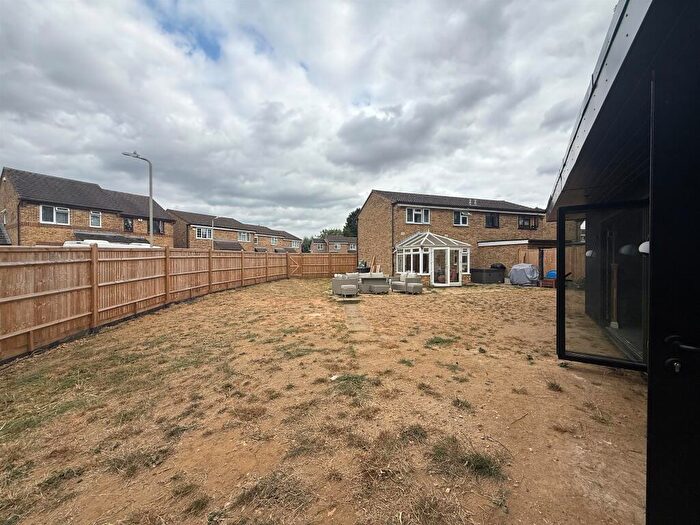
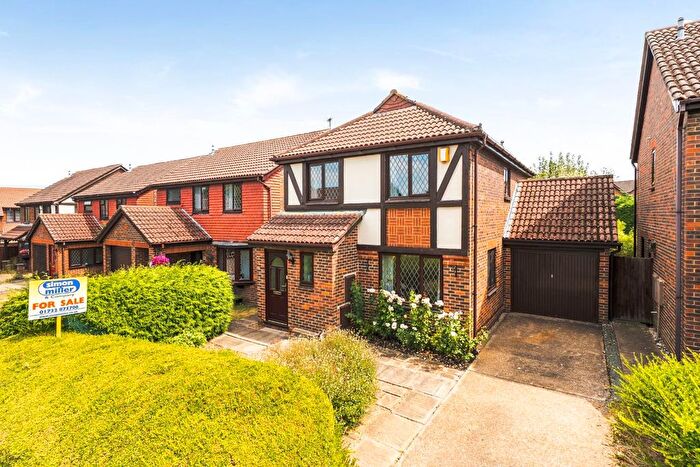
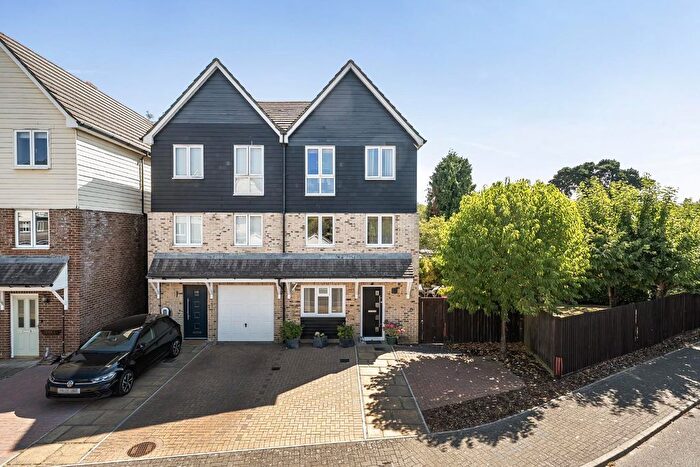
![]()
If you are looking to sell your house, let it out, or receive a property valuation, an expert can help you.
Click the button below to get started.

Neighbourhoods in Aylesford
Navigate through our locations to find the location of your next house in Aylesford, Kent for sale or to rent.
- Aylesford
- Blue Bell Hill And Walderslade
- Boxley
- Burham, Eccles And Wouldham
- Ditton
- Larkfield North
- Larkfield South
- Snodland East and Ham Hill
- Aylesford North and Walderslade
- Aylesford South
- Burham and Wouldham
- Snodland West & Holborough Lakes
- Larkfield
- Aylesford North & North Downs
- Aylesford South & Ditton
- Snodland East & Ham Hill
Property price trends in Aylesford
According to the latest Land Registry data, the average home in Aylesford sold for £442,375 in 2026. That figure comes from a substantial record of 11,067 sales logged over the past 31 years.
Prices have continued to climb over the last three years. Compared with 2023, when the typical sale came in around £363,916, that's a rise of roughly 21.6%.
Looking back five years, average prices are up about 31.1% since 2021, a gain of around £104,911 in cash terms.
Zoom out to the past decade for the fuller picture. Back in 2016, homes here averaged £314,776, so the typical sold price has climbed about 40.5% since then, roughly 3.5% a year. Stretch the view to fifteen years and that annual pace edges up closer to 5%.
Frequently asked questions about Aylesford
What is the average price for a property for sale in Aylesford?
The average price for a property for sale in Aylesford is £375,185. This amount is 4% lower than the average price in Kent. There are 4,794 property listings for sale in Aylesford.
What locations have the most expensive properties for sale in Aylesford?
The locations with the most expensive properties for sale in Aylesford are Burham and Wouldham at an average of £830,000, Blue Bell Hill And Walderslade at an average of £810,400 and Aylesford at an average of £449,431.
What locations have the most affordable properties for sale in Aylesford?
The locations with the most affordable properties for sale in Aylesford are Burham, Eccles And Wouldham at an average of £293,258, Aylesford South at an average of £339,000 and Boxley at an average of £349,250.
Which train stations are available in or near Aylesford?
Some of the train stations available in or near Aylesford are Aylesford, New Hythe and East Malling.
Property Price Paid in Aylesford by Year
The average sold property price by year was:
| Year | Average Sold Price | Price Change |
Sold Properties
|
|---|---|---|---|
| 2026 | £442,375 | 14% |
20 Properties |
| 2025 | £379,702 | 1% |
308 Properties |
| 2024 | £376,122 | 3% |
316 Properties |
| 2023 | £363,916 | -5% |
269 Properties |
| 2022 | £382,558 | 12% |
351 Properties |
| 2021 | £337,464 | 0,2% |
486 Properties |
| 2020 | £336,862 | 9% |
317 Properties |
| 2019 | £307,925 | -5% |
323 Properties |
| 2018 | £323,792 | 3% |
331 Properties |
| 2017 | £312,715 | -1% |
421 Properties |
Property Price per Property Type in Aylesford
Here you can find historic sold price data in order to help with your property search.
The average Property Paid Price for specific property types in the last three years are:
| Property Type | Average Sold Price | Sold Properties |
|---|---|---|
| Semi Detached House | £388,279.00 | 380 Semi Detached Houses |
| Detached House | £578,757.00 | 129 Detached Houses |
| Terraced House | £319,256.00 | 300 Terraced Houses |
| Flat | £236,167.00 | 104 Flats |
Transport in Aylesford
Please see below transportation links in this area:
