Houses for sale & to rent in Birchington North, Birchington
House Prices in Birchington North
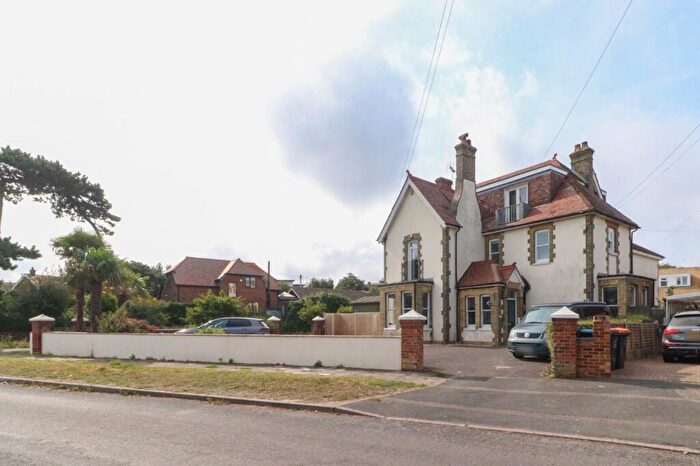
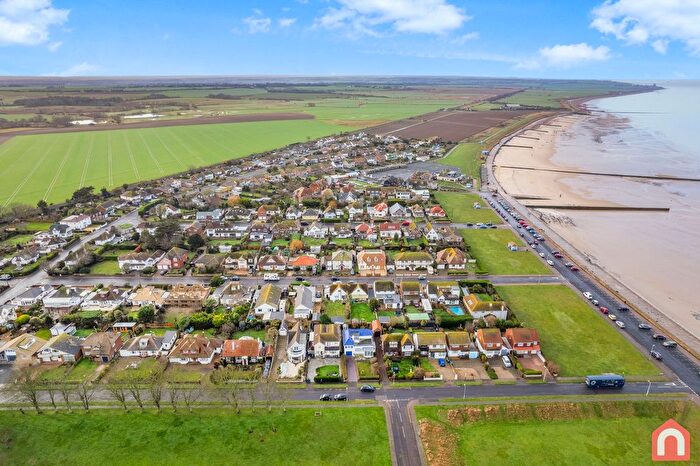
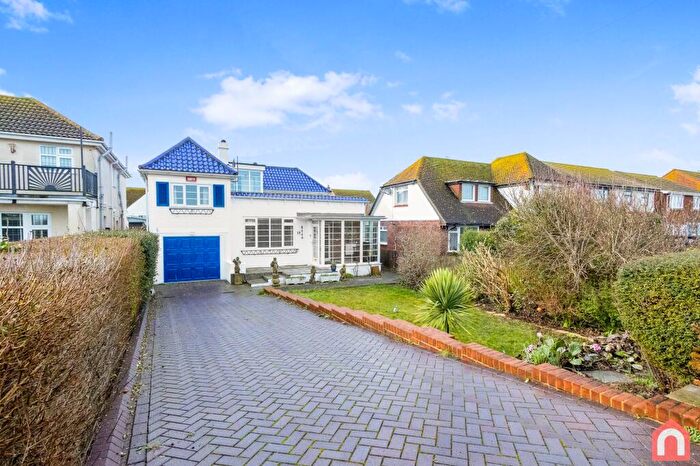
Properties in Birchington North have an average house price of £389,073.00 and had 200 Property Transactions within the last 3 years¹.
Birchington North is an area in Birchington, Kent with 1,836 households², where the most expensive property was sold for £1,212,500.00.
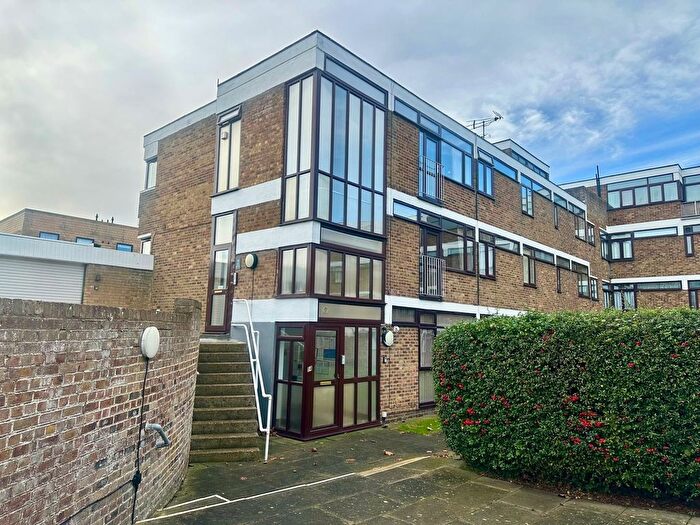
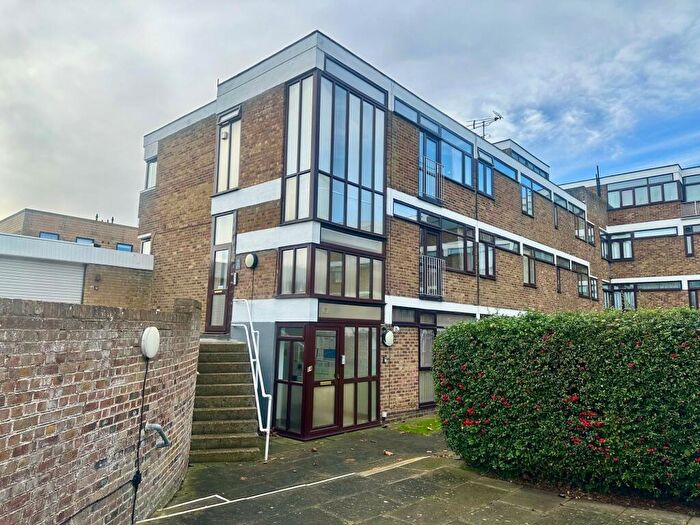
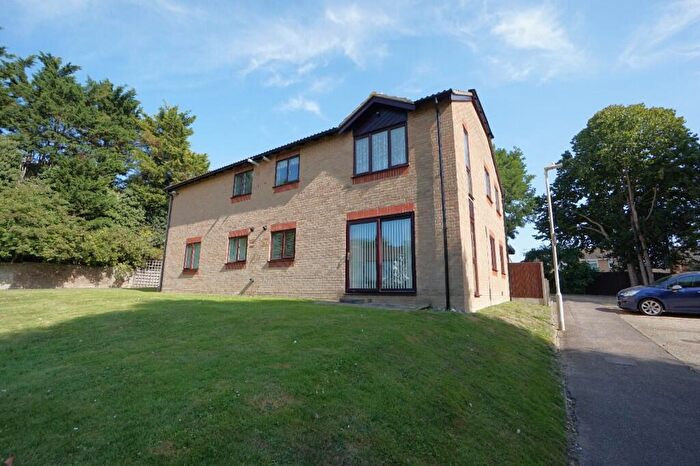
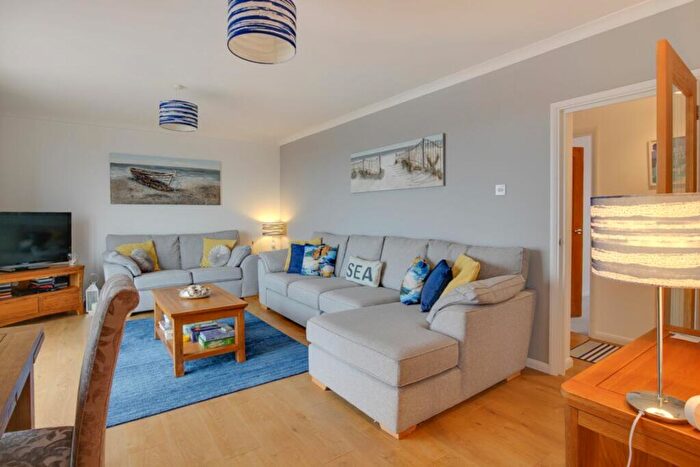
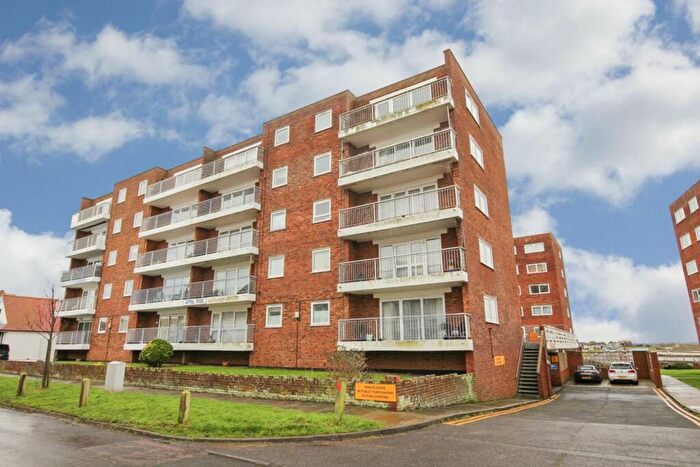
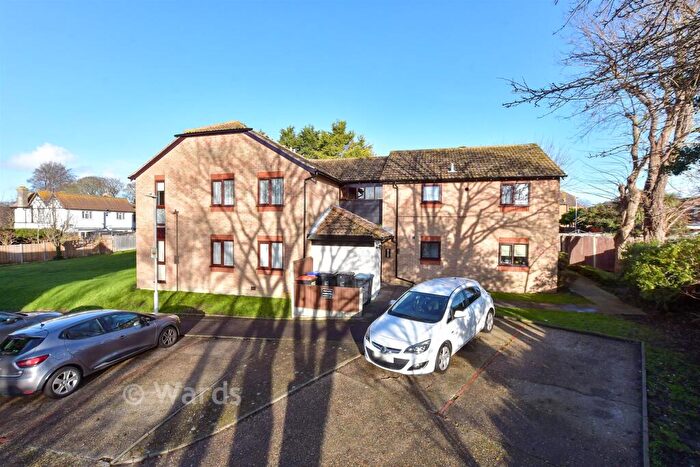
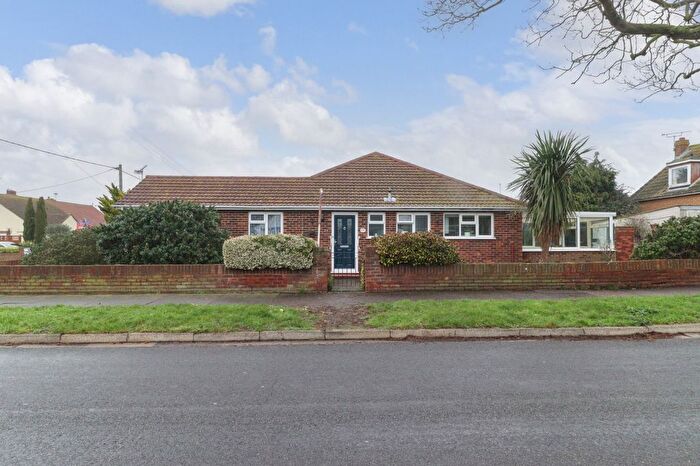
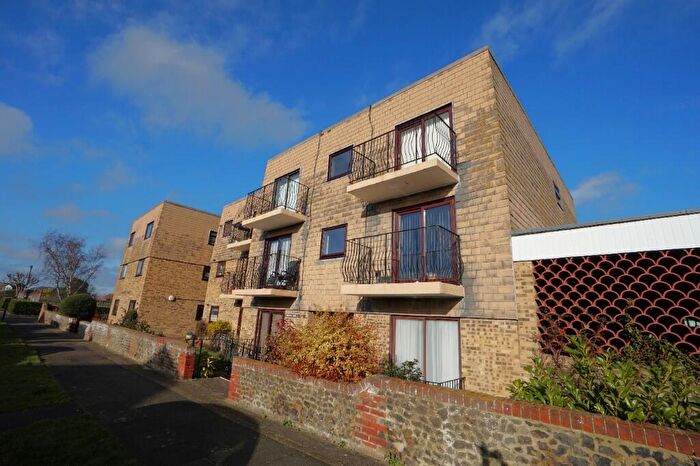
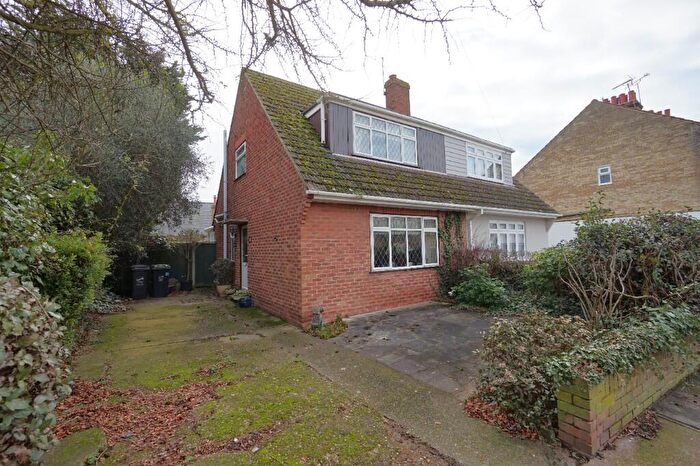
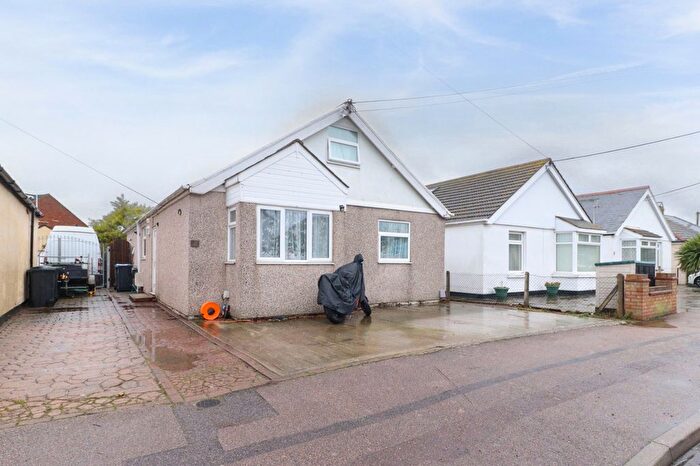
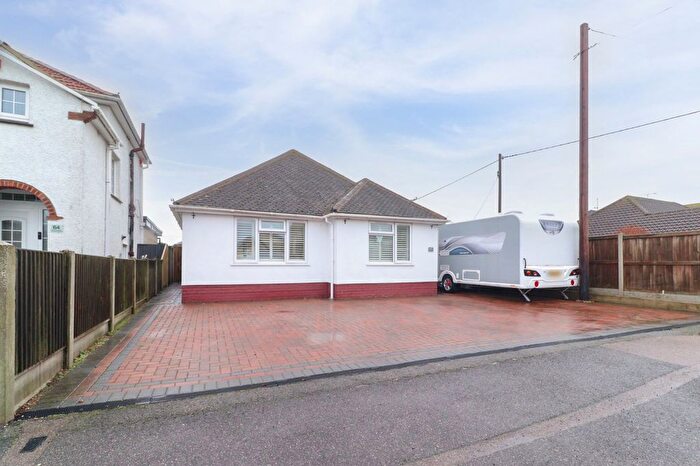
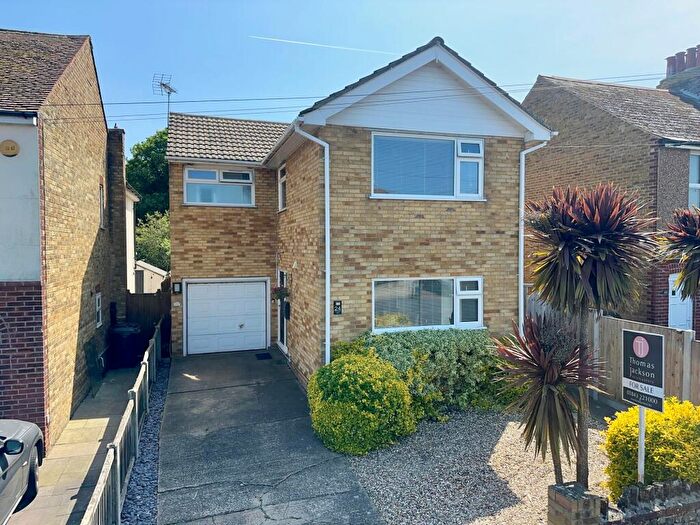
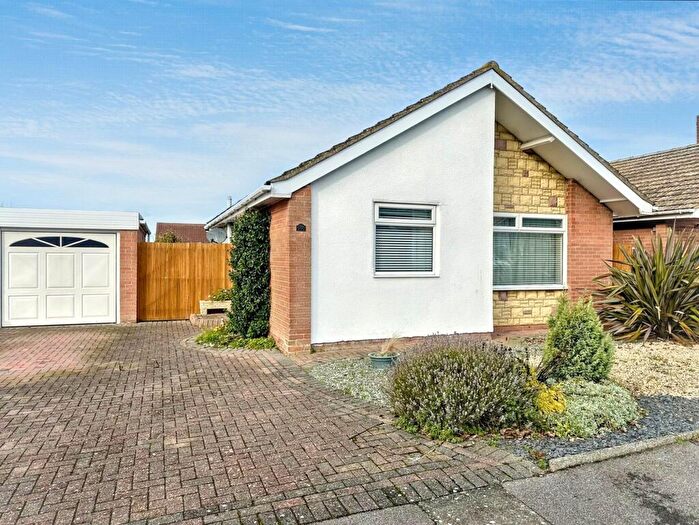
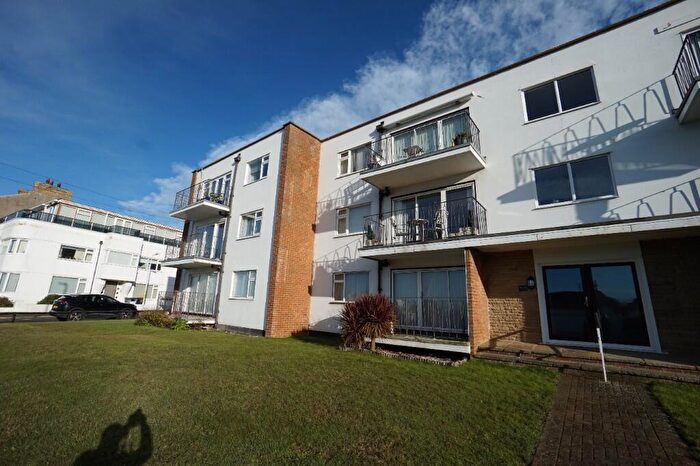
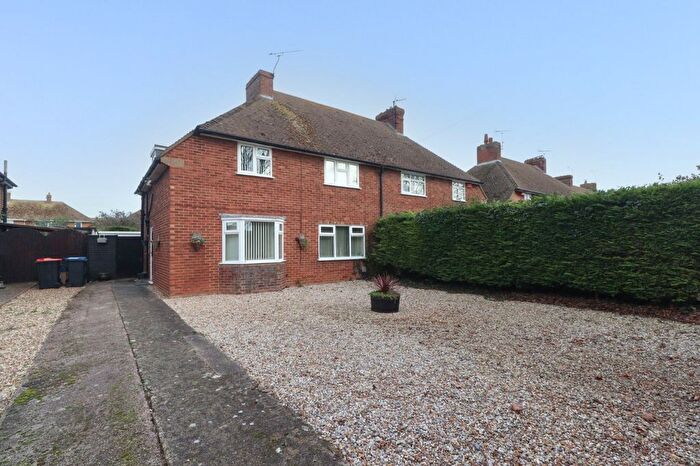
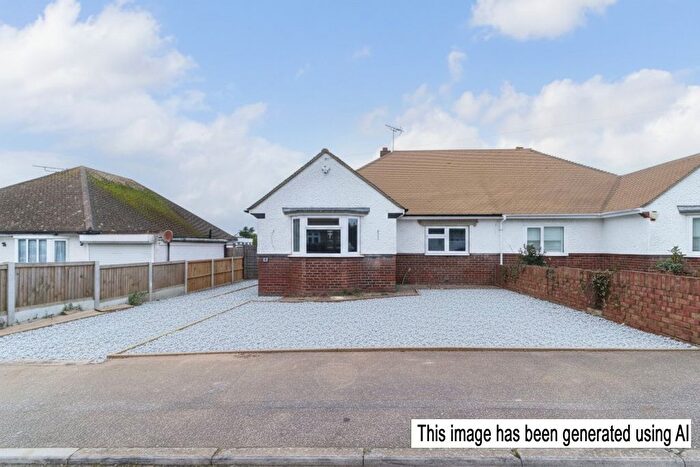
Properties for sale in Birchington North
Roads and Postcodes in Birchington North
Navigate through our locations to find the location of your next house in Birchington North, Birchington for sale or to rent.
| Streets | Postcodes |
|---|---|
| Alfred Road | CT7 9ND CT7 9NJ |
| Alison Close | CT7 9AU |
| Anna Park | CT7 9LP |
| April Rise | CT7 9NL |
| Arthur Road | CT7 9NG CT7 9NQ |
| Bay View Heights | CT7 9QY |
| Beach Avenue | CT7 9JS CT7 9JT |
| Beresford Court | CT7 9JJ |
| Berkeley Road | CT7 9JN CT7 9JR |
| Canute Road | CT7 9QH CT7 9QJ |
| Cliff Road | CT7 9JX CT7 9LS |
| Coastguard Cottages | CT7 9NP |
| Colemans Stairs Road | CT7 9HJ |
| Constable Road | CT7 9HD |
| Conway Close | CT7 9LJ |
| Cross Road | CT7 9HN CT7 9HW |
| Cunningham Crescent | CT7 9LE CT7 9LF |
| Dallinger Road | CT7 9LG |
| Dane Road | CT7 9PR CT7 9PT CT7 9PU CT7 9QT |
| Darwin Road | CT7 9JL |
| Daryngton Avenue | CT7 9PS |
| Duncan Drive | CT7 9LL |
| Egbert Road | CT7 9PF |
| Epple Bay Avenue | CT7 9HR CT7 9HT CT7 9HU |
| Epple Bay Road | CT7 9EN CT7 9EW |
| Epple Road | CT7 9AT CT7 9AX |
| Ethelbert Road | CT7 9PX CT7 9PY CT7 9QA |
| Gainsboro Road | CT7 9EU |
| Gallwey Avenue | CT7 9PA |
| Green Road | CT7 9JY CT7 9JZ |
| Grenham Bay Avenue | CT7 9NN CT7 9NW |
| Grenham Road | CT7 9JG CT7 9JH CT7 9JQ |
| Grenville Gardens | CT7 9LA |
| Harold Road | CT7 9NA |
| Hawkhurst Close | CT7 9UL |
| Hengist Road | CT7 9QP |
| Hereward Avenue | CT7 9LY |
| Herschell Road | CT7 9JU |
| Horsa Road | CT7 9PN |
| Hunting Gate | CT7 9EL CT7 9JA CT7 9JB |
| Ingoldsby Road | CT7 9PJ CT7 9PL |
| Kings Avenue | CT7 9PP CT7 9QL |
| Larkscliff Court | CT7 9NB |
| Leslie Road | CT7 9HG |
| Lyell Road | CT7 9EJ CT7 9JD CT7 9JE |
| Mckinlay Court | CT7 9QG |
| Minnis Road | CT7 9NR CT7 9NS CT7 9NX CT7 9NY CT7 9NZ CT7 9QB CT7 9QD CT7 9QE CT7 9QF |
| Moray Avenue | CT7 9UN |
| Nasmyth Road | CT7 9HH |
| Nelson Court | CT7 9LH |
| Ocean Close | CT7 9HX |
| Old Farm Road | CT7 9PH |
| Plum Pudding Island | CT7 9QS |
| Princes Close | CT7 9PD |
| Queens Avenue | CT7 9QN |
| Reculver Avenue | CT7 9NT CT7 9NU |
| Rossetti Road | CT7 9EP CT7 9ER |
| Sea View Avenue | CT7 9LU |
| Sea View Heights | CT7 9QQ |
| Sea View Road | CT7 9LB |
| Semaphore Road | CT7 9JP |
| Shakespeare Road | CT7 9ES CT7 9ET CT7 9EX |
| Shore Close | CT7 9PZ |
| Smugglers Way | CT7 9HP |
| Spencer Road | CT7 9EY CT7 9EZ CT7 9HB |
| St James Terrace | CT7 9HZ |
| St Magnus Close | CT7 9UP CT7 9UW |
| St Mildreds Avenue | CT7 9LD |
| The Parade | CT7 9LT CT7 9LX CT7 9QR |
| The Retreat | CT7 9HS |
| Viking Close | CT7 9NH |
| Wigwam Paddocks | CT7 9HL |
| Wilkie Road | CT7 9HE |
| Winston Court | CT7 9HA |
| CT7 9FB |
Transport near Birchington North
- FAQ
- Price Paid By Year
- Property Type Price
Frequently asked questions about Birchington North
What is the average price for a property for sale in Birchington North?
The average price for a property for sale in Birchington North is £389,073. This amount is 15% higher than the average price in Birchington. There are 1,080 property listings for sale in Birchington North.
What streets have the most expensive properties for sale in Birchington North?
The streets with the most expensive properties for sale in Birchington North are Queens Avenue at an average of £840,000, Kings Avenue at an average of £701,000 and Harold Road at an average of £674,999.
What streets have the most affordable properties for sale in Birchington North?
The streets with the most affordable properties for sale in Birchington North are Shore Close at an average of £181,500, Hunting Gate at an average of £206,055 and Minnis Road at an average of £221,785.
Which train stations are available in or near Birchington North?
Some of the train stations available in or near Birchington North are Birchington-On-Sea, Westgate-On-Sea and Margate.
Property Price Paid in Birchington North by Year
The average sold property price by year was:
| Year | Average Sold Price | Price Change |
Sold Properties
|
|---|---|---|---|
| 2025 | £415,177 | 13% |
62 Properties |
| 2024 | £360,931 | -9% |
66 Properties |
| 2023 | £392,392 | -8% |
72 Properties |
| 2022 | £422,054 | 4% |
92 Properties |
| 2021 | £404,649 | 16% |
114 Properties |
| 2020 | £341,864 | 4% |
87 Properties |
| 2019 | £329,551 | -4% |
103 Properties |
| 2018 | £341,816 | 19% |
94 Properties |
| 2017 | £278,383 | -9% |
111 Properties |
| 2016 | £302,151 | 12% |
122 Properties |
| 2015 | £266,664 | 5% |
112 Properties |
| 2014 | £252,639 | 12% |
108 Properties |
| 2013 | £223,210 | -3% |
104 Properties |
| 2012 | £229,404 | 3% |
91 Properties |
| 2011 | £222,519 | 7% |
104 Properties |
| 2010 | £205,856 | 2% |
74 Properties |
| 2009 | £201,178 | -14% |
96 Properties |
| 2008 | £228,731 | 4% |
90 Properties |
| 2007 | £218,784 | 3% |
147 Properties |
| 2006 | £211,770 | -7% |
130 Properties |
| 2005 | £227,507 | 15% |
88 Properties |
| 2004 | £193,571 | 14% |
114 Properties |
| 2003 | £166,645 | 14% |
138 Properties |
| 2002 | £143,076 | 15% |
141 Properties |
| 2001 | £121,643 | 11% |
117 Properties |
| 2000 | £108,264 | 21% |
79 Properties |
| 1999 | £85,345 | 6% |
145 Properties |
| 1998 | £80,308 | 6% |
104 Properties |
| 1997 | £75,562 | 13% |
131 Properties |
| 1996 | £66,076 | -7% |
101 Properties |
| 1995 | £70,923 | - |
80 Properties |
Property Price per Property Type in Birchington North
Here you can find historic sold price data in order to help with your property search.
The average Property Paid Price for specific property types in the last three years are:
| Property Type | Average Sold Price | Sold Properties |
|---|---|---|
| Semi Detached House | £391,428.00 | 35 Semi Detached Houses |
| Detached House | £538,916.00 | 89 Detached Houses |
| Terraced House | £325,192.00 | 13 Terraced Houses |
| Flat | £189,265.00 | 63 Flats |

