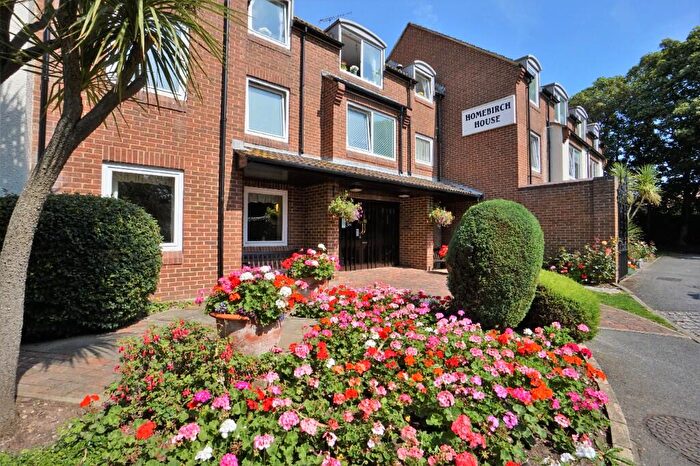
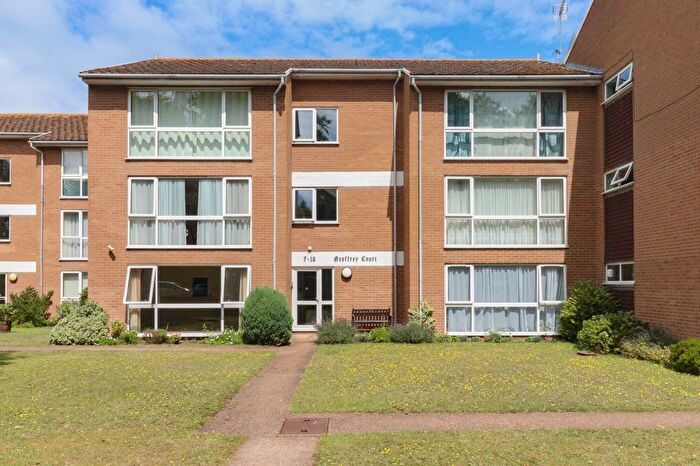
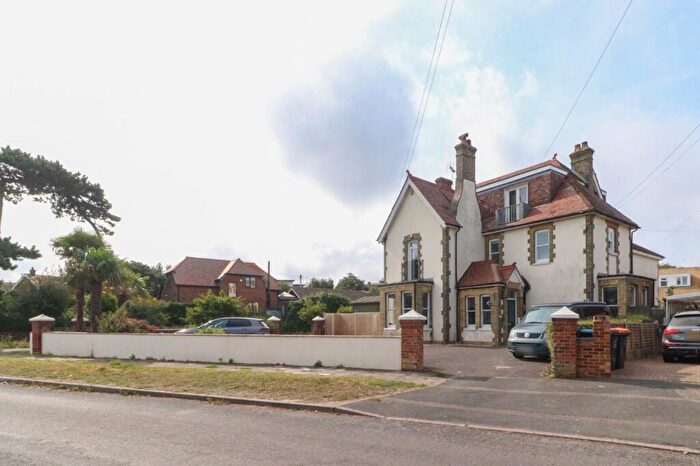
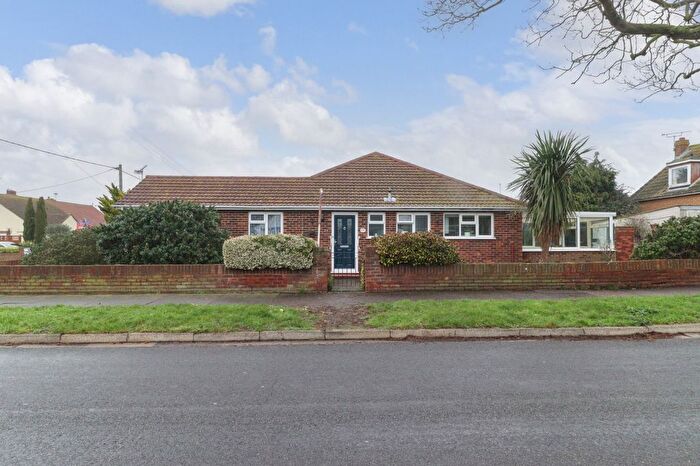
Houses for sale & to rent in Birchington South, Birchington
House Prices in Birchington South
Properties in Birchington South have an average house price of £302,456.00 and had 297 Property Transactions within the last 3 years¹.
Birchington South is an area in Birchington, Kent with 3,075 households², where the most expensive property was sold for £901,000.00.
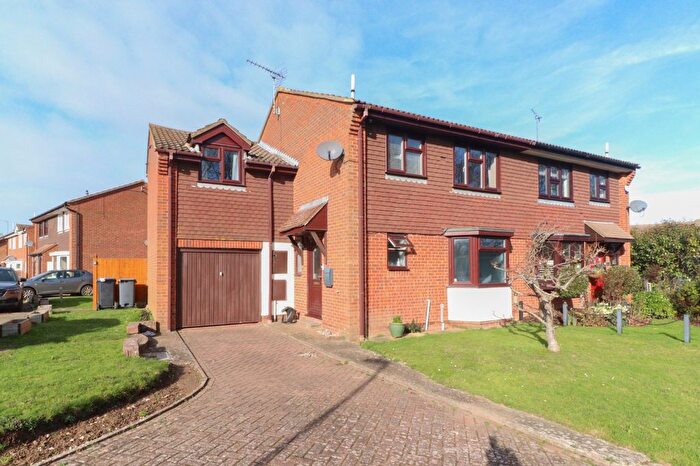
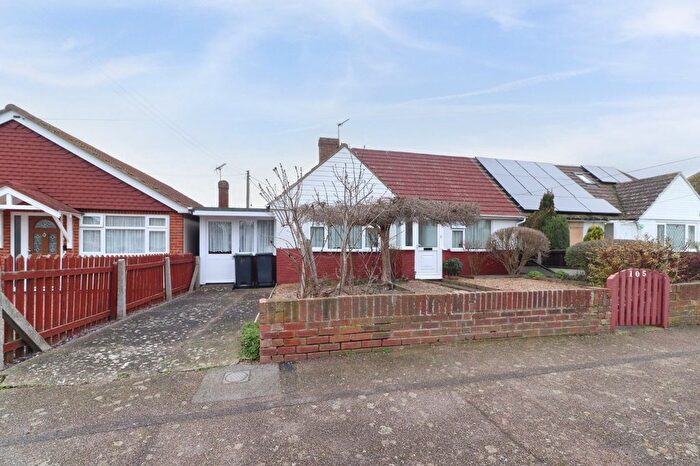
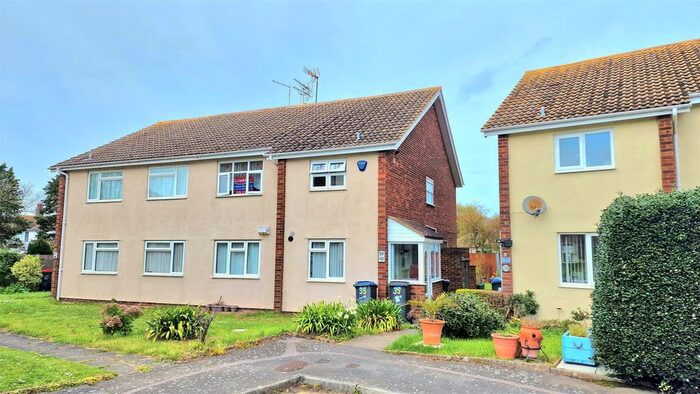
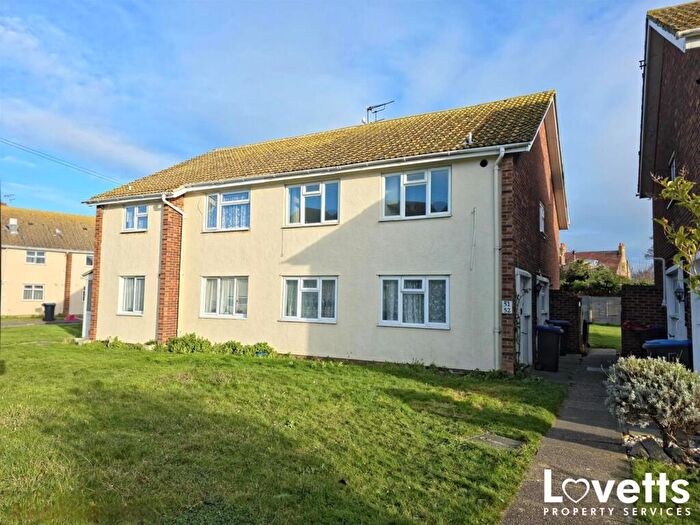
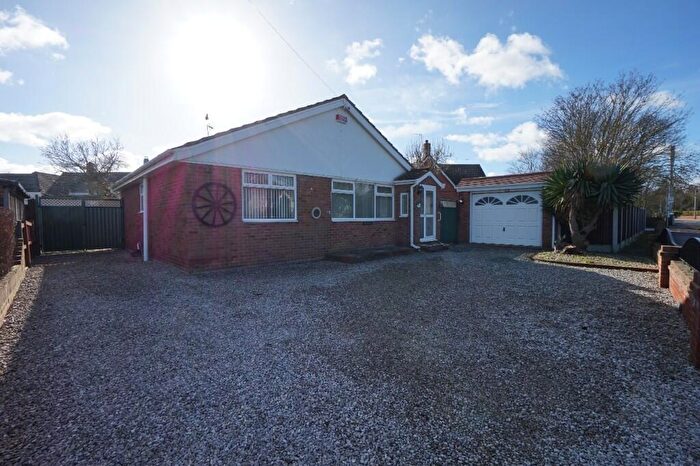
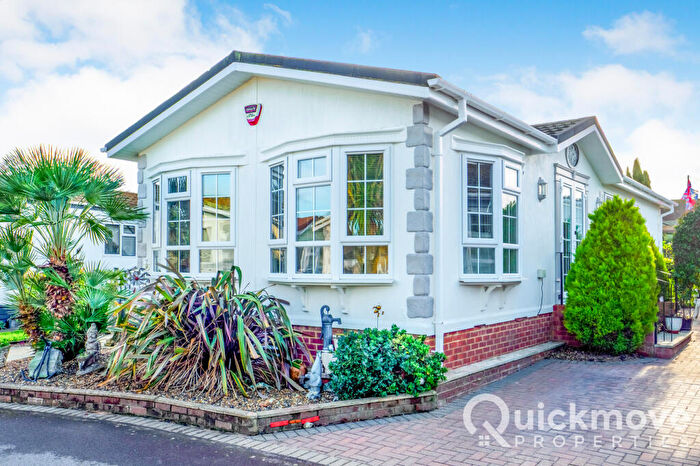
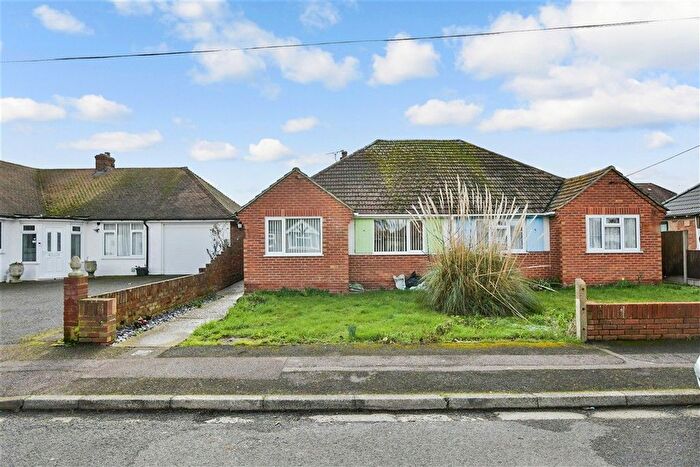
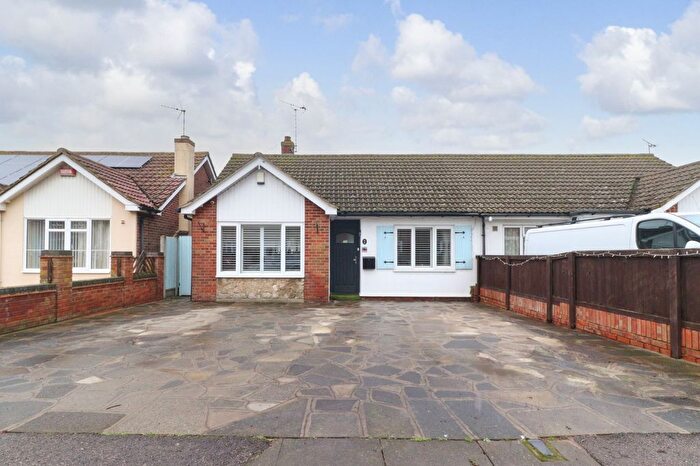
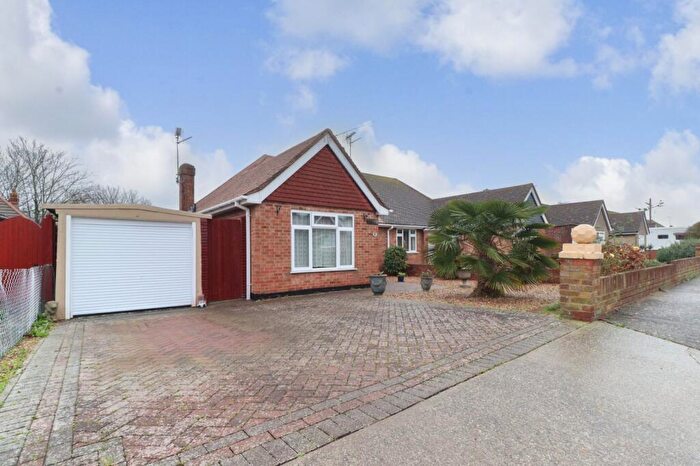
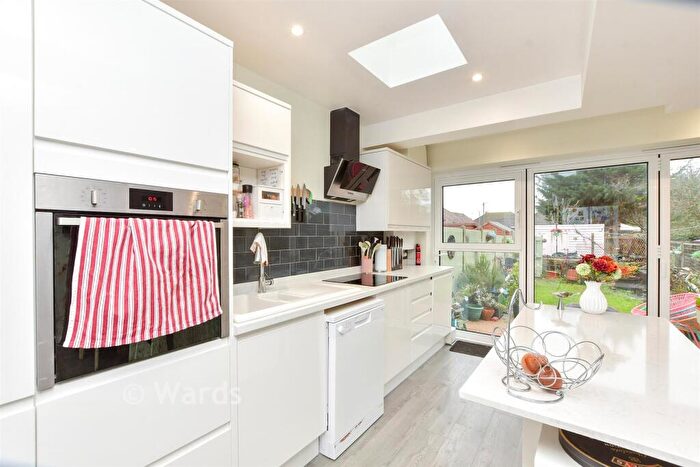
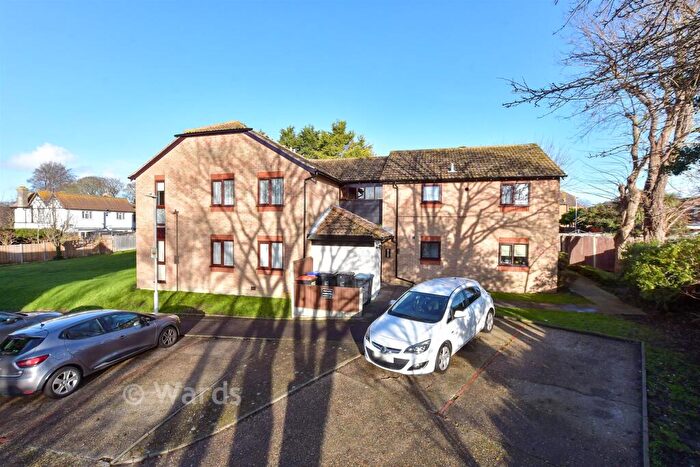
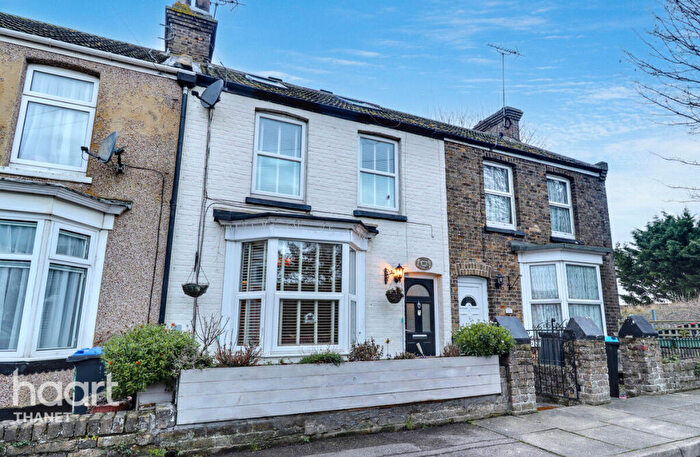
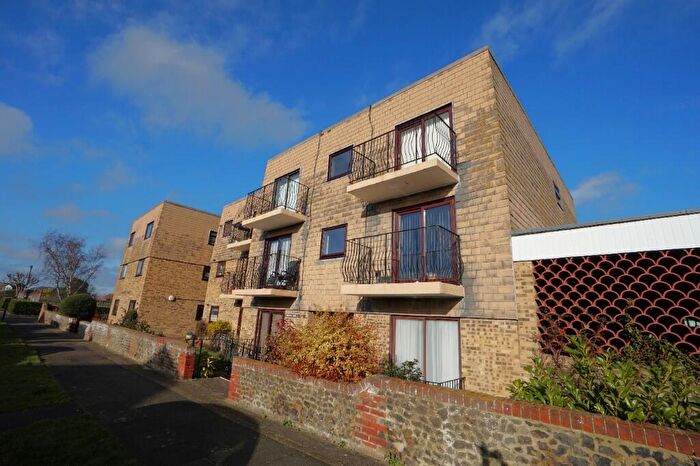
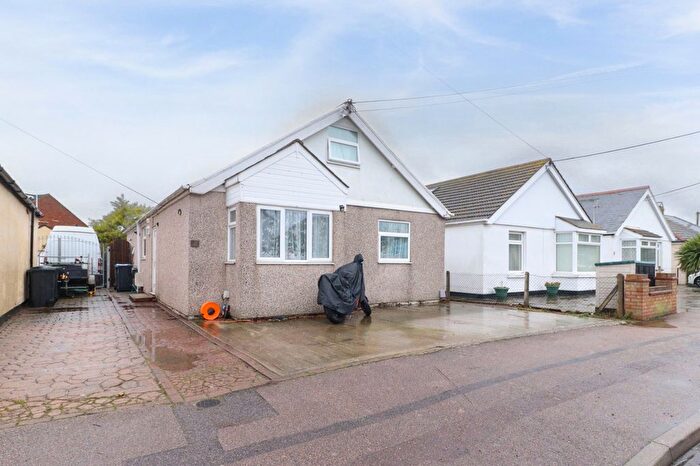
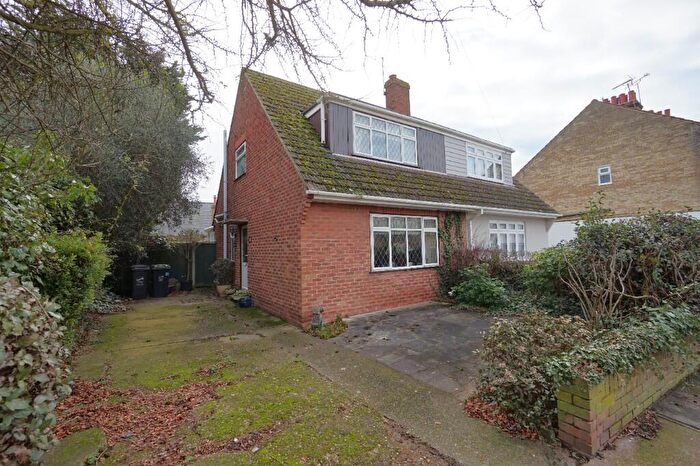
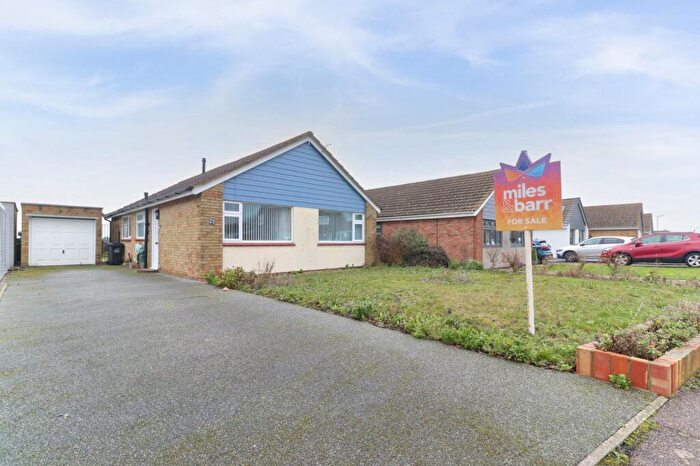
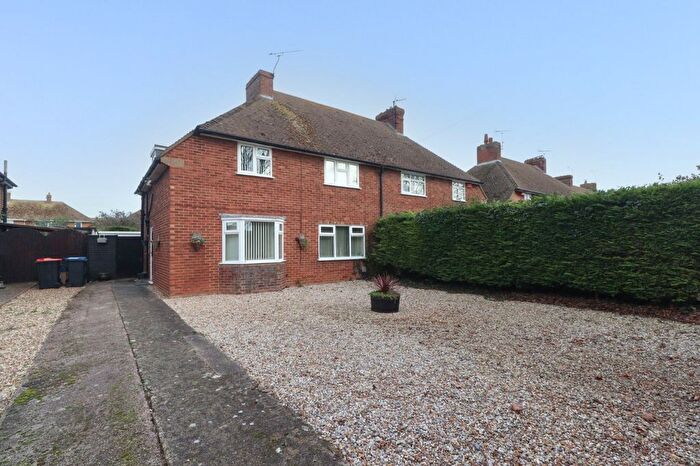
Properties for sale in Birchington South
Roads and Postcodes in Birchington South
Navigate through our locations to find the location of your next house in Birchington South, Birchington for sale or to rent.
| Streets | Postcodes |
|---|---|
| Albion Road | CT7 9DH CT7 9DN CT7 9DS |
| Alexandra Road | CT7 0DX |
| Alma Cottages | CT7 9DG |
| Alpha Road | CT7 9EA CT7 9ED CT7 9EG CT7 9EH CT7 9EQ CT7 9RL |
| Anne Close | CT7 9BZ |
| Anvil Close | CT7 0AP |
| Ash Tree Close | CT7 9DW |
| Barrington Crescent | CT7 9DF |
| Barrows Close | CT7 0BY CT7 0DB |
| Beverley Close | CT7 9BA |
| Birch Hill Court | CT7 9UQ |
| Brandon Way | CT7 9XE |
| Broadley Avenue | CT7 9UA |
| Brooksend Cottages | CT7 0JN |
| Brunswick Road | CT7 0EA CT7 0EB CT7 0ED CT7 0EE |
| Burr Cottages | CT7 9TX |
| Cambridge Close | CT7 9XQ |
| Canterbury Road | CT7 9AH CT7 9AN CT7 9AQ CT7 9AS CT7 9BB CT7 9BS CT7 9BU CT7 9DB CT7 9TB CT7 9TD CT7 9TY CT7 9TZ CT7 9UB CT7 9UD CT7 9BL CT7 9BP |
| Cedar Close | CT7 9DX |
| Charlesworth Drive | CT7 9DD |
| Claremont Mews | CT7 9EF |
| Cornford Road | CT7 0AG |
| Court Mount | CT7 0BS CT7 0BT CT7 0BU |
| Crescent Road | CT7 9DP |
| Crispe Park Close | CT7 9BN |
| Devon Gardens | CT7 9SR CT7 9SS |
| Dorset Gardens | CT7 9TG |
| Dovedale | CT7 9UF |
| Dovedale Court | CT7 9UG |
| Eastfield Road | CT7 9RH |
| Edenfield | CT7 9DE |
| Edward Drive | CT7 9BY |
| Epple Road | CT7 9AP CT7 9AY |
| Essex Gardens | CT7 9TJ CT7 9TL CT7 9TW |
| Farrar Road | CT7 0AQ CT7 0EX |
| Gordon Square | CT7 9SL |
| Gore End Close | CT7 9SH |
| Hereford Gardens | CT7 9TE |
| Holton Close | CT7 0AZ |
| Hoser Gardens | CT7 9DZ |
| Ingle Close | CT7 9EB |
| Kent Gardens | CT7 9RS CT7 9RX CT7 9RY CT7 9RZ |
| King Edward Road | CT7 0EG CT7 0EL CT7 0EQ |
| Kings Road | CT7 0DT CT7 0DU |
| Laming Road | CT7 0AJ |
| Lancaster Gardens | CT7 9TH |
| Lincoln Gardens | CT7 9SW |
| Linington Road | CT7 0AL |
| Manor Drive | CT7 9TN |
| Manston Road | CT7 0HR |
| Marilyn Crescent | CT7 9BX |
| Mellanby Close | CT7 0BZ |
| Melsetter Close | CT7 9AR |
| Miles Way | CT7 9ST |
| Mill Lane | CT7 9TU |
| Mill Row | CT7 9TR CT7 9TS CT7 9TT |
| Minnis Park | CT7 9SF |
| Minnis Road | CT7 9HY CT7 9SD CT7 9SE CT7 9BW CT7 9HQ CT7 9SJ |
| Neame Road | CT7 9DU |
| Newbury Close | CT7 9XF |
| Norrie Road | CT7 0DA |
| Nottingham Road | CT7 0EH |
| Oxney Close | CT7 9RR |
| Paddock Road | CT7 9RJ |
| Park Avenue | CT7 0DJ CT7 0DL |
| Park Lane | CT7 0AN CT7 0AS CT7 0AT CT7 0AU CT7 0AW CT7 0AY |
| Park Road | CT7 0AD CT7 0AE CT7 0AF CT7 0BL |
| Phillips Road | CT7 0BX |
| Pine Tree Close | CT7 9DT |
| Plum Tree Grove | CT7 9PG |
| Powell Cotton Drive | CT7 0EY CT7 0BW |
| Priory Mews | CT7 9EE |
| Prospect Road | CT7 9RP |
| Queen Berthas Avenue | CT7 9BH CT7 9BJ |
| Quex Park | CT7 0BB CT7 0BE CT7 0BG CT7 0BH CT7 0ET |
| Quex View Road | CT7 0DY CT7 0DZ |
| Ransome Way | CT7 0DQ |
| Romney Close | CT7 9RU |
| Rose Gardens | CT7 0DH |
| Rosewood Way | CT7 9QZ |
| Rutland Gardens | CT7 9SN |
| Sandles Road | CT7 9SU |
| Sewell Close | CT7 0BP |
| Shamrock Villas | CT7 9TP |
| Sheppey Close | CT7 9RT |
| Sherwood Road | CT7 0EJ |
| Shottendane Road | CT7 0BF |
| Silver Avenue | CT7 0BD |
| St Davids Close | CT7 9BG |
| St James Terrace | CT7 9BE |
| Station Approach | CT7 9RD CT7 9RF |
| Station Mews | CT7 9FA |
| Station Road | CT7 9DJ CT7 9DQ CT7 9RA CT7 9RE CT7 9RB |
| Stone Barn Avenue | CT7 0AH CT7 0AR |
| Stringer Drive | CT7 0BN |
| Surrey Gardens | CT7 9SA |
| Sussex Gardens | CT7 9SP |
| Sutherland Drive | CT7 9UE CT7 9XD |
| The Parkway | CT7 9XG |
| The Square | CT7 9AB CT7 9AE CT7 9AF CT7 9AW |
| Tudor Close | CT7 9BD |
| Upper Maltings Place | CT7 9PW |
| Walnut Mews | CT7 9SY |
| Walnut Tree Close | CT7 9DA |
| Westfield Road | CT7 9RN CT7 9RW |
| Wilbrough Road | CT7 9DY |
| Woodford Court | CT7 9DR |
| Woodland Avenue | CT7 0DN CT7 0DW |
| Yew Tree Gardens | CT7 9AJ CT7 9AL |
| York Terrace | CT7 9AZ |
Transport near Birchington South
- FAQ
- Price Paid By Year
- Property Type Price
Frequently asked questions about Birchington South
What is the average price for a property for sale in Birchington South?
The average price for a property for sale in Birchington South is £302,456. This amount is 11% lower than the average price in Birchington. There are 1,168 property listings for sale in Birchington South.
What streets have the most expensive properties for sale in Birchington South?
The streets with the most expensive properties for sale in Birchington South are Crispe Park Close at an average of £540,000, Rosewood Way at an average of £490,000 and Alpha Road at an average of £454,458.
What streets have the most affordable properties for sale in Birchington South?
The streets with the most affordable properties for sale in Birchington South are Minnis Road at an average of £155,256, Station Road at an average of £177,500 and Holton Close at an average of £178,000.
Which train stations are available in or near Birchington South?
Some of the train stations available in or near Birchington South are Birchington-On-Sea, Westgate-On-Sea and Margate.
Property Price Paid in Birchington South by Year
The average sold property price by year was:
| Year | Average Sold Price | Price Change |
Sold Properties
|
|---|---|---|---|
| 2025 | £317,344 | 8% |
93 Properties |
| 2024 | £292,201 | -2% |
105 Properties |
| 2023 | £299,348 | -9% |
99 Properties |
| 2022 | £325,896 | 10% |
131 Properties |
| 2021 | £293,871 | 10% |
160 Properties |
| 2020 | £265,182 | 0,4% |
128 Properties |
| 2019 | £264,091 | -3% |
134 Properties |
| 2018 | £272,774 | 11% |
129 Properties |
| 2017 | £243,808 | 11% |
157 Properties |
| 2016 | £218,117 | 11% |
155 Properties |
| 2015 | £195,190 | 4% |
163 Properties |
| 2014 | £187,342 | 14% |
177 Properties |
| 2013 | £162,010 | -0,2% |
140 Properties |
| 2012 | £162,317 | -3% |
122 Properties |
| 2011 | £166,922 | 1% |
128 Properties |
| 2010 | £164,929 | 6% |
107 Properties |
| 2009 | £154,646 | -7% |
115 Properties |
| 2008 | £166,021 | -8% |
101 Properties |
| 2007 | £178,689 | 3% |
199 Properties |
| 2006 | £173,033 | 3% |
200 Properties |
| 2005 | £167,322 | 8% |
155 Properties |
| 2004 | £153,376 | 5% |
202 Properties |
| 2003 | £145,721 | 25% |
177 Properties |
| 2002 | £108,930 | 20% |
202 Properties |
| 2001 | £87,492 | 2% |
185 Properties |
| 2000 | £86,063 | 27% |
167 Properties |
| 1999 | £62,548 | 8% |
201 Properties |
| 1998 | £57,703 | 7% |
151 Properties |
| 1997 | £53,490 | 6% |
197 Properties |
| 1996 | £50,372 | -0,3% |
166 Properties |
| 1995 | £50,539 | - |
110 Properties |
Property Price per Property Type in Birchington South
Here you can find historic sold price data in order to help with your property search.
The average Property Paid Price for specific property types in the last three years are:
| Property Type | Average Sold Price | Sold Properties |
|---|---|---|
| Flat | £170,686.00 | 54 Flats |
| Semi Detached House | £319,691.00 | 113 Semi Detached Houses |
| Detached House | £373,718.00 | 87 Detached Houses |
| Terraced House | £278,465.00 | 43 Terraced Houses |

