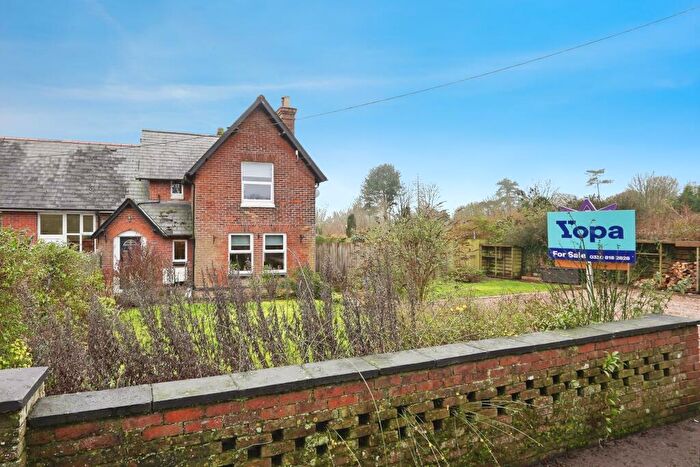
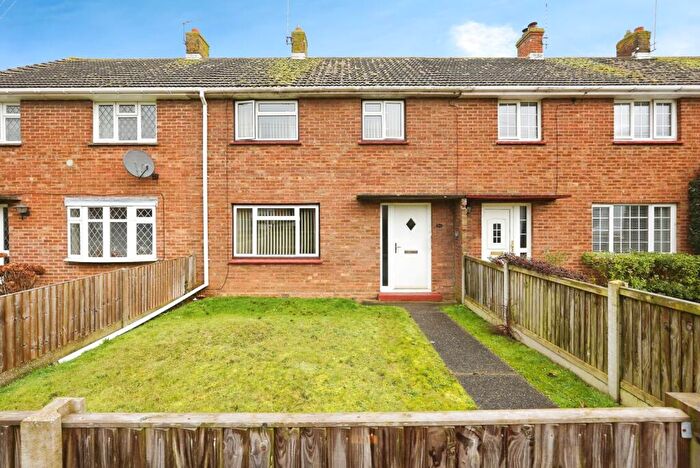
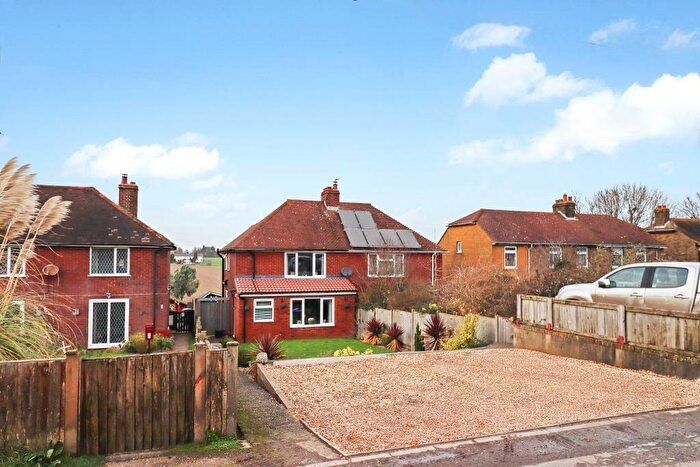
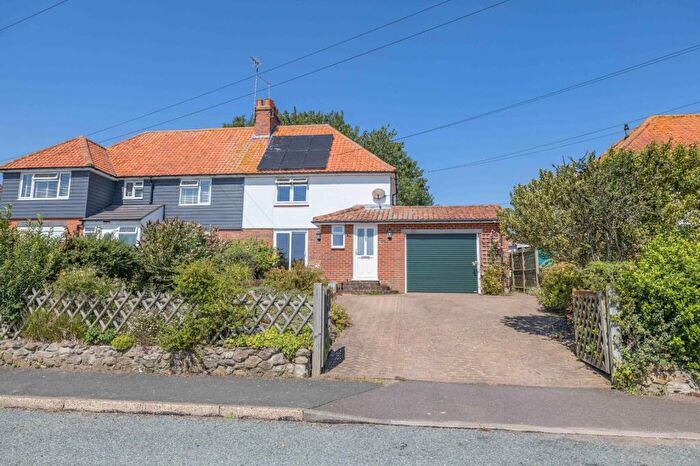
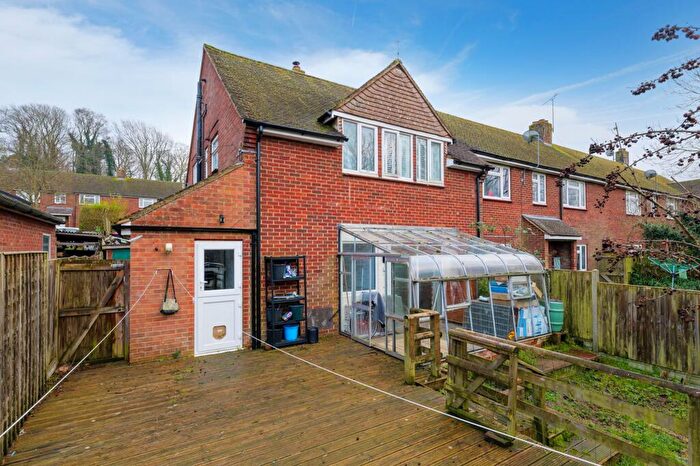
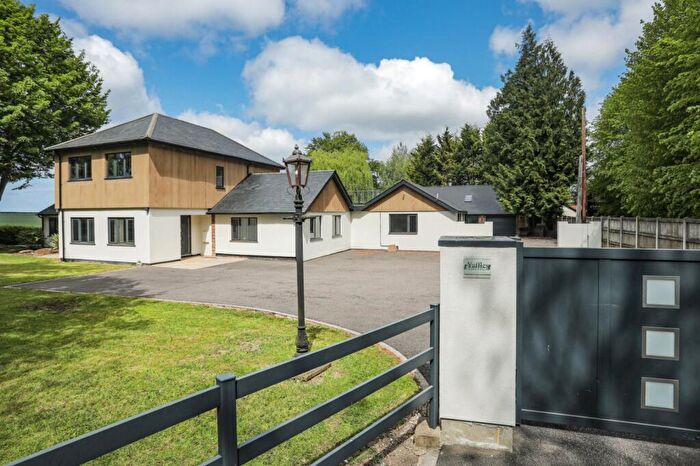
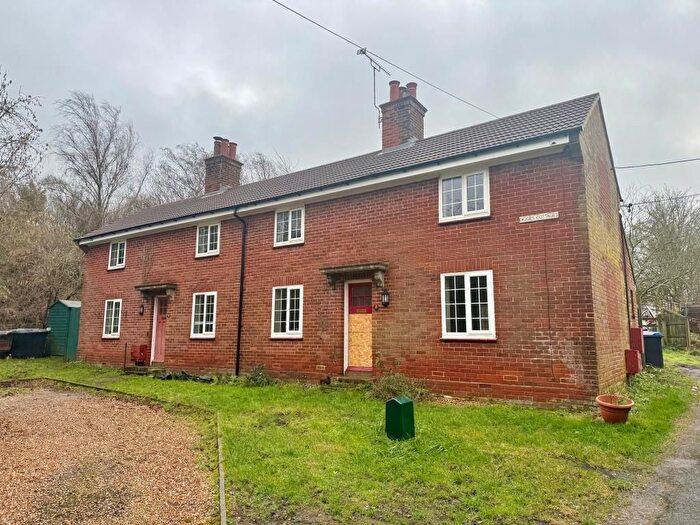
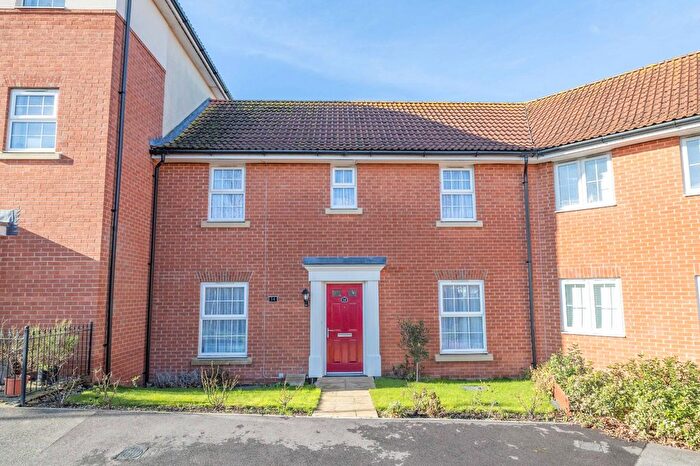
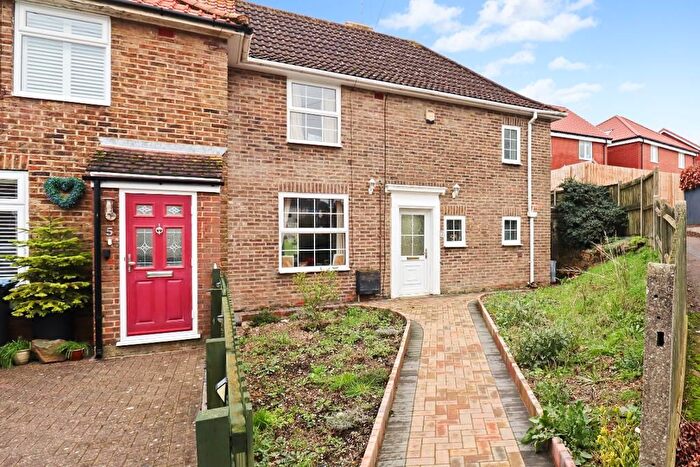
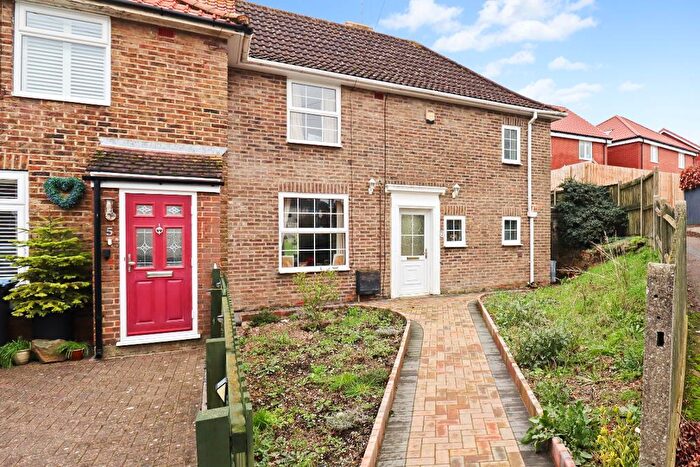
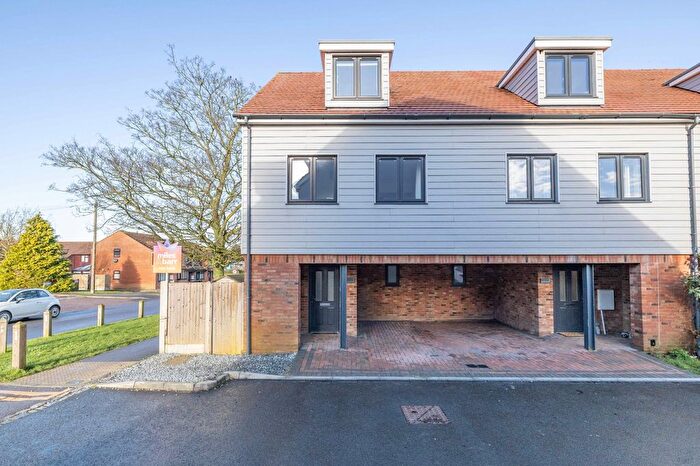
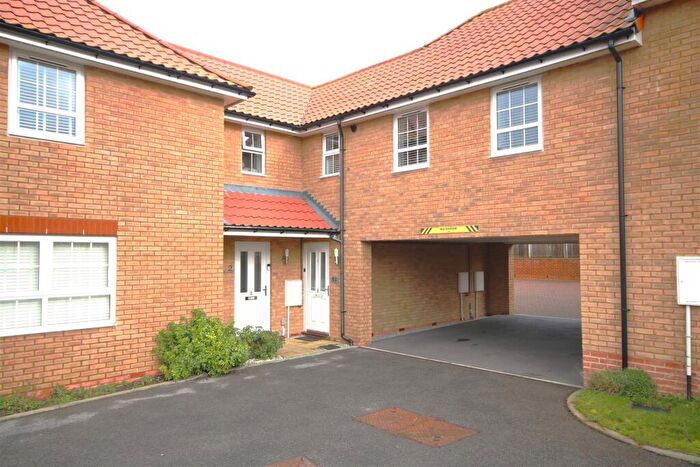
Houses for sale & to rent in Barham Downs, Canterbury
House Prices in Barham Downs
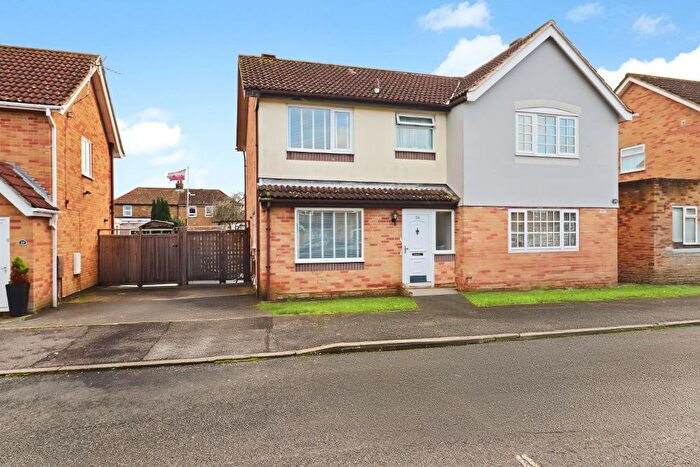
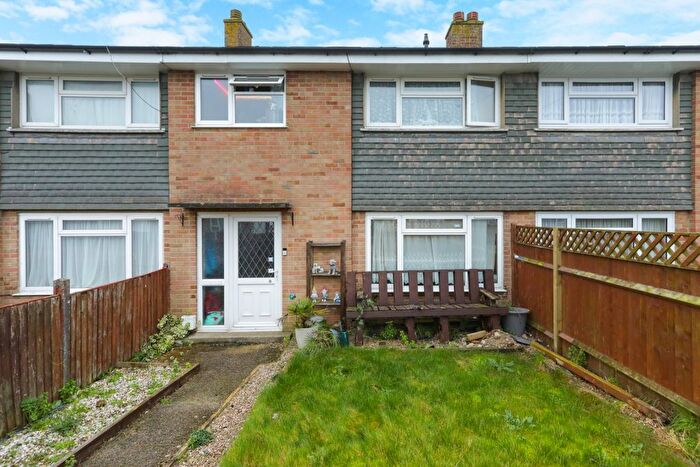
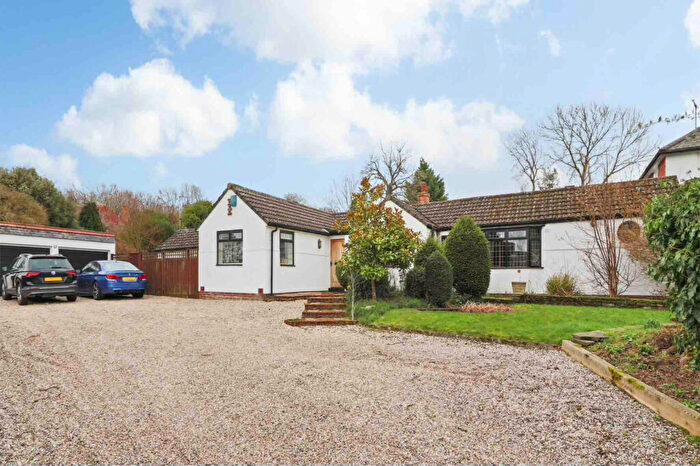
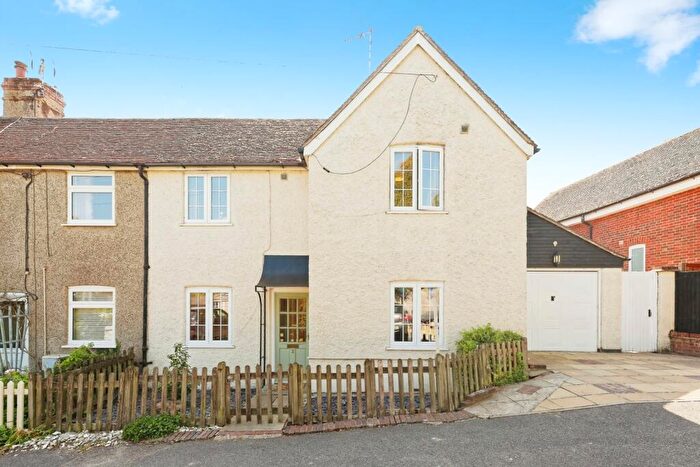
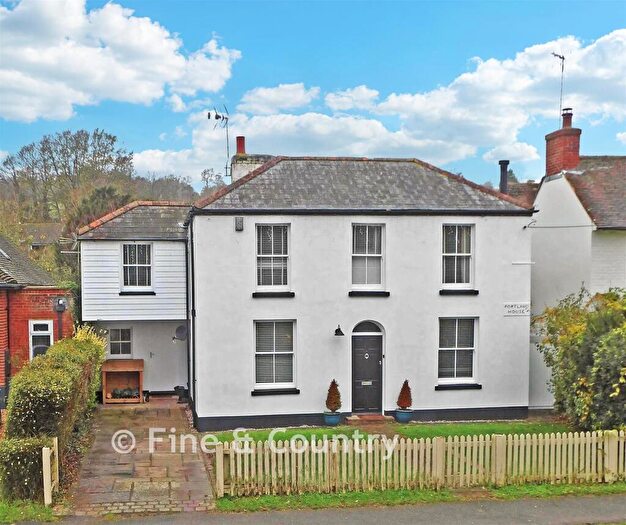
Properties in Barham Downs have an average house price of £467,844.00 and had 74 Property Transactions within the last 3 years¹.
Barham Downs is an area in Canterbury, Kent with 1,050 households², where the most expensive property was sold for £1,870,000.00.
Properties for sale in Barham Downs
Roads and Postcodes in Barham Downs
Navigate through our locations to find the location of your next house in Barham Downs, Canterbury for sale or to rent.
| Streets | Postcodes |
|---|---|
| Adisham Downs Road | CT3 3LJ |
| Birch Court | CT4 6QW |
| Black Robin Lane | CT4 6HR |
| Blooden | CT3 3JG |
| Bonny Bush Hill | CT4 6HT |
| Bossington | CT3 3LN |
| Bossington Road | CT3 3LL |
| Breach Down Cottages | CT4 6LL |
| Brickfield Road | CT4 6LQ |
| Canterbury Road | CT4 6QU CT4 6QX |
| Church Lane | CT3 3JH CT4 6HG CT4 6HX CT4 6PB CT4 6QS CT4 6QT |
| Covet Lane | CT4 6HU CT4 6JS CT4 6JT |
| Crookenden Place | CT4 6QL |
| Dennehill | CT4 6HD |
| Derringstone Hill | CT4 6QD |
| Derringstone Street | CT4 6QB |
| Dover Road | CT4 6EX CT4 6HJ CT4 6HN CT4 6SA |
| Elham Valley Road | CT4 6LN |
| Farm House Close | CT4 6QQ |
| Firs Road | CT4 6SH |
| Forstal Road | CT4 6SP |
| Fox Way | CT4 6QJ |
| Gravel Castle Hill | CT4 6SR |
| Gravel Castle Road | CT4 6LG |
| Green Hills | CT4 6JY |
| Greenacre | CT4 6JF |
| Heathfield Way | CT4 6QH |
| Ileden Lane | CT4 6HP |
| Kitchener Close | CT4 6QN |
| Marley Lane | CT4 6JH CT4 6JJ |
| Mill Lane | CT4 6QE |
| Mill View Court | CT4 6PF |
| Nailbourne Close | CT4 6JA |
| Nethersole Road | CT4 6SJ |
| Old Valley Road | CT4 6QG |
| Out Elmstead Lane | CT4 6HL CT4 6PG CT4 6PH CT4 6PJ |
| Oxenden Way | CT4 6PR |
| Palmstead | CT4 6EF |
| Railway Hill | CT4 6LA CT4 6PX CT4 6PY CT4 6PZ |
| Railway Terrace | CT4 6PU |
| Rectory Lane | CT4 6PD CT4 6PE |
| South Barham Road | CT4 6LJ CT4 6QA |
| Station Road | CT3 3JF |
| The Causeway | CT4 6PT |
| The Grove | CT4 6PP |
| The Place | CT4 6SL |
| The Shrubbery | CT4 6NU |
| The Street | CT3 3JJ CT3 3JL CT3 3JN CT3 3JP CT3 3JR CT3 3JS CT3 3JT CT3 3JU CT3 3JW CT3 3JX CT3 3JZ CT3 3LA CT3 3LB CT3 3LD CT3 3LE CT4 6HE CT4 6HZ CT4 6JB CT4 6JE CT4 6JQ CT4 6NY CT4 6NZ CT4 6PA |
| Valley Road | CT4 6NX CT4 6PL CT4 6PN CT4 6PS |
| Waterworks Cottages | CT4 6JX |
| Westwood Road | CT4 6JN |
| Whitelocks Close | CT4 6JG |
| Wick Lane | CT4 6SD |
| Woodlands Road | CT3 3LG |
| Woolage Green | CT4 6SE CT4 6SF CT4 6SG |
| CT4 6HB CT4 6JP |
Transport near Barham Downs
- FAQ
- Price Paid By Year
- Property Type Price
Frequently asked questions about Barham Downs
What is the average price for a property for sale in Barham Downs?
The average price for a property for sale in Barham Downs is £467,844. This amount is 25% higher than the average price in Canterbury. There are 1,715 property listings for sale in Barham Downs.
What streets have the most expensive properties for sale in Barham Downs?
The streets with the most expensive properties for sale in Barham Downs are Bossington at an average of £1,870,000, Marley Lane at an average of £1,010,000 and Woodlands Road at an average of £985,000.
What streets have the most affordable properties for sale in Barham Downs?
The streets with the most affordable properties for sale in Barham Downs are Firs Road at an average of £238,000, Farm House Close at an average of £292,833 and Forstal Road at an average of £324,750.
Which train stations are available in or near Barham Downs?
Some of the train stations available in or near Barham Downs are Snowdown, Aylesham and Adisham.
Property Price Paid in Barham Downs by Year
The average sold property price by year was:
| Year | Average Sold Price | Price Change |
Sold Properties
|
|---|---|---|---|
| 2025 | £454,571 | -0,2% |
21 Properties |
| 2024 | £455,291 | -9% |
30 Properties |
| 2023 | £496,336 | -8% |
23 Properties |
| 2022 | £534,692 | 17% |
39 Properties |
| 2021 | £443,016 | 6% |
57 Properties |
| 2020 | £418,218 | -2% |
32 Properties |
| 2019 | £424,703 | 6% |
33 Properties |
| 2018 | £401,302 | 11% |
32 Properties |
| 2017 | £355,842 | -18% |
35 Properties |
| 2016 | £420,889 | 17% |
35 Properties |
| 2015 | £348,214 | 23% |
42 Properties |
| 2014 | £268,958 | -15% |
55 Properties |
| 2013 | £308,387 | -9% |
31 Properties |
| 2012 | £336,179 | 26% |
29 Properties |
| 2011 | £249,314 | -36% |
27 Properties |
| 2010 | £338,823 | 21% |
17 Properties |
| 2009 | £266,273 | -58% |
26 Properties |
| 2008 | £420,112 | 21% |
31 Properties |
| 2007 | £331,462 | 19% |
46 Properties |
| 2006 | £268,159 | -14% |
47 Properties |
| 2005 | £305,465 | 18% |
43 Properties |
| 2004 | £250,733 | -3% |
49 Properties |
| 2003 | £259,430 | 19% |
53 Properties |
| 2002 | £211,411 | 5% |
70 Properties |
| 2001 | £201,647 | 20% |
30 Properties |
| 2000 | £162,296 | 25% |
34 Properties |
| 1999 | £121,098 | 12% |
30 Properties |
| 1998 | £107,163 | 6% |
42 Properties |
| 1997 | £101,094 | 22% |
52 Properties |
| 1996 | £79,306 | -9% |
44 Properties |
| 1995 | £86,242 | - |
35 Properties |
Property Price per Property Type in Barham Downs
Here you can find historic sold price data in order to help with your property search.
The average Property Paid Price for specific property types in the last three years are:
| Property Type | Average Sold Price | Sold Properties |
|---|---|---|
| Semi Detached House | £382,310.00 | 33 Semi Detached Houses |
| Detached House | £616,322.00 | 31 Detached Houses |
| Terraced House | £289,825.00 | 10 Terraced Houses |

