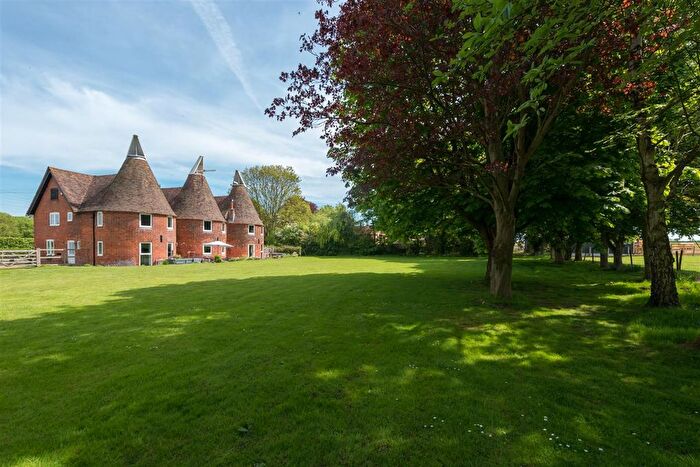
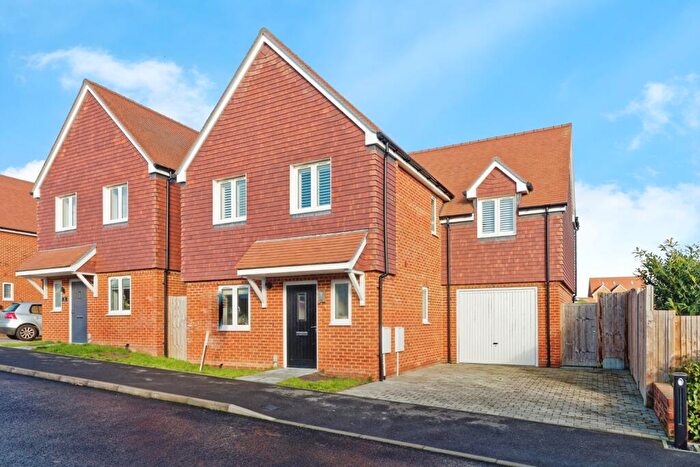
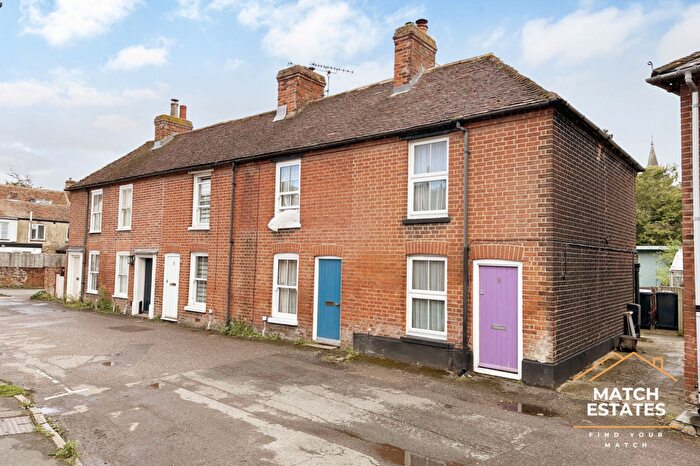
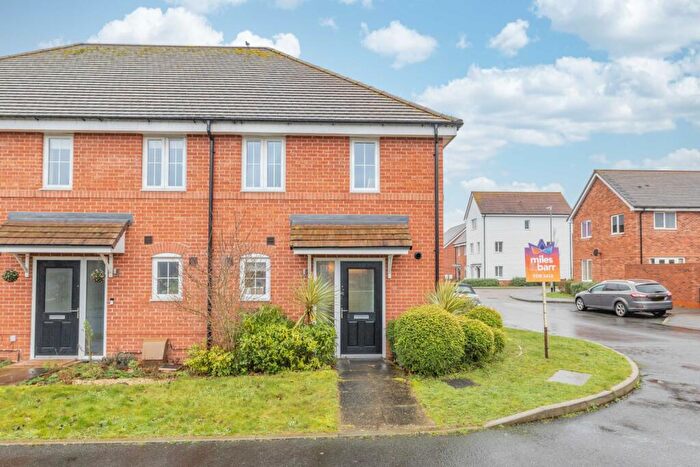
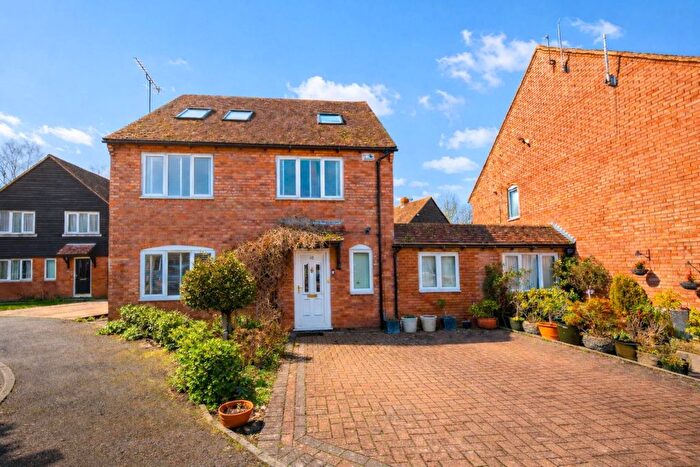
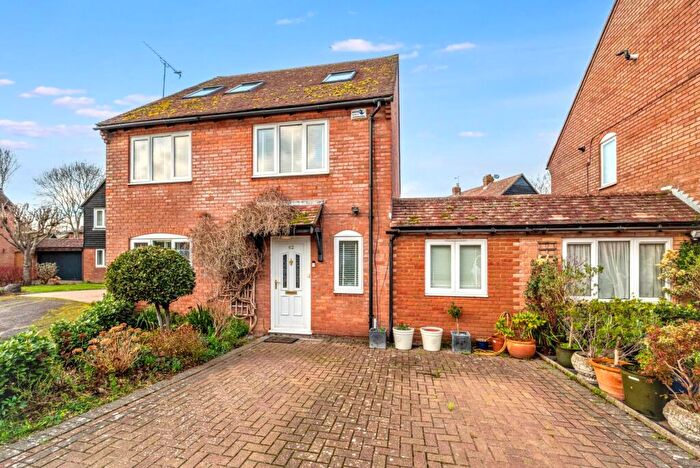
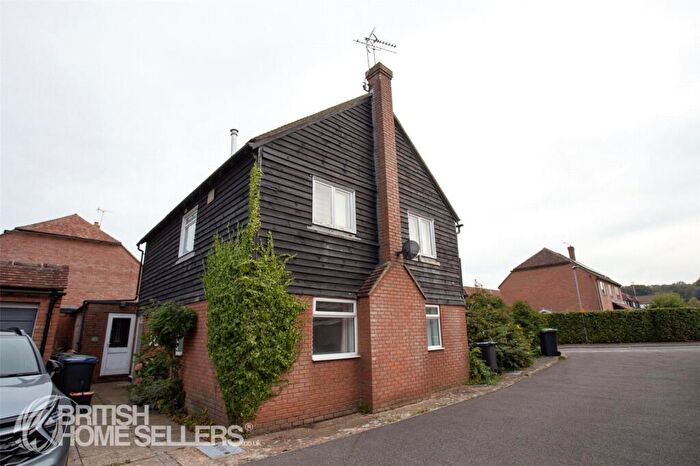
Houses for sale & to rent in North Nailbourne, Canterbury
House Prices in North Nailbourne
Properties in North Nailbourne have an average house price of £538,125.00 and had 90 Property Transactions within the last 3 years¹.
North Nailbourne is an area in Canterbury, Kent with 990 households², where the most expensive property was sold for £1,925,000.00.
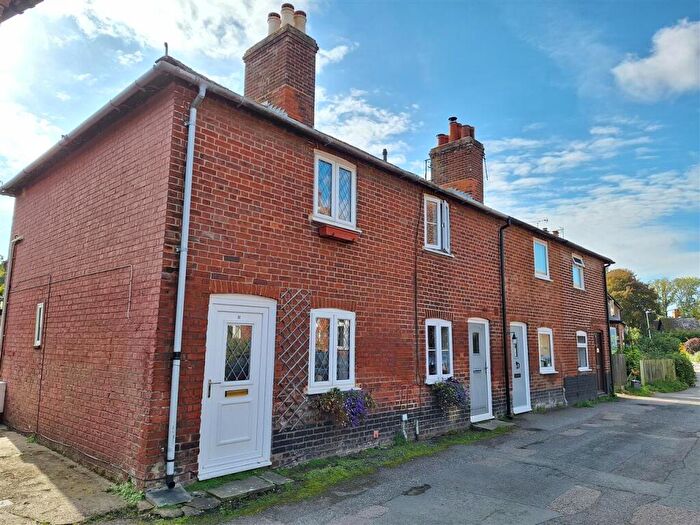
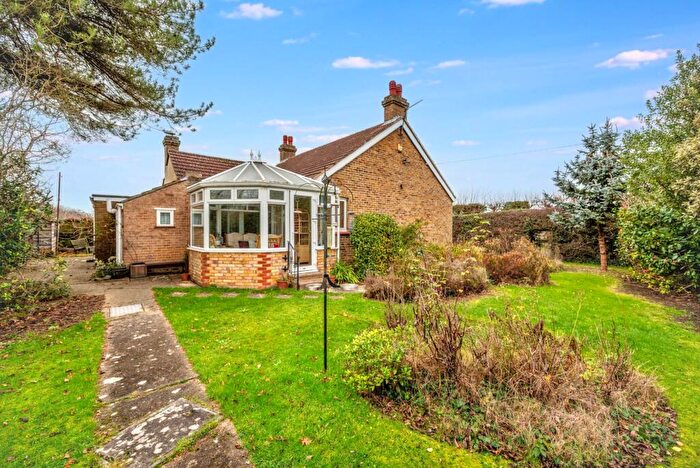
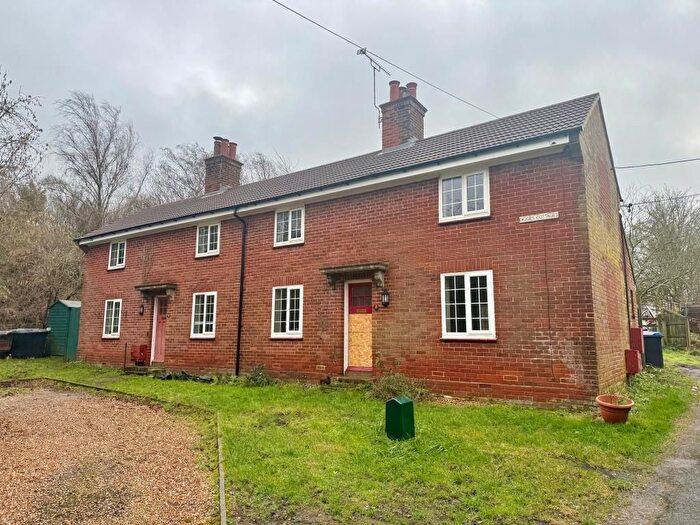
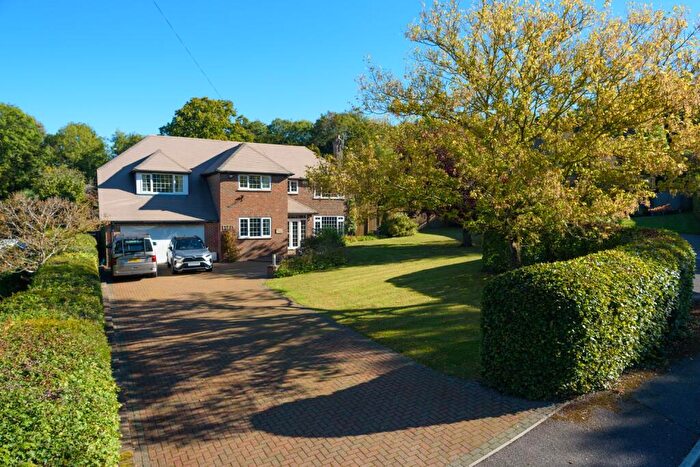
Properties for sale in North Nailbourne
Roads and Postcodes in North Nailbourne
Navigate through our locations to find the location of your next house in North Nailbourne, Canterbury for sale or to rent.
| Streets | Postcodes |
|---|---|
| Adisham Road | CT4 5EY |
| Aerodrome Road | CT4 5EX |
| Beech Hill | CT4 5AU |
| Bekesbourne Hill | CT4 5DZ CT4 5ED |
| Bekesbourne Lane | CT3 1XD CT4 5DX |
| Bekesbourne Road | CT4 5AE |
| Bifrons Gardens | CT4 5DG |
| Bifrons Road | CT4 5DE |
| Bourne Park | CT4 5BJ |
| Bourne View | CT4 5LJ |
| Brewery Lane | CT4 5LD CT4 5LF |
| Bridge | CT4 5AN CT4 5BE CT4 5HH |
| Bridge Down | CT4 5AZ CT4 5BA |
| Bridge Hill | CT4 5AS CT4 5AX |
| Bridgeford Way | CT4 5LE |
| Conyngham Lane | CT4 5JU CT4 5JX |
| De Havillands | CT4 5BW |
| Dering Close | CT4 5ND |
| Dering Road | CT4 5NA |
| Downside | CT4 5HA |
| Filmer Road | CT4 5NB |
| Ford Close | CT4 5LX |
| Green Court | CT4 5LU |
| High Street | CT4 5AR CT4 5JY CT4 5JZ CT4 5LA CT4 5LB |
| Higham Lane | CT4 5AY CT4 5BB |
| Hode Lane | CT4 5DH |
| Keepers Hill | CT4 5BT |
| Littlebourne Road | CT4 5EG CT4 5EH |
| Lynsore Bottom | CT4 6EQ |
| Lynton Place | CT4 5AP |
| Lysander Close | CT4 5EZ |
| Meadow Close | CT4 5AT |
| Mill Lane | CT4 5LH |
| Mount Charles Walk | CT4 5JS |
| Oakleigh Lane | CT4 5EB |
| Old Palace Road | CT4 5ES |
| Park Lane | CT4 5HY |
| Patrixbourne Road | CT4 5BL |
| Pett Bottom | CT4 5PD CT4 6EH |
| Renville | CT4 5AD |
| Riverside Close | CT4 5BN CT4 5TN |
| Riverside Mews | CT4 5TW |
| Saxon Road | CT4 5LR |
| School Lane | CT4 5ER CT4 5ET |
| St Marys Road | CT4 5BY |
| Station Approach | CT4 5DT |
| Station Road | CT4 5AL CT4 5DD CT4 5EP |
| The Close | CT4 5NJ |
| The Green | CT4 5BS |
| The Street | CT4 5BZ CT4 5DA CT4 5HT CT4 5HU CT4 5HX CT4 5HZ |
| Union Road | CT4 5LN CT4 5LW |
| Western Avenue | CT4 5LS CT4 5LT |
| Windmill Close | CT4 5LY |
| Woodgate | CT4 5JL |
| CT4 5BP CT4 5HQ CT4 5JA CT4 5JB CT4 5JD CT4 5JE |
Transport near North Nailbourne
-
Bekesbourne Station
-
Adisham Station
-
Canterbury East Station
-
Canterbury West Station
-
Aylesham Station
-
Sturry Station
-
Snowdown Station
-
Chartham Station
- FAQ
- Price Paid By Year
- Property Type Price
Frequently asked questions about North Nailbourne
What is the average price for a property for sale in North Nailbourne?
The average price for a property for sale in North Nailbourne is £538,125. This amount is 43% higher than the average price in Canterbury. There are 851 property listings for sale in North Nailbourne.
What streets have the most expensive properties for sale in North Nailbourne?
The streets with the most expensive properties for sale in North Nailbourne are Pett Bottom at an average of £1,925,000, Station Road at an average of £1,840,000 and Bourne Park at an average of £1,750,000.
What streets have the most affordable properties for sale in North Nailbourne?
The streets with the most affordable properties for sale in North Nailbourne are Filmer Road at an average of £218,000, Higham Lane at an average of £235,000 and The Close at an average of £259,166.
Which train stations are available in or near North Nailbourne?
Some of the train stations available in or near North Nailbourne are Bekesbourne, Adisham and Canterbury East.
Property Price Paid in North Nailbourne by Year
The average sold property price by year was:
| Year | Average Sold Price | Price Change |
Sold Properties
|
|---|---|---|---|
| 2025 | £527,218 | -7% |
28 Properties |
| 2024 | £564,972 | 10% |
37 Properties |
| 2023 | £510,607 | 12% |
25 Properties |
| 2022 | £447,428 | -15% |
35 Properties |
| 2021 | £513,056 | 20% |
59 Properties |
| 2020 | £410,180 | 12% |
54 Properties |
| 2019 | £359,981 | -8% |
55 Properties |
| 2018 | £388,571 | -11% |
42 Properties |
| 2017 | £429,375 | 28% |
43 Properties |
| 2016 | £309,211 | -2% |
39 Properties |
| 2015 | £315,201 | -8% |
50 Properties |
| 2014 | £341,584 | 9% |
37 Properties |
| 2013 | £309,620 | -8% |
35 Properties |
| 2012 | £334,648 | 5% |
40 Properties |
| 2011 | £317,334 | -2% |
39 Properties |
| 2010 | £324,854 | 15% |
31 Properties |
| 2009 | £276,538 | -24% |
30 Properties |
| 2008 | £344,086 | 19% |
25 Properties |
| 2007 | £279,717 | -19% |
67 Properties |
| 2006 | £332,722 | 23% |
52 Properties |
| 2005 | £257,203 | -15% |
28 Properties |
| 2004 | £296,297 | 16% |
55 Properties |
| 2003 | £247,836 | 28% |
47 Properties |
| 2002 | £178,524 | -2% |
56 Properties |
| 2001 | £181,291 | 17% |
41 Properties |
| 2000 | £150,821 | 10% |
39 Properties |
| 1999 | £136,327 | -8% |
39 Properties |
| 1998 | £147,337 | 29% |
46 Properties |
| 1997 | £104,392 | 11% |
47 Properties |
| 1996 | £92,513 | 13% |
38 Properties |
| 1995 | £80,102 | - |
36 Properties |
Property Price per Property Type in North Nailbourne
Here you can find historic sold price data in order to help with your property search.
The average Property Paid Price for specific property types in the last three years are:
| Property Type | Average Sold Price | Sold Properties |
|---|---|---|
| Semi Detached House | £497,416.00 | 24 Semi Detached Houses |
| Detached House | £767,934.00 | 35 Detached Houses |
| Terraced House | £328,578.00 | 27 Terraced Houses |
| Flat | £186,000.00 | 4 Flats |

