Houses for sale & to rent in Downs North, Canterbury
House Prices in Downs North
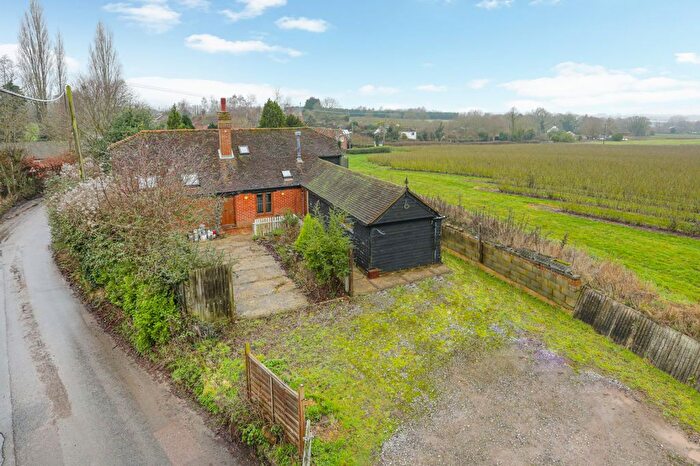
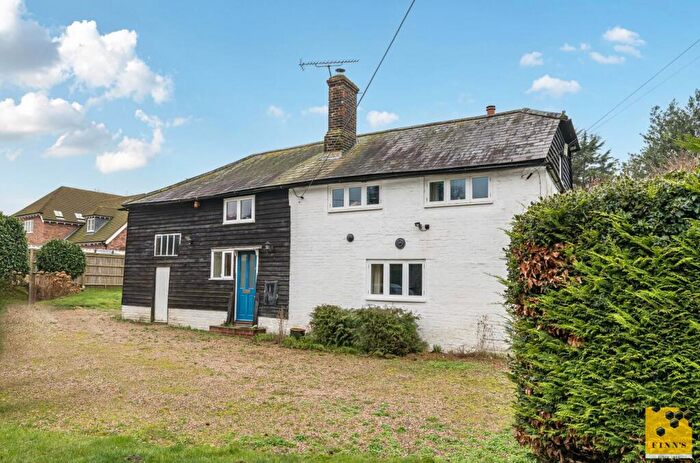
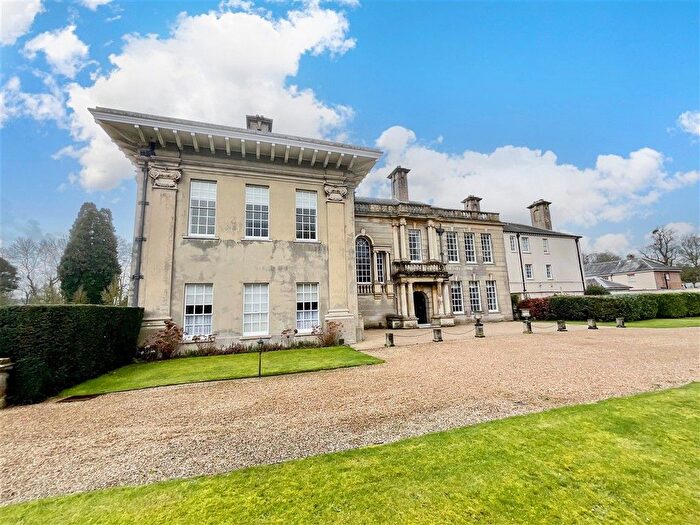
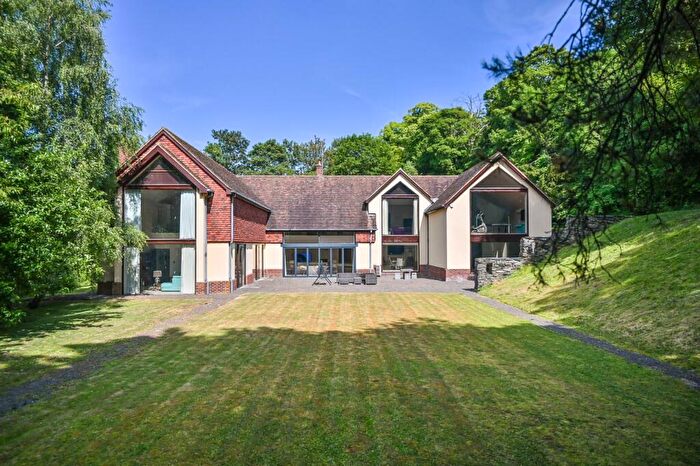
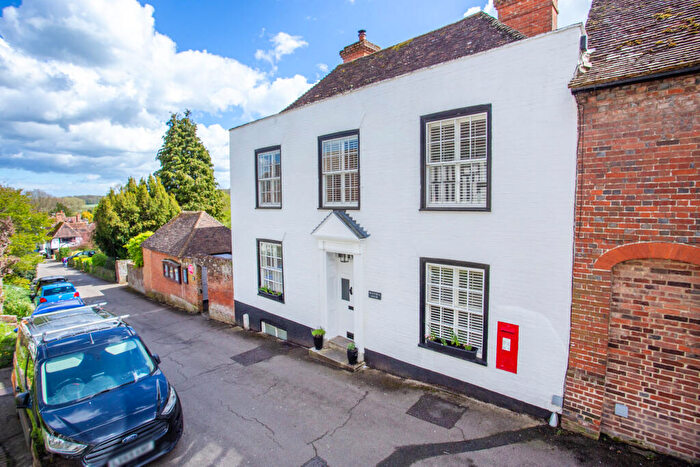
Properties in Downs North have an average house price of £578,863.00 and had 67 Property Transactions within the last 3 years¹.
Downs North is an area in Canterbury, Kent with 943 households², where the most expensive property was sold for £1,475,000.00.
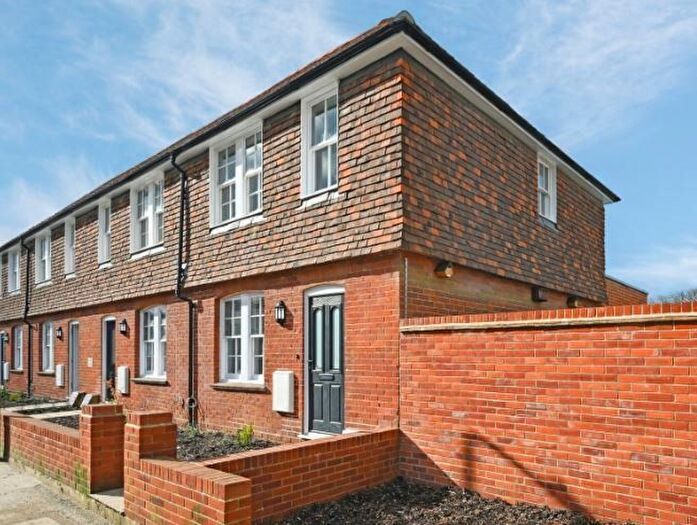
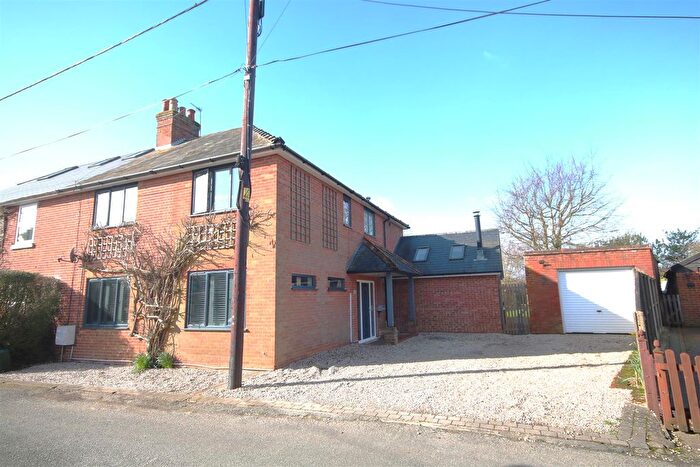
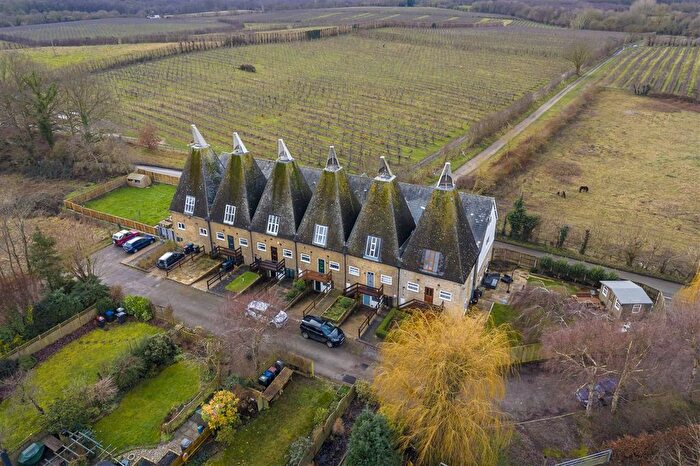
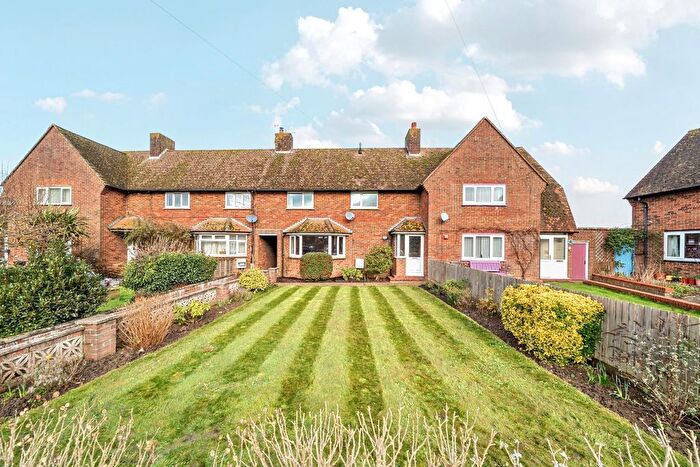
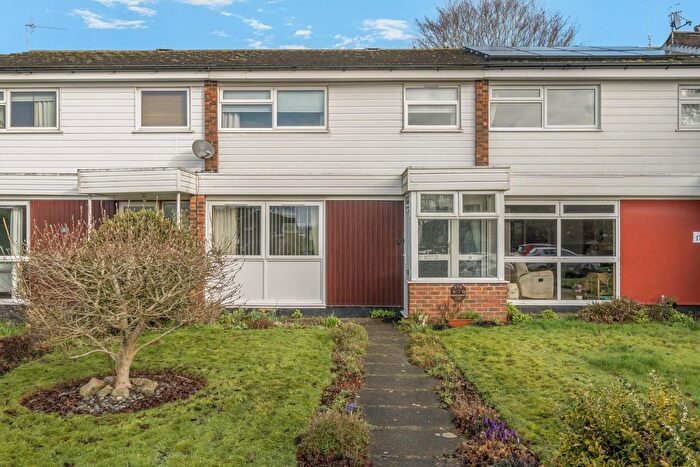
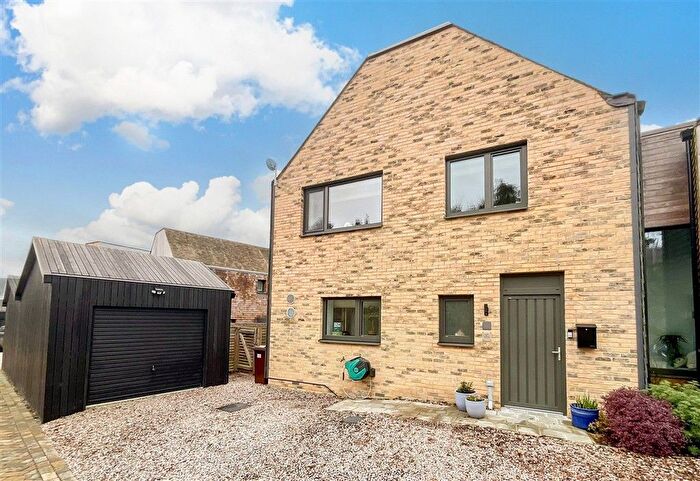
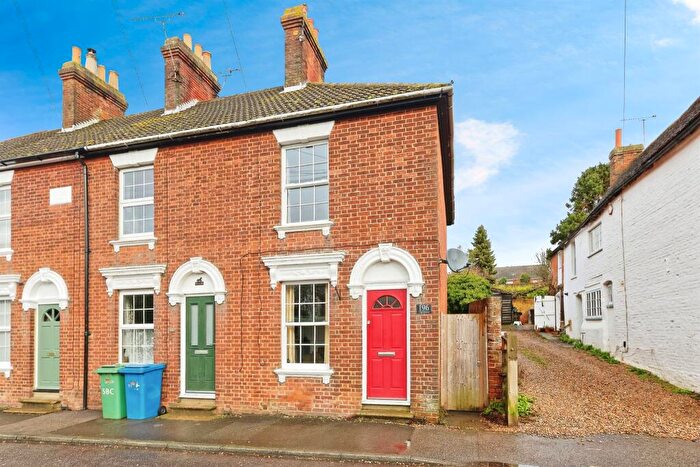
Properties for sale in Downs North
Roads and Postcodes in Downs North
Navigate through our locations to find the location of your next house in Downs North, Canterbury for sale or to rent.
| Streets | Postcodes |
|---|---|
| Ashford Road | CT4 7DH CT4 8EE CT4 7DG |
| Bagham Lane | CT4 8DU |
| Bagham Place | CT4 8DF |
| Beaneys Lane | CT4 8JB CT4 8JD |
| Bowerland Lane | CT4 8AT CT4 8ED CT4 8EH |
| Branch Road | CT4 8DR |
| Canterbury Road | CT4 7DR CT4 8AE CT4 8AG CT4 8DX CT4 8DZ CT4 8EB CT4 8HA CT4 8HJ CT4 7DP CT4 7DS CT4 8EX CT4 8HF CT4 8HL |
| Chalk Hill | CT4 8DT |
| Cherry Orchard | CT4 8BQ |
| Chilham Castle Estate | CT4 8DB |
| Church Hill | CT4 8DA |
| Church Lane | CT4 8HB CT4 8HD |
| Cobbs Hill | CT4 8AL CT4 8AR CT4 8AW CT4 8AP |
| Dane Street | CT4 8ER |
| Denne Manor Lane | CT4 8JH CT4 8JJ |
| Denwood Street | CT4 7EF |
| East Villas | CT4 8AY |
| Eggarton Lane | CT4 7DY |
| Felborough Close | CT4 8DS CT4 8DW |
| Godmersham Park | CT4 7DT |
| Goldups Lane | CT4 8JG CT4 8JQ |
| Green Lane | CT4 8BJ CT4 8HT |
| Hambrook Close | CT4 8EJ |
| Hambrook Lane | CT4 8DJ |
| Herons Close | CT4 8DN |
| Knockwood Lane | CT4 8HW CT4 8HN |
| Lees Terrace | CT4 8AN |
| Long Hill | CT4 8BN |
| Lower Ensden Road | CT4 8BA |
| Lower Lees Road | CT4 8AS CT4 8AU CT4 8AX CT4 8AZ |
| Lower Road | CT4 8JT |
| Maidstone Road | CT4 8DD CT4 8EU CT4 8ES CT4 8ET |
| Meadow Close | CT4 8DY |
| Mill Lane | CT4 8EF |
| Mountain Street | CT4 8DG CT4 8DQ CT4 8DH |
| Mulberry Hill | CT4 8AH CT4 8AJ |
| Mystole Lane | CT4 7DE CT4 8EA |
| New Cut Road | CT4 8BW |
| New Forest Lane | CT4 8BG |
| Northdowns Close | CT4 8BP |
| Old Sawmills Row | CT4 8BU |
| Palmers Cottages | CT4 8JP |
| Pennypot Lane | CT4 7EY CT4 7EZ |
| Pilgrims Lane | CT4 8AA CT4 8AB |
| Pope Street | CT4 7DL CT4 7DN |
| Pound Lane | CT4 8HG CT4 8HQ |
| Purr Wood | CT4 7DX |
| Rose Cottages | CT4 8JN |
| School Hill | CT4 8DE |
| Selling Road | CT4 8BB CT4 8BD CT4 8BE CT4 8BH |
| Shalmsford Bridge | CT4 8AF |
| Shalmsford Road | CT4 8AD CT4 8BS |
| Shiregate Cottages | CT4 8JX |
| Shottenden Lane | CT4 8EY CT4 8HU CT4 8BF CT4 8EZ |
| Shottenden Road | CT4 8HY |
| Shrimpton Close | CT4 8BT |
| Sole Street | CT4 7ER CT4 7ES CT4 7ET |
| Sole Street Cottages | CT4 7EP |
| Soles Hill | CT4 8JY CT4 8JZ |
| Soleshill Road | CT4 8JR |
| Station Approach | CT4 8EG |
| Sunley Gardens | CT4 7DF |
| Taylors Hill | CT4 8BZ |
| The Paddock | CT4 8BL |
| The Square | CT4 8BY |
| The Street | CT4 7DU CT4 8BX CT4 8DL CT4 8DP CT4 8HE CT4 8HH |
| Wellhouse Lane | CT4 8HR CT4 8HS |
| CT4 7EA CT4 7EB CT4 7EE CT4 7EL CT4 7EN CT4 7EW CT4 8JA CT4 8JE CT4 8JL CT4 8JU CT4 7ED CT4 7EH CT4 7EJ CT4 8HP CT4 8HX CT4 8JS |
Transport near Downs North
- FAQ
- Price Paid By Year
- Property Type Price
Frequently asked questions about Downs North
What is the average price for a property for sale in Downs North?
The average price for a property for sale in Downs North is £578,863. This amount is 54% higher than the average price in Canterbury. There are 1,237 property listings for sale in Downs North.
What streets have the most expensive properties for sale in Downs North?
The streets with the most expensive properties for sale in Downs North are Mulberry Hill at an average of £1,425,000, Lower Ensden Road at an average of £1,165,000 and Eggarton Lane at an average of £950,000.
What streets have the most affordable properties for sale in Downs North?
The streets with the most affordable properties for sale in Downs North are Sunley Gardens at an average of £173,600, Felborough Close at an average of £280,000 and Old Sawmills Row at an average of £332,000.
Which train stations are available in or near Downs North?
Some of the train stations available in or near Downs North are Chilham, Selling and Chartham.
Property Price Paid in Downs North by Year
The average sold property price by year was:
| Year | Average Sold Price | Price Change |
Sold Properties
|
|---|---|---|---|
| 2025 | £496,319 | -28% |
23 Properties |
| 2024 | £634,326 | 5% |
26 Properties |
| 2023 | £604,222 | 9% |
18 Properties |
| 2022 | £548,740 | 19% |
31 Properties |
| 2021 | £445,842 | -15% |
47 Properties |
| 2020 | £514,045 | 7% |
33 Properties |
| 2019 | £475,545 | -5% |
22 Properties |
| 2018 | £500,134 | 14% |
26 Properties |
| 2017 | £431,079 | 19% |
41 Properties |
| 2016 | £349,092 | -25% |
37 Properties |
| 2015 | £436,803 | -3% |
33 Properties |
| 2014 | £448,055 | 6% |
36 Properties |
| 2013 | £423,025 | 13% |
20 Properties |
| 2012 | £369,200 | 25% |
27 Properties |
| 2011 | £277,235 | -30% |
17 Properties |
| 2010 | £361,249 | 9% |
30 Properties |
| 2009 | £329,131 | -9% |
22 Properties |
| 2008 | £358,856 | 15% |
28 Properties |
| 2007 | £305,750 | -1% |
38 Properties |
| 2006 | £308,355 | 8% |
42 Properties |
| 2005 | £282,856 | 2% |
28 Properties |
| 2004 | £277,705 | 2% |
41 Properties |
| 2003 | £272,052 | 32% |
34 Properties |
| 2002 | £183,884 | 2% |
40 Properties |
| 2001 | £181,015 | 8% |
50 Properties |
| 2000 | £167,048 | 38% |
49 Properties |
| 1999 | £104,362 | -28% |
24 Properties |
| 1998 | £133,287 | 2% |
40 Properties |
| 1997 | £130,163 | 26% |
53 Properties |
| 1996 | £96,100 | 1% |
23 Properties |
| 1995 | £94,700 | - |
25 Properties |
Property Price per Property Type in Downs North
Here you can find historic sold price data in order to help with your property search.
The average Property Paid Price for specific property types in the last three years are:
| Property Type | Average Sold Price | Sold Properties |
|---|---|---|
| Semi Detached House | £559,235.00 | 18 Semi Detached Houses |
| Detached House | £659,960.00 | 38 Detached Houses |
| Terraced House | £330,827.00 | 11 Terraced Houses |

