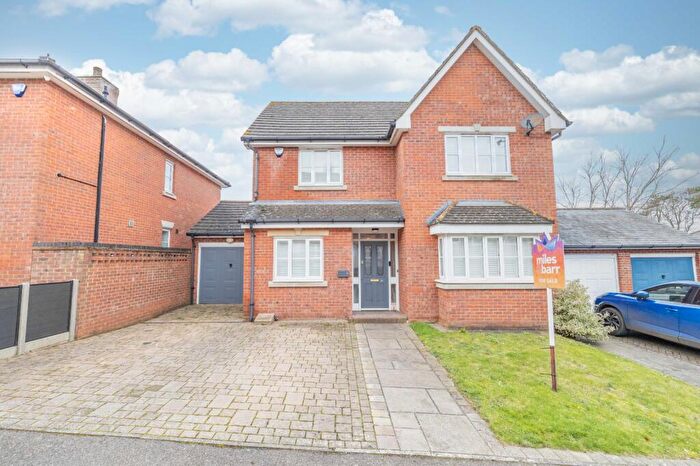
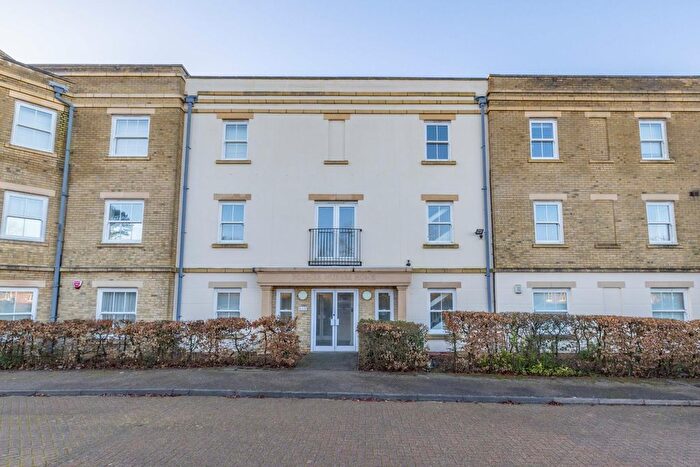
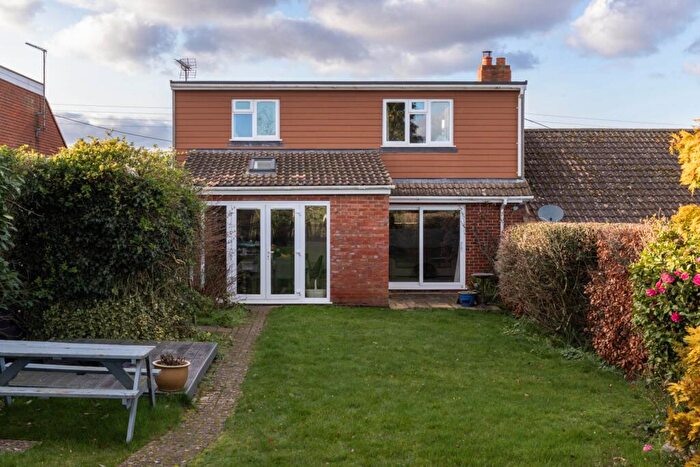
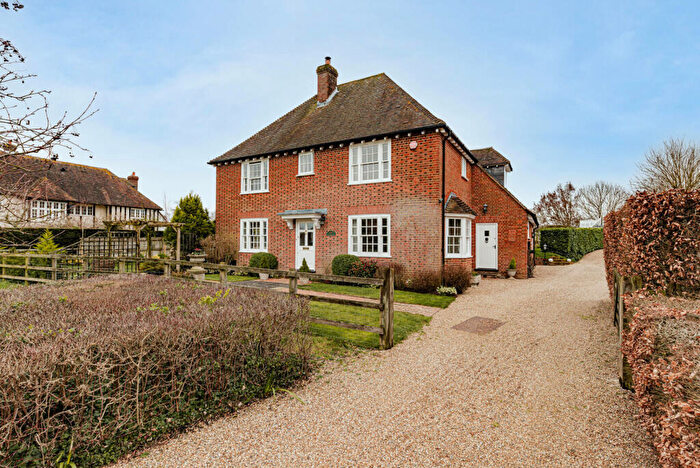
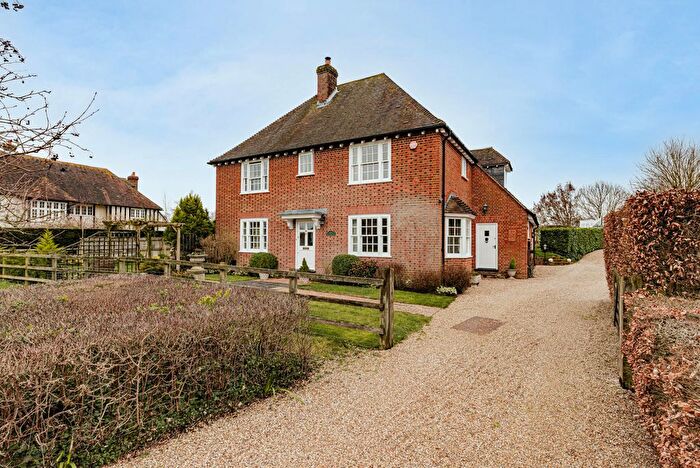
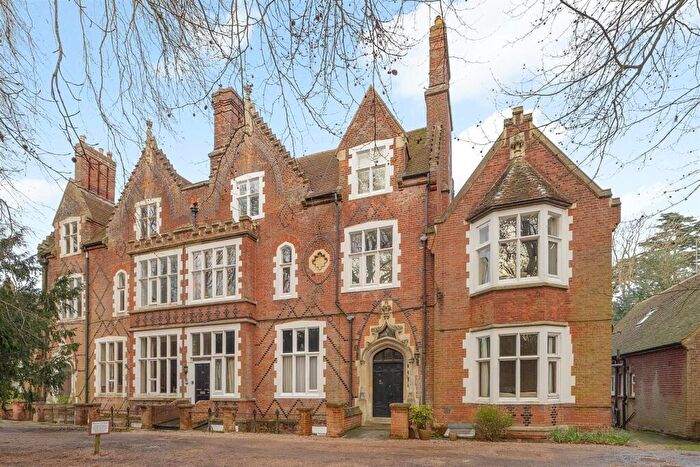
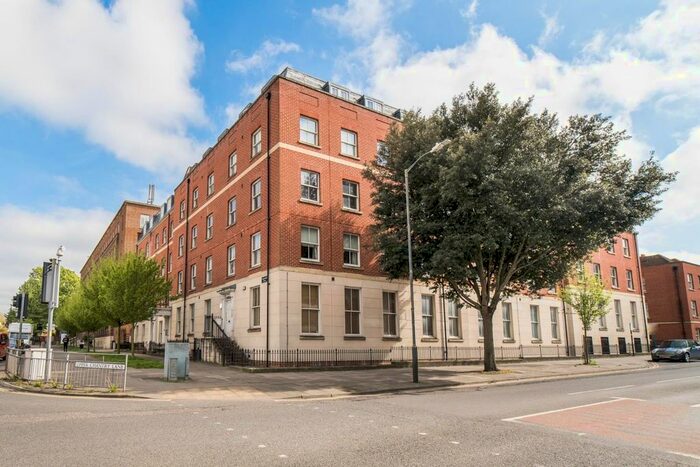
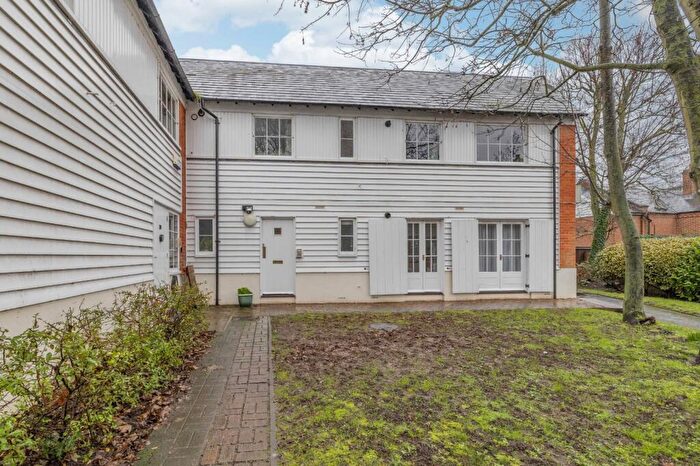
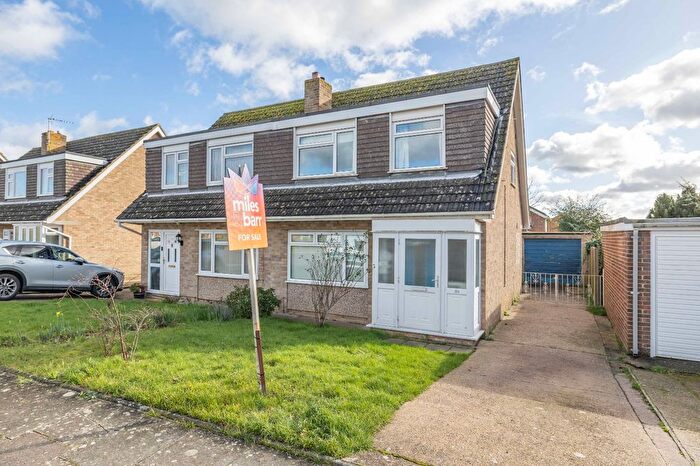
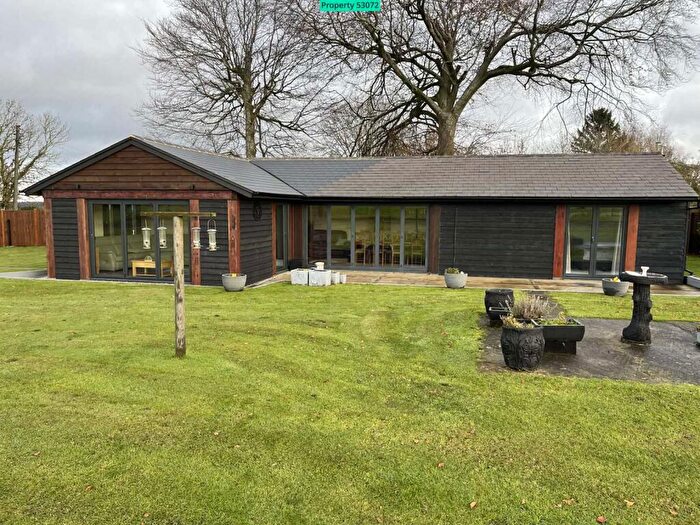
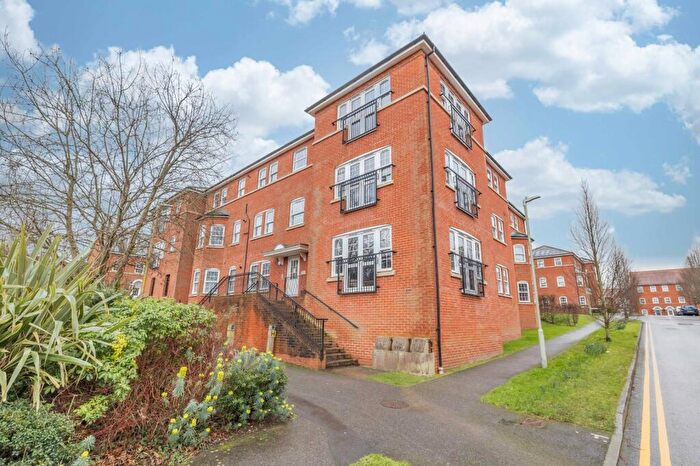
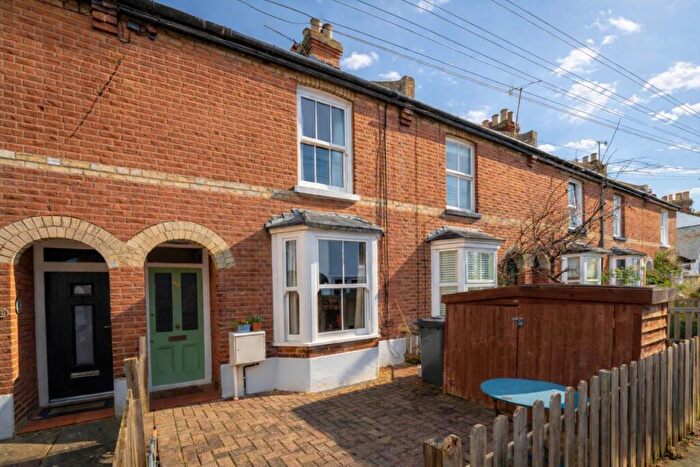
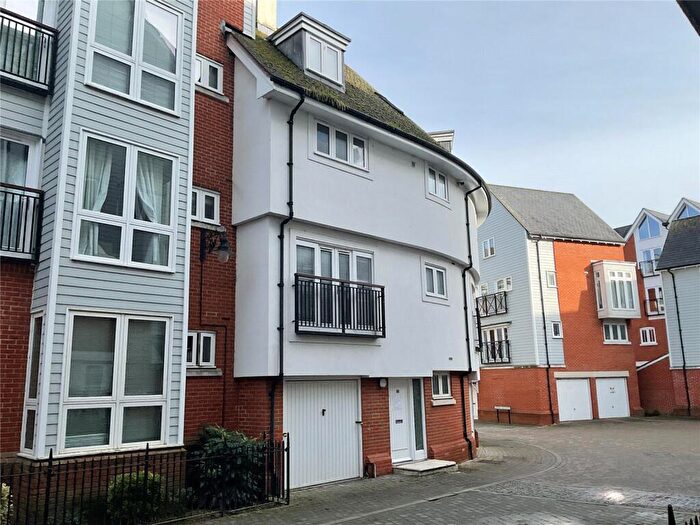
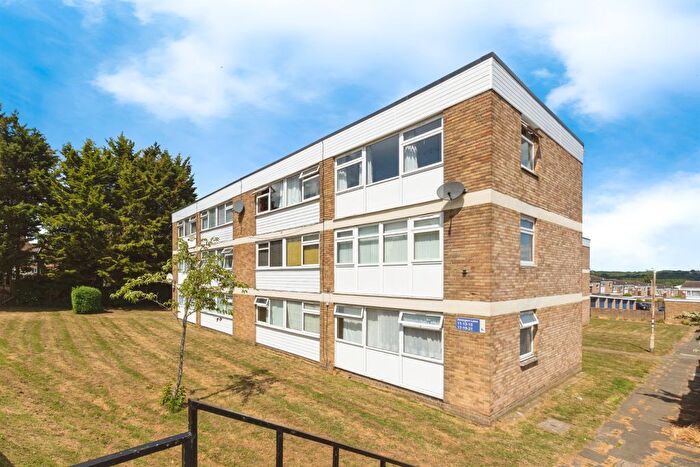
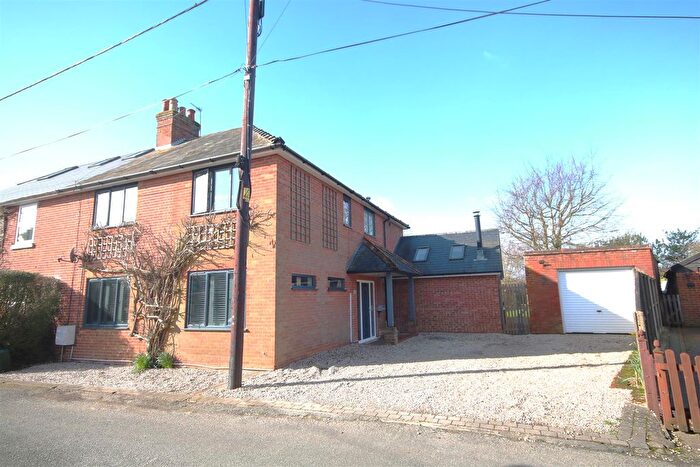
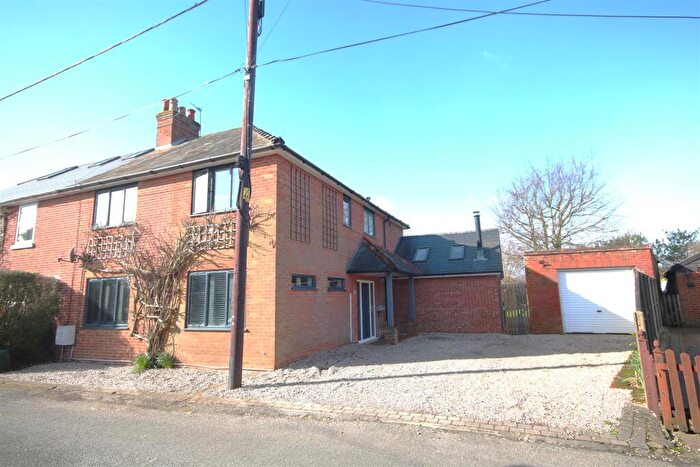
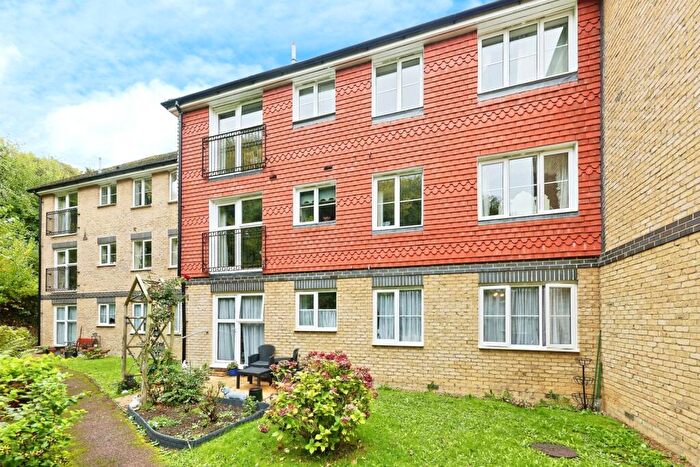
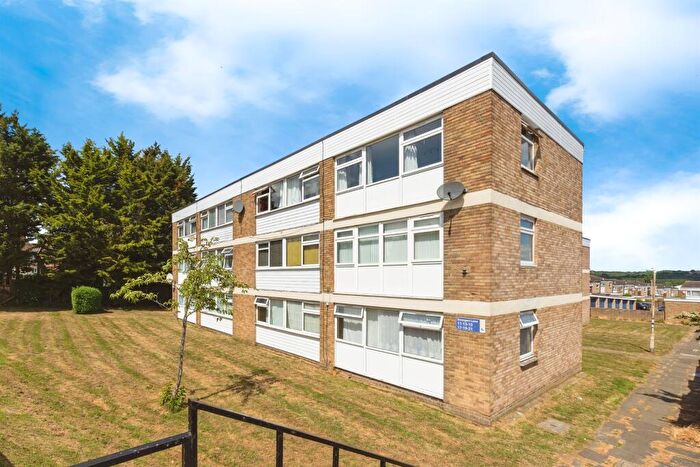
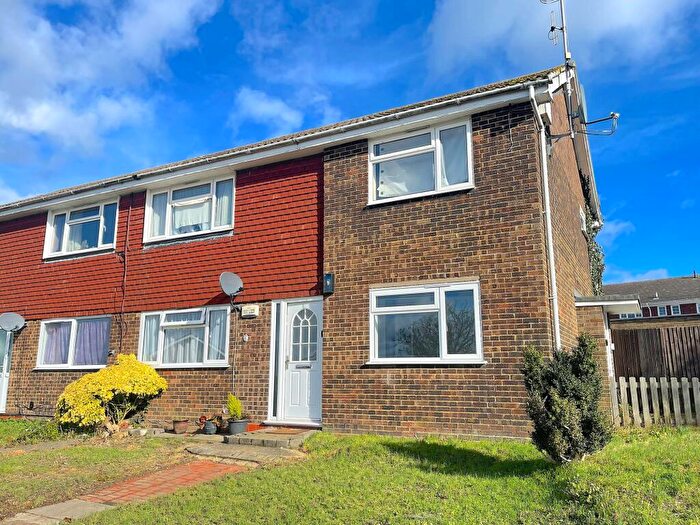
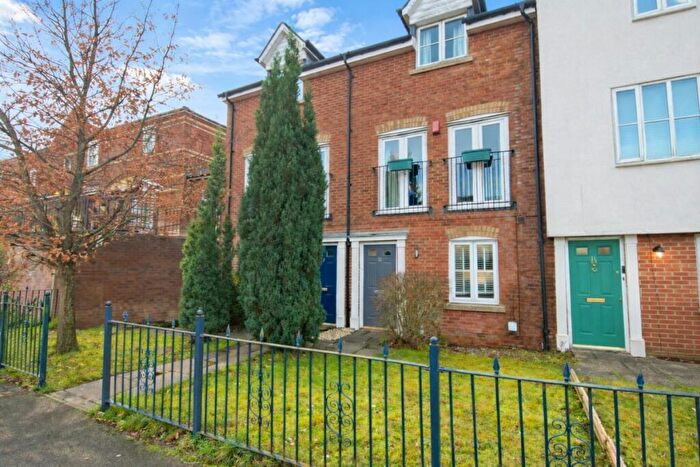
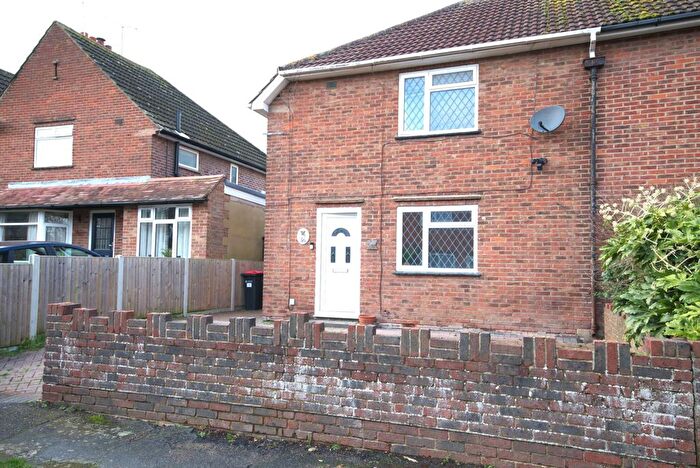
Houses for sale & to rent in Chartham & Stone Street, Canterbury
House Prices in Chartham & Stone Street
Properties in Chartham & Stone Street have an average house price of £552,892.00 and had 14 Property Transactions within the last 3 years¹.
Chartham & Stone Street is an area in Canterbury, Kent with 301 households², where the most expensive property was sold for £1,400,000.00.
Properties for sale in Chartham & Stone Street
Roads and Postcodes in Chartham & Stone Street
Navigate through our locations to find the location of your next house in Chartham & Stone Street, Canterbury for sale or to rent.
| Streets | Postcodes |
|---|---|
| Church Hill | CT2 9AD CT2 9AQ |
| Ansdore | CT4 5QB CT4 5QD |
| Ashford Road | CT4 7HB |
| Ashton Villas | CT4 5RB |
| Bigbury Road | CT4 7NF CT4 7NG |
| Bolts Hill | CT4 7JZ |
| Capel Lane | CT4 5RQ |
| Church Lane | CT4 5SG CT4 7AE |
| Cockering Road | CT4 7EG CT4 7PQ |
| Denstead Lane | CT4 7NJ |
| Downs View Way | CT4 7EQ |
| Faulkners Lane | CT2 9DN |
| Garlinge Green | CT4 5RS |
| Heppington | CT4 7AN |
| Hobday Wood Lane | CT4 5BQ |
| Howfield Lane | CT4 7HQ CT4 7LY |
| Limes Place | CT2 9DW |
| London Road | CT2 9AU |
| Mill Lane | CT2 8NG |
| Mystole Lane | CT4 7RT |
| Nackington Road | CT4 7AB CT4 7AZ |
| Nickle Lane | CT4 7PD |
| Parish Road | CT4 7JU |
| Penny Pot Lane | CT4 7BU |
| Pennypot Lane | CT4 7BT |
| Pett Bottom | CT4 5PA |
| Primrose Hill | CT4 7NR CT4 7NS CT4 7NT |
| Rattington Street | CT4 7JH |
| Rectory Lane | CT4 6EJ |
| Shalmsford Court | CT4 7QR |
| Shalmsford Street | CT4 7RW CT4 7SB |
| Station Road | CT4 7HU CT4 7HX CT4 7JA |
| Stour Valley Industrial Estate | CT4 7HF |
| Street End | CT4 5NR |
| Summer Hill | CT2 8GT CT2 8NW |
| Summer Piece Grove | CT4 7DW |
| Swarling Hill Road | CT4 5QW |
| Sycamore Close | CT4 7TS |
| The Hyde | CT4 7LE CT4 7LF |
| The Street | CT4 5QX |
| Thruxted Lane | CT4 7SA |
| Tillard Close | CT4 5RA |
| Waltham Road | CT4 5SA |
| Whiteacre | CT4 5SW |
| Wingate Hill | CT2 9AJ |
| CT2 9AP CT2 9AY CT2 9BA CT2 9HX CT4 5NN CT4 5PH CT4 5PY CT4 5QS CT4 5SE CT4 5SP CT4 6DZ CT4 6EP CT4 6EW CT4 7BY |
Transport near Chartham & Stone Street
- FAQ
- Price Paid By Year
- Property Type Price
Frequently asked questions about Chartham & Stone Street
What is the average price for a property for sale in Chartham & Stone Street?
The average price for a property for sale in Chartham & Stone Street is £552,892. This amount is 47% higher than the average price in Canterbury. There are 7,469 property listings for sale in Chartham & Stone Street.
What streets have the most expensive properties for sale in Chartham & Stone Street?
The streets with the most expensive properties for sale in Chartham & Stone Street are Ashford Road at an average of £1,400,000, Heppington at an average of £730,000 and Street End at an average of £650,000.
What streets have the most affordable properties for sale in Chartham & Stone Street?
The streets with the most affordable properties for sale in Chartham & Stone Street are The Street at an average of £162,500, Summer Piece Grove at an average of £322,000 and Limes Place at an average of £416,666.
Which train stations are available in or near Chartham & Stone Street?
Some of the train stations available in or near Chartham & Stone Street are Chartham, Chilham and Canterbury East.
Property Price Paid in Chartham & Stone Street by Year
The average sold property price by year was:
| Year | Average Sold Price | Price Change |
Sold Properties
|
|---|---|---|---|
| 2025 | £328,900 | -125% |
5 Properties |
| 2024 | £740,000 | 25% |
6 Properties |
| 2023 | £552,000 | 26% |
3 Properties |
| 2022 | £409,125 | 10% |
8 Properties |
| 2021 | £368,583 | -35% |
12 Properties |
| 2020 | £496,961 | 29% |
13 Properties |
| 2019 | £351,933 | -14% |
12 Properties |
| 2018 | £402,236 | -15% |
11 Properties |
| 2017 | £462,475 | 32% |
4 Properties |
| 2016 | £315,857 | -33% |
7 Properties |
| 2015 | £420,166 | -17% |
3 Properties |
| 2014 | £490,000 | -252% |
1 Property |
| 2009 | £1,725,000 | - |
1 Property |
Property Price per Property Type in Chartham & Stone Street
Here you can find historic sold price data in order to help with your property search.
The average Property Paid Price for specific property types in the last three years are:
| Property Type | Average Sold Price | Sold Properties |
|---|---|---|
| Semi Detached House | £427,000.00 | 6 Semi Detached Houses |
| Detached House | £716,571.00 | 7 Detached Houses |
| Terraced House | £162,500.00 | 1 Terraced House |

