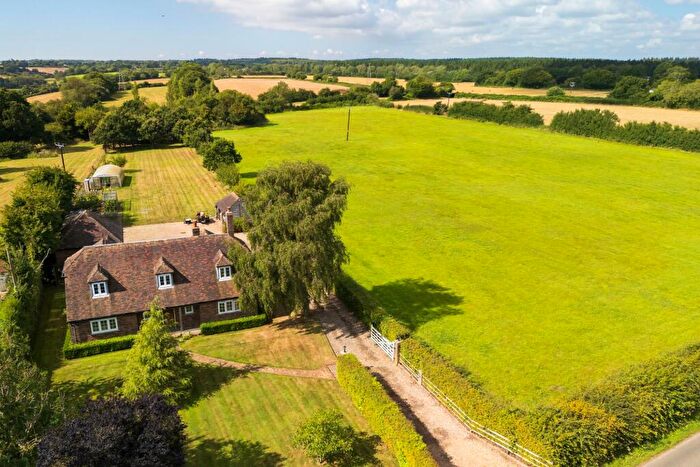
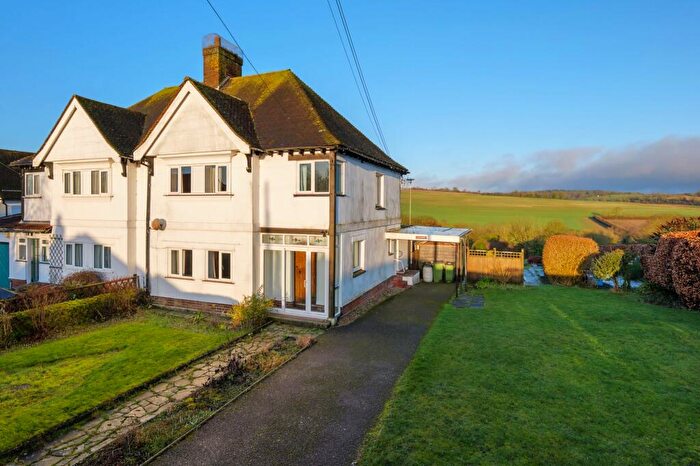
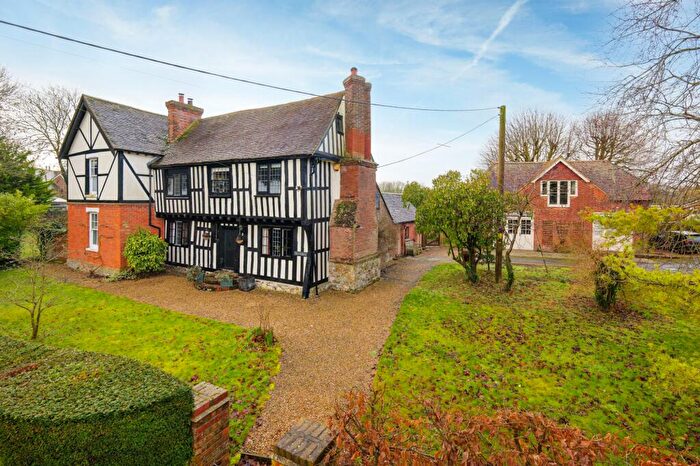
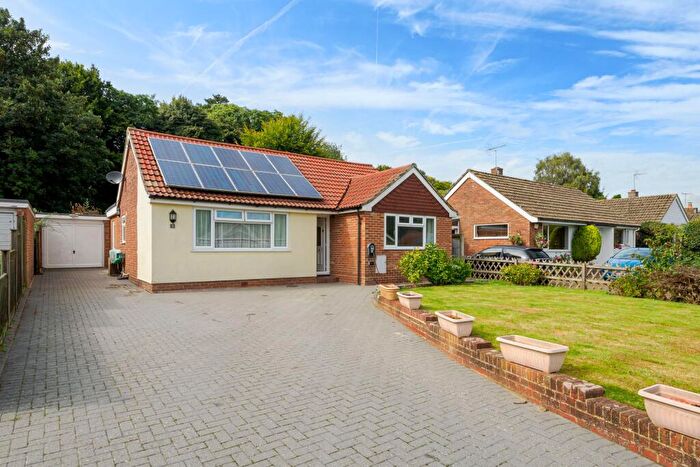
Houses for sale & to rent in Elham And Stelling Minnis, Canterbury
House Prices in Elham And Stelling Minnis
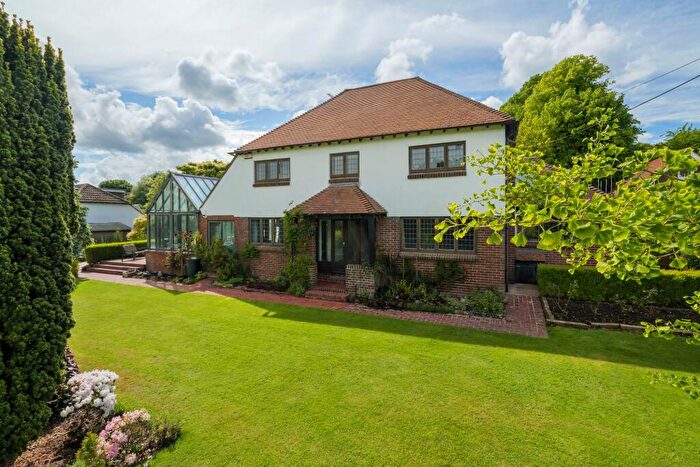
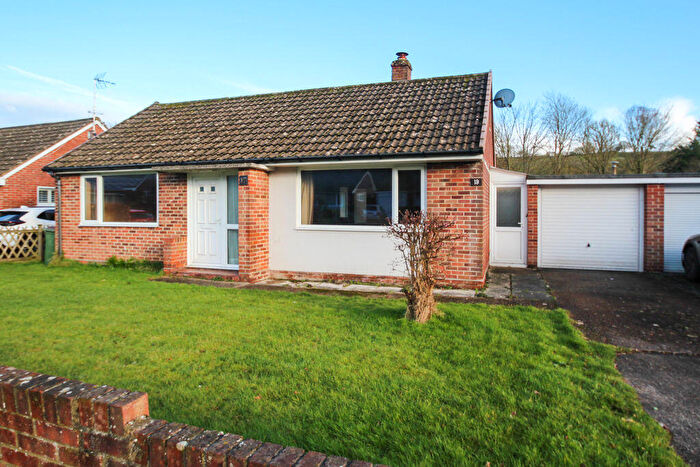
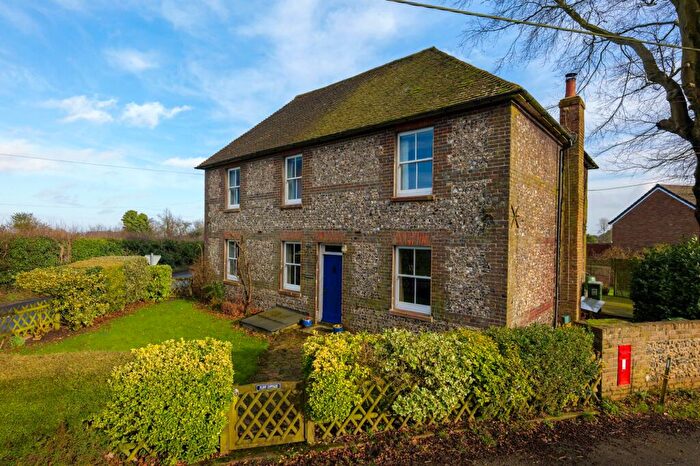
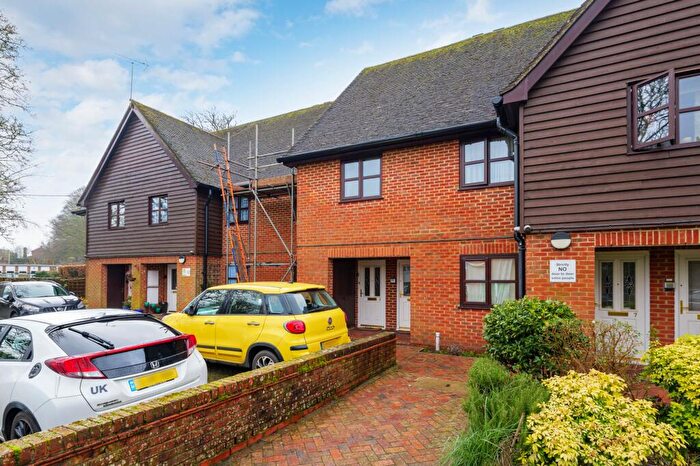
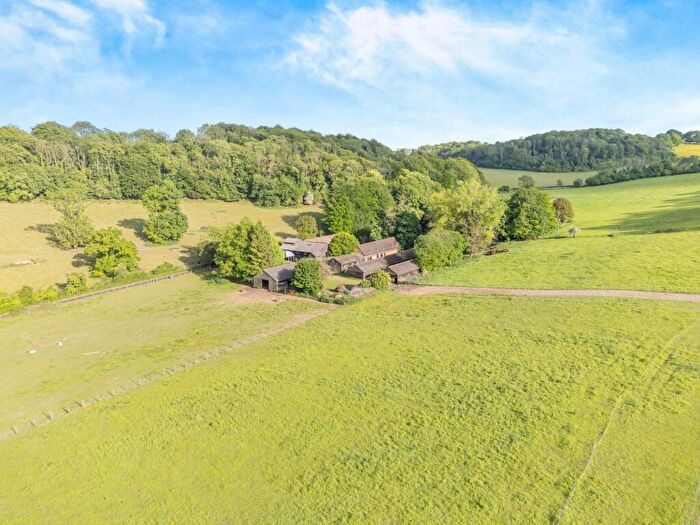
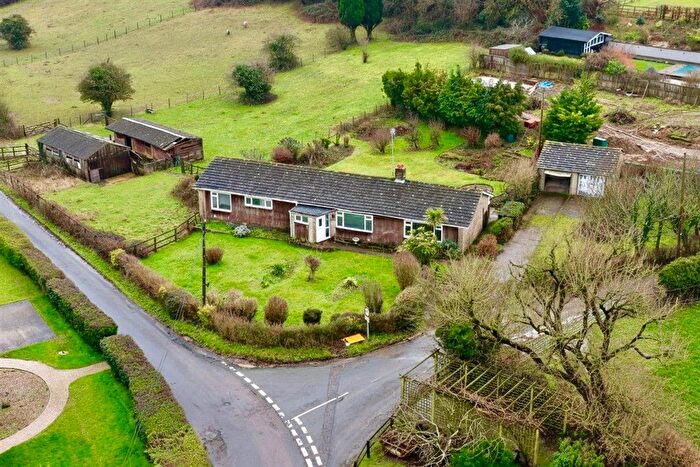
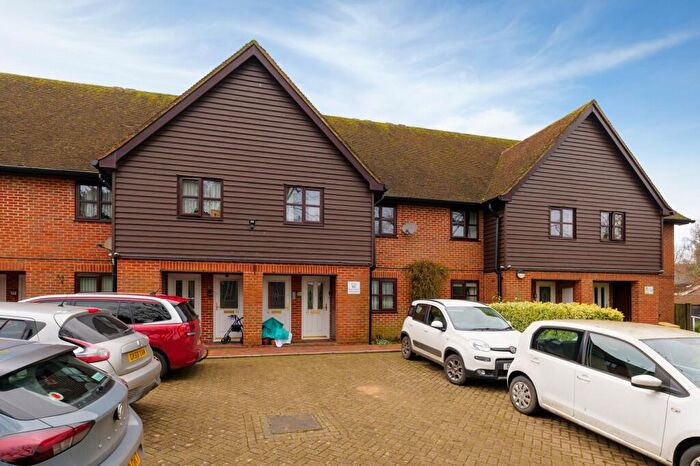
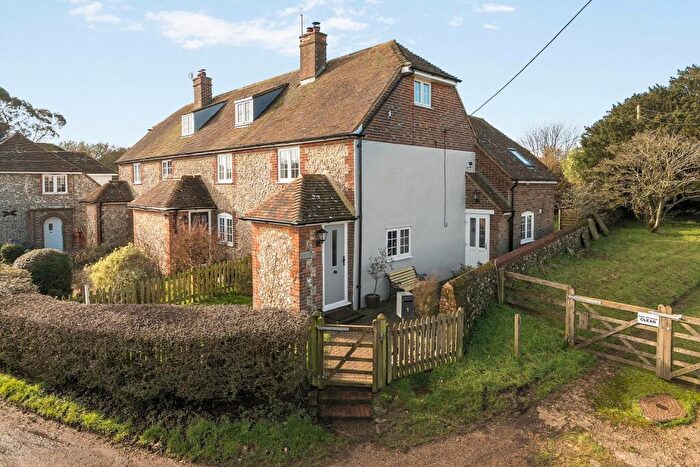
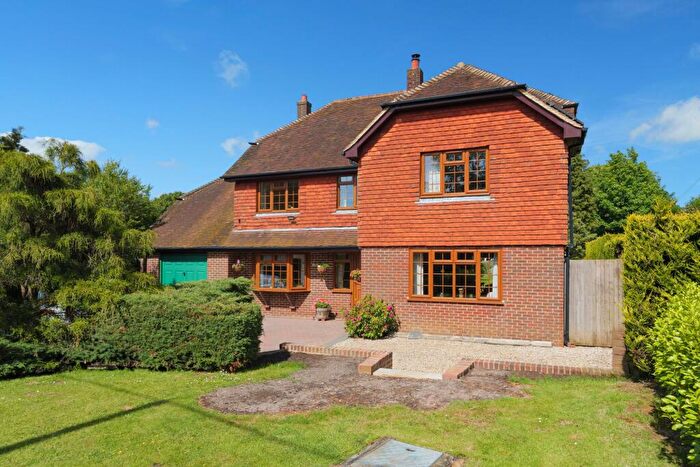
Properties in Elham And Stelling Minnis have an average house price of £532,165.00 and had 54 Property Transactions within the last 3 years¹.
Elham And Stelling Minnis is an area in Canterbury, Kent with 845 households², where the most expensive property was sold for £1,475,000.00.
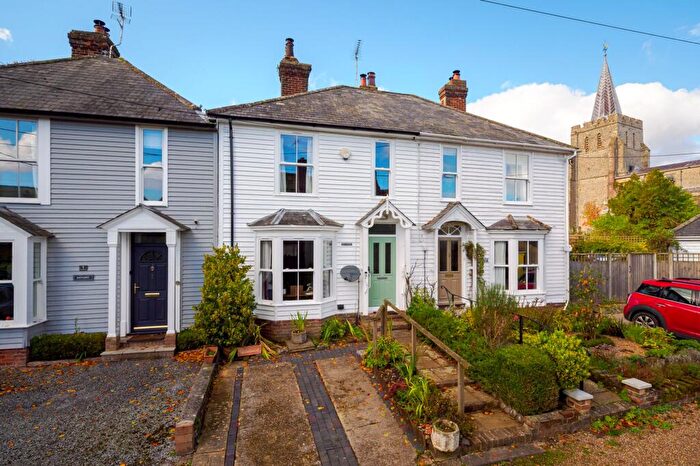
Properties for sale in Elham And Stelling Minnis
Roads and Postcodes in Elham And Stelling Minnis
Navigate through our locations to find the location of your next house in Elham And Stelling Minnis, Canterbury for sale or to rent.
| Streets | Postcodes |
|---|---|
| Bossingham Road | CT4 6AY CT4 6AZ CT4 6BB CT4 6BD CT4 6DU |
| Boyke Lane | CT4 6XL CT4 6XN |
| Brambleton Close | CT4 6BF |
| Canterbury Road | CT4 6LP CT4 6NG CT4 6UE CT4 6UG CT4 6UX CT4 6XH |
| Chapel Lane | CT4 6XR CT4 6YB |
| Cherry Gardens | CT4 6SZ |
| Church Lane | CT4 5PS |
| Church Walk | CT4 6UA |
| Clavertye | CT4 6YE |
| Cock Lane | CT4 6TL |
| Collards Lane | CT4 6UF |
| Crown Lane | CT4 6AT |
| Cullens Hill | CT4 6UJ |
| Cullings Hill | CT4 6TE |
| Curtis Lane | CT4 6BT |
| Droveway | CT4 6AJ |
| Duck Street | CT4 6TN CT4 6TP |
| Exted | CT4 6YG |
| Exted Hill | CT4 6UD |
| Fairfield | CT4 6UT |
| Harvest Lane | CT4 6AX |
| Henbury Lane | CT4 6NL |
| High Street | CT4 6SX CT4 6SY CT4 6TB CT4 6TD |
| Hog Green | CT4 6TU |
| Holly Hill | CT4 6NH |
| Hunters Bank | CT4 6SS |
| Lickpot Hill | CT4 6TY |
| Lime Villas | CT4 6TA |
| Longage Hill | CT4 6XS CT4 6XT |
| Mill Hill | CT4 6XG |
| Mill Lane | CT4 6AF |
| Minnis Field | CT4 6AB |
| Minnis Green | CT4 6AA |
| Minnis Lane | CT4 6AS CT4 6BE CT4 6BS |
| New Jacques Court Cottages | CT4 6ND |
| New Road | CT4 6TQ CT4 6UQ |
| North Elham | CT4 6NJ CT4 6NN CT4 6UY |
| Old Road | CT4 6UH |
| Park Gate | CT4 6NE CT4 6NF |
| Park Lane | CT4 6UR CT4 6UU |
| Pony Cart Lane | CT4 6AU |
| Pound Lane | CT4 6TS |
| Redoak | CT4 6LX |
| Shuttlesfield Lane | CT4 6XJ |
| Station Mews | CT4 6TW |
| Stelling Church Cottages | CT4 5PT |
| Stone Street | CT4 5PU CT4 6BU CT4 6DF |
| The Orchards | CT4 6TR |
| The Row | CT4 6UL CT4 6UN CT4 6UP CT4 6UW |
| The Square | CT4 6TJ |
| Vicarage Lane | CT4 6TT CT4 6TX |
| Wheel Barrow Town | CT4 6AH |
| White Horse Lane | CT4 6LR CT4 6XP |
| Wingmore | CT4 6LS |
| CT4 6AD CT4 6AE CT4 6AG CT4 6AQ CT4 6BG CT4 6BH CT4 6BJ CT4 6LU CT4 6LY CT4 6LZ CT4 6NA CT4 6TZ CT4 6YD |
Transport near Elham And Stelling Minnis
-
Sandling Station
-
Westenhanger Station
-
Shepherd's Well Station
-
Folkestone West Station
-
Snowdown Station
-
Folkestone Central Station
-
Aylesham Station
-
Adisham Station
-
Bekesbourne Station
-
Chartham Station
- FAQ
- Price Paid By Year
- Property Type Price
Frequently asked questions about Elham And Stelling Minnis
What is the average price for a property for sale in Elham And Stelling Minnis?
The average price for a property for sale in Elham And Stelling Minnis is £532,165. This amount is 42% higher than the average price in Canterbury. There are 433 property listings for sale in Elham And Stelling Minnis.
What streets have the most expensive properties for sale in Elham And Stelling Minnis?
The streets with the most expensive properties for sale in Elham And Stelling Minnis are The Square at an average of £837,500, Longage Hill at an average of £830,000 and Canterbury Road at an average of £818,166.
What streets have the most affordable properties for sale in Elham And Stelling Minnis?
The streets with the most affordable properties for sale in Elham And Stelling Minnis are White Horse Lane at an average of £300,000, Station Mews at an average of £300,000 and Minnis Green at an average of £315,000.
Which train stations are available in or near Elham And Stelling Minnis?
Some of the train stations available in or near Elham And Stelling Minnis are Sandling, Westenhanger and Shepherd's Well.
Property Price Paid in Elham And Stelling Minnis by Year
The average sold property price by year was:
| Year | Average Sold Price | Price Change |
Sold Properties
|
|---|---|---|---|
| 2025 | £503,860 | -8% |
18 Properties |
| 2024 | £542,144 | -1% |
17 Properties |
| 2023 | £550,052 | -5% |
19 Properties |
| 2022 | £578,020 | 16% |
25 Properties |
| 2021 | £482,809 | -7% |
56 Properties |
| 2020 | £518,166 | 19% |
27 Properties |
| 2019 | £420,399 | -6% |
25 Properties |
| 2018 | £445,255 | 10% |
35 Properties |
| 2017 | £401,870 | -12% |
29 Properties |
| 2016 | £450,338 | 14% |
23 Properties |
| 2015 | £387,486 | 9% |
25 Properties |
| 2014 | £351,650 | -1% |
30 Properties |
| 2013 | £355,801 | 3% |
28 Properties |
| 2012 | £344,704 | 18% |
25 Properties |
| 2011 | £283,040 | -10% |
25 Properties |
| 2010 | £310,085 | 8% |
27 Properties |
| 2009 | £284,438 | 4% |
30 Properties |
| 2008 | £272,162 | -17% |
12 Properties |
| 2007 | £317,726 | -6% |
46 Properties |
| 2006 | £337,731 | 17% |
46 Properties |
| 2005 | £278,867 | -8% |
33 Properties |
| 2004 | £300,935 | 8% |
28 Properties |
| 2003 | £277,304 | 26% |
44 Properties |
| 2002 | £204,445 | 19% |
46 Properties |
| 2001 | £164,961 | -9% |
34 Properties |
| 2000 | £179,412 | 15% |
31 Properties |
| 1999 | £152,663 | 31% |
44 Properties |
| 1998 | £105,747 | -31% |
38 Properties |
| 1997 | £138,453 | 15% |
39 Properties |
| 1996 | £117,202 | 4% |
34 Properties |
| 1995 | £112,923 | - |
21 Properties |
Property Price per Property Type in Elham And Stelling Minnis
Here you can find historic sold price data in order to help with your property search.
The average Property Paid Price for specific property types in the last three years are:
| Property Type | Average Sold Price | Sold Properties |
|---|---|---|
| Semi Detached House | £453,719.00 | 11 Semi Detached Houses |
| Detached House | £618,810.00 | 29 Detached Houses |
| Terraced House | £414,324.00 | 14 Terraced Houses |

