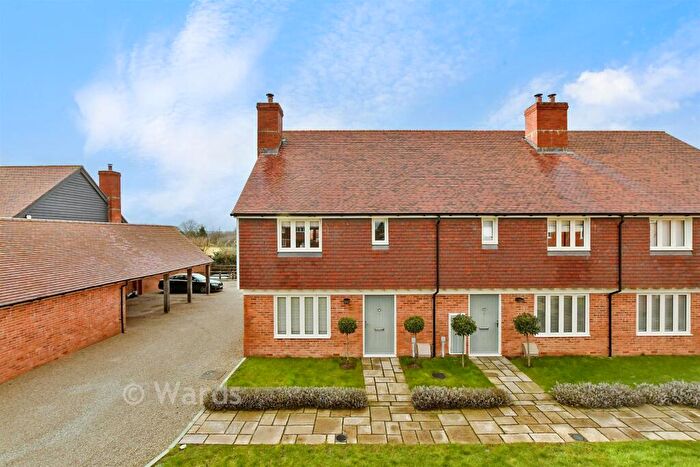
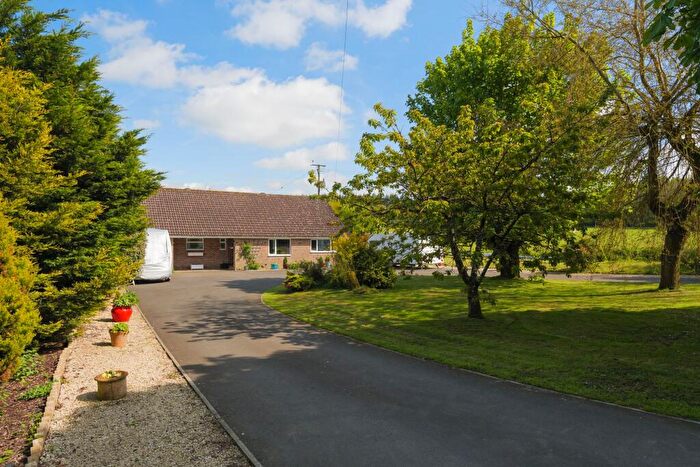
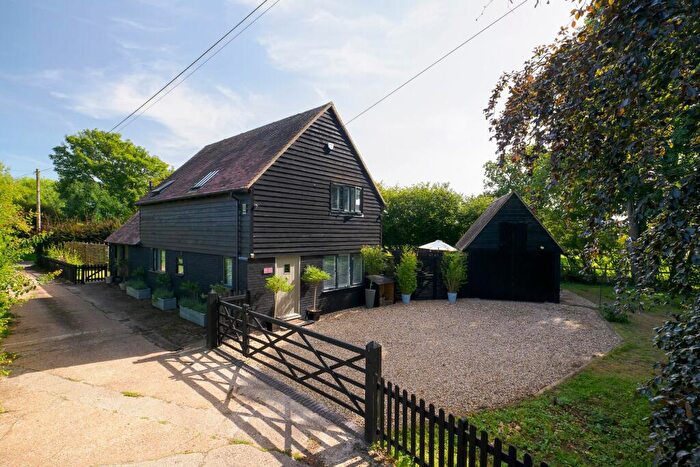
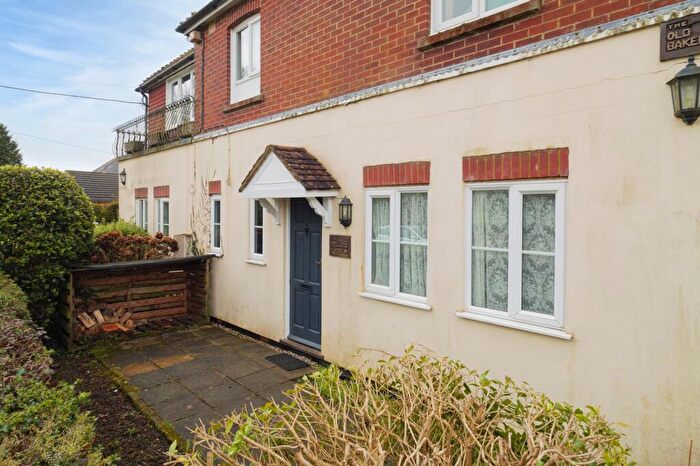
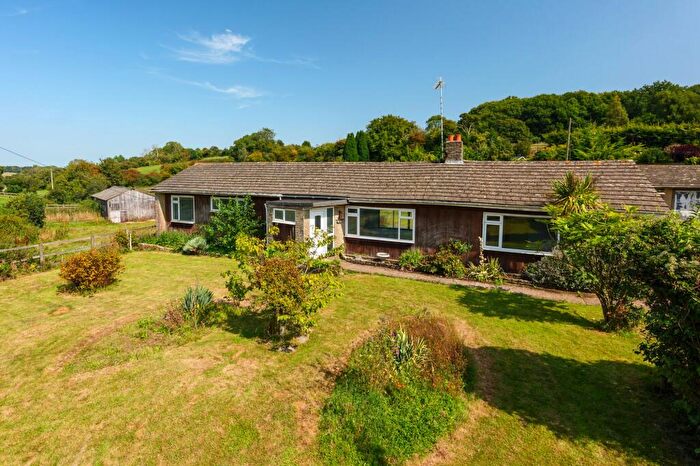
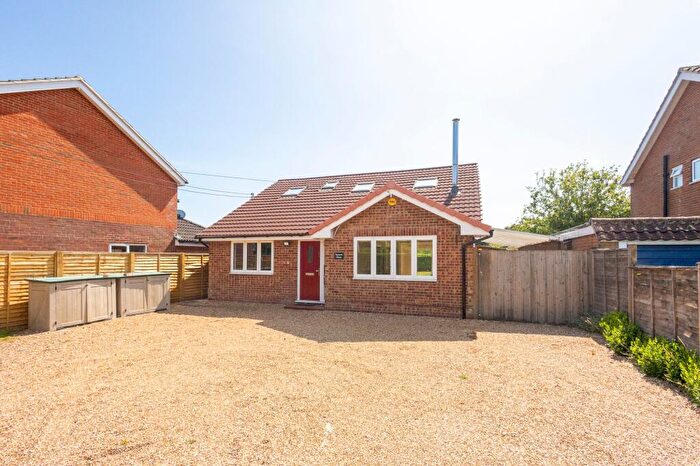
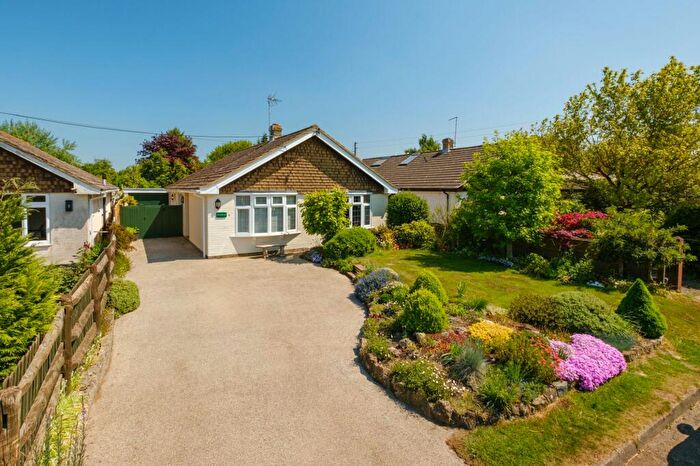
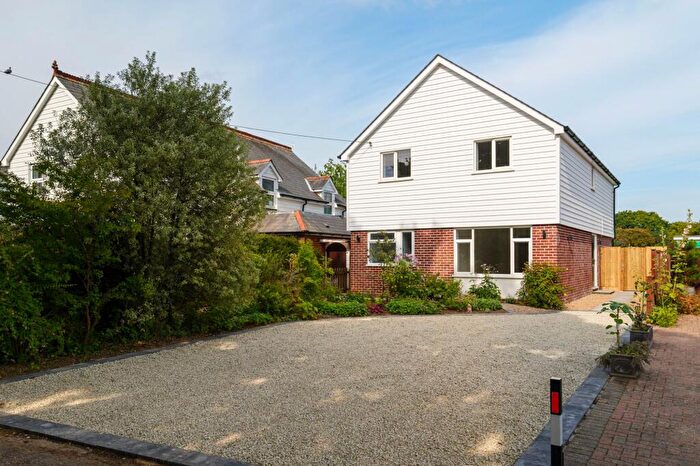
Houses for sale & to rent in North Downs West, Canterbury
House Prices in North Downs West
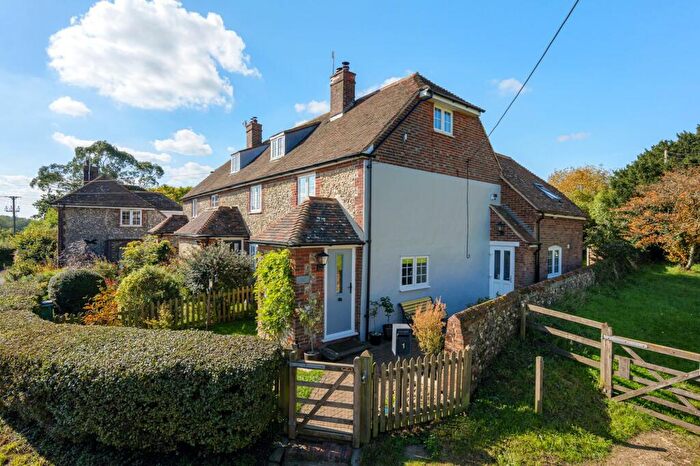
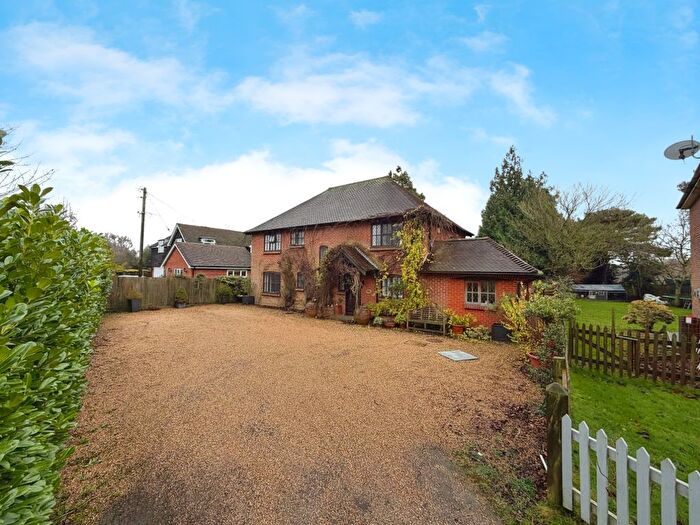
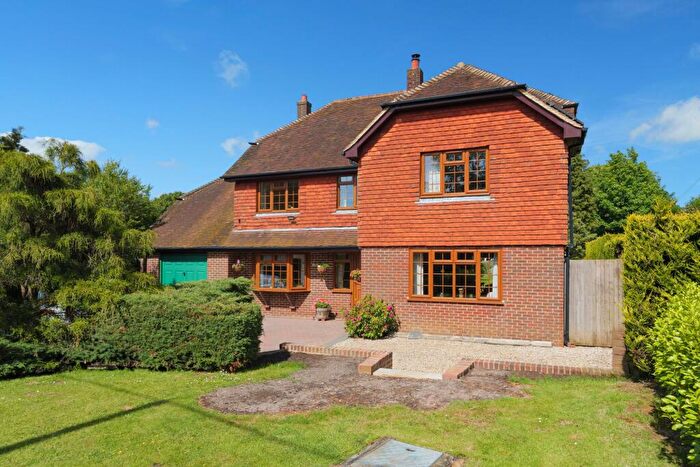
Properties in North Downs West have an average house price of £598,750.00 and had 4 Property Transactions within the last 3 years¹.
North Downs West is an area in Canterbury, Kent with 121 households², where the most expensive property was sold for £675,000.00.
Properties for sale in North Downs West
Roads and Postcodes in North Downs West
Navigate through our locations to find the location of your next house in North Downs West, Canterbury for sale or to rent.
| Streets | Postcodes |
|---|---|
| Green Lane | CT4 6XU |
| Kilndown Place | CT4 6FH CT4 6FJ |
| Lime Kiln Lane | CT4 5AQ CT4 5PF |
| Maxted Street | CT4 6DH CT4 6DG CT4 6DJ |
| Misling Lane | CT4 6DE |
| North Leigh | CT4 6BX |
| Peafield Wood | CT4 6BP |
| Rose Lane | CT4 6FF |
| Sandy Lane | CT4 6AP CT4 6DR CT4 6DS |
| Six Mile | CT4 6DP CT4 6DW |
| Split Lane | CT4 6BA CT4 6DT |
| Stone Street | CT4 6DA CT4 6DB CT4 6DD CT4 6DL CT4 6DN |
| Thorn Lane | CT4 6BY CT4 6BZ |
| CT4 6AN CT4 6XX CT4 6XY CT4 6YA CT4 6AL CT4 6BL CT4 6BN CT4 6EZ |
Transport near North Downs West
-
Westenhanger Station
-
Sandling Station
-
Wye Station
-
Chartham Station
-
Chilham Station
-
Bekesbourne Station
-
Folkestone West Station
-
Canterbury East Station
-
Snowdown Station
-
Shepherd's Well Station
- FAQ
- Price Paid By Year
- Property Type Price
Frequently asked questions about North Downs West
What is the average price for a property for sale in North Downs West?
The average price for a property for sale in North Downs West is £598,750. This amount is 59% higher than the average price in Canterbury. There are 439 property listings for sale in North Downs West.
Which train stations are available in or near North Downs West?
Some of the train stations available in or near North Downs West are Westenhanger, Sandling and Wye.
Property Price Paid in North Downs West by Year
The average sold property price by year was:
| Year | Average Sold Price | Price Change |
Sold Properties
|
|---|---|---|---|
| 2025 | £530,000 | -25% |
2 Properties |
| 2024 | £660,000 | -2% |
1 Property |
| 2023 | £675,000 | -29% |
1 Property |
| 2022 | £870,625 | 18% |
8 Properties |
| 2021 | £713,473 | 26% |
19 Properties |
| 2020 | £528,625 | 7% |
8 Properties |
| 2019 | £492,500 | 41% |
2 Properties |
| 2018 | £290,000 | -67% |
1 Property |
| 2017 | £485,000 | 34% |
2 Properties |
| 2016 | £322,500 | -27% |
1 Property |
| 2014 | £408,250 | 27% |
2 Properties |
| 2013 | £298,500 | -14% |
2 Properties |
| 2011 | £341,666 | -19% |
3 Properties |
| 2010 | £406,666 | 2% |
3 Properties |
| 2009 | £397,000 | -68% |
1 Property |
| 2008 | £665,000 | 39% |
2 Properties |
| 2007 | £407,500 | 29% |
2 Properties |
| 2006 | £289,666 | -81% |
6 Properties |
| 2005 | £525,000 | 5% |
1 Property |
| 2004 | £496,500 | 22% |
2 Properties |
| 2003 | £385,500 | 26% |
5 Properties |
| 2002 | £283,500 | 54% |
4 Properties |
| 2000 | £131,666 | 10% |
3 Properties |
| 1999 | £119,000 | 54% |
2 Properties |
| 1998 | £55,000 | -176% |
2 Properties |
| 1997 | £152,000 | 34% |
6 Properties |
| 1996 | £99,750 | -86% |
2 Properties |
| 1995 | £185,500 | - |
2 Properties |
Property Price per Property Type in North Downs West
Here you can find historic sold price data in order to help with your property search.
The average Property Paid Price for specific property types in the last three years are:
| Property Type | Average Sold Price | Sold Properties |
|---|---|---|
| Detached House | £648,333.00 | 3 Detached Houses |
| Semi Detached House | £450,000.00 | 1 Semi Detached House |

