
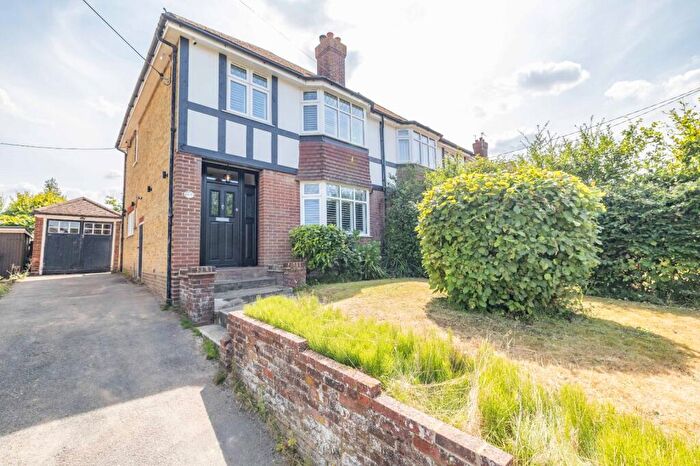
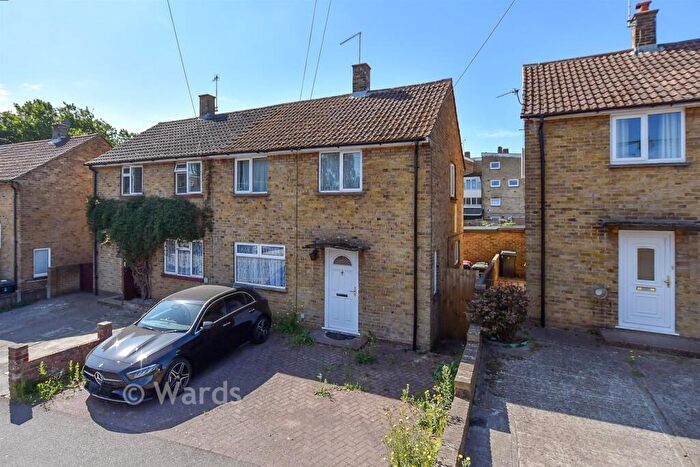
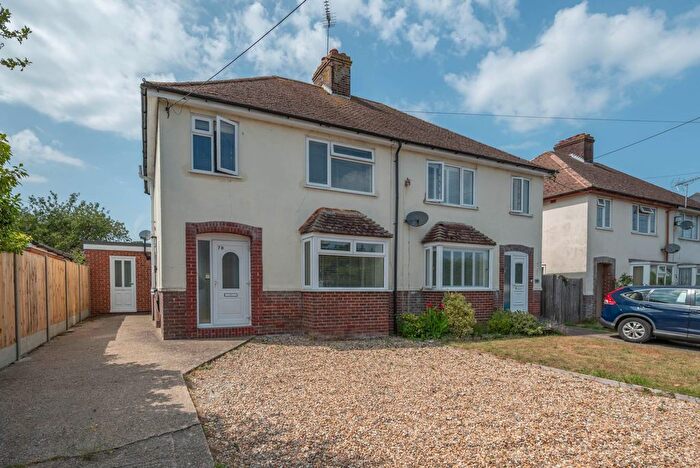
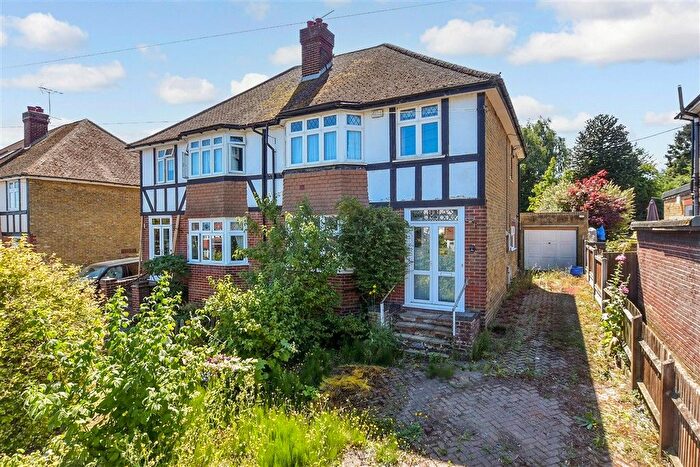
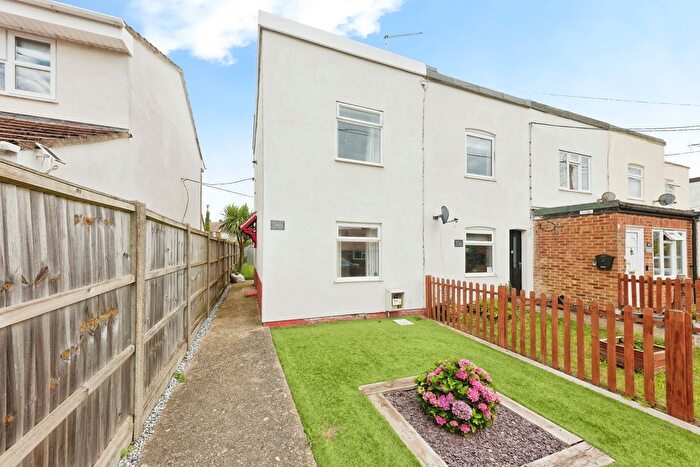
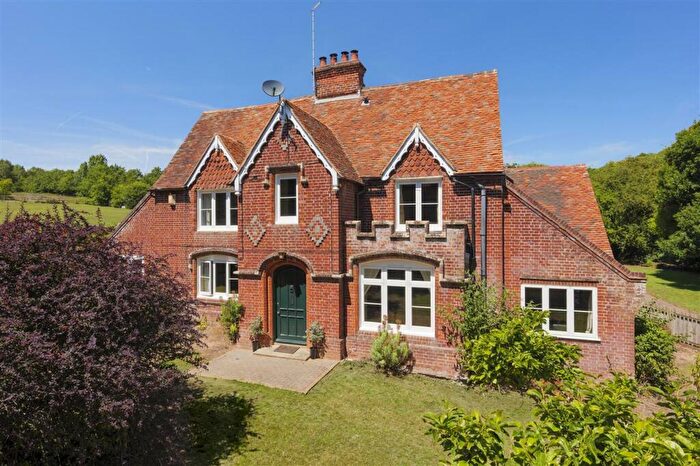
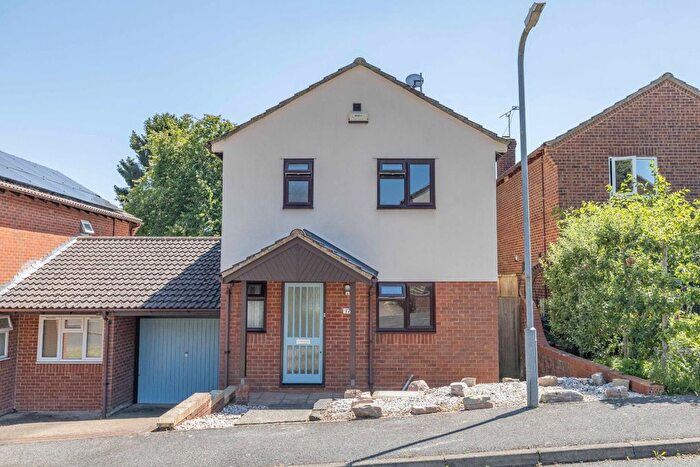
Houses for sale in Harbledown, Canterbury
House Prices in Harbledown
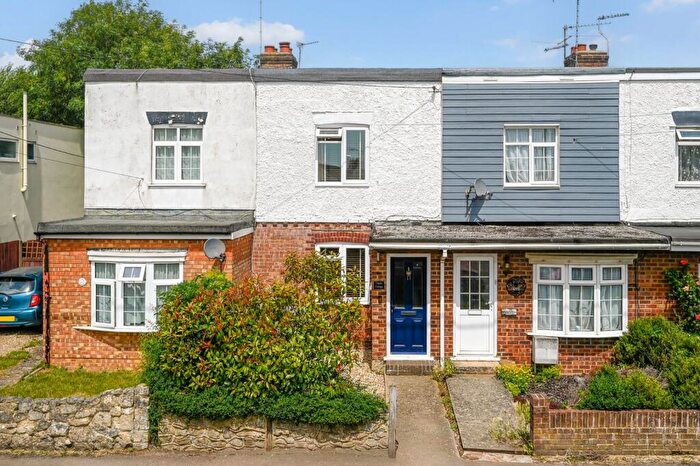
Properties in Harbledown have an average house price of £423k and had 77 Property Transactions within the last 3 years¹.
Harbledown is an area in Canterbury, Kent with 958 households², where the most expensive property was sold for £1.06M.
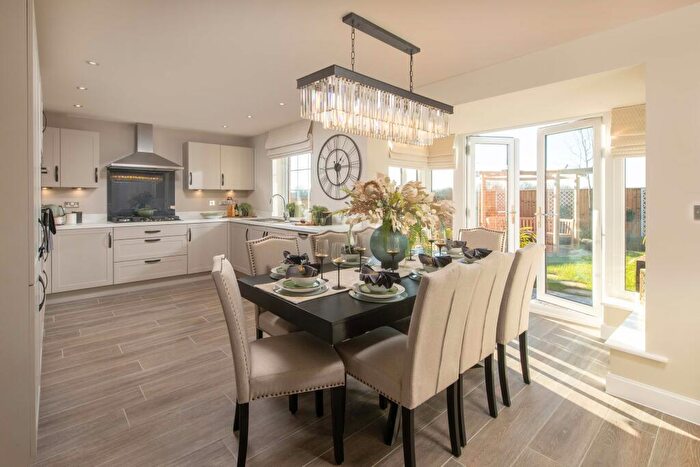
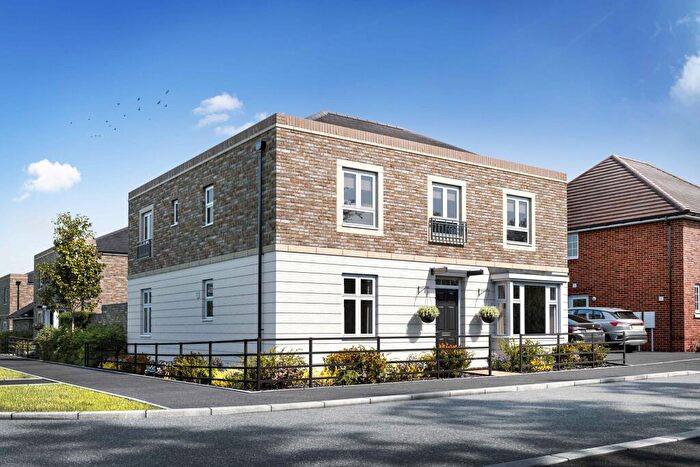
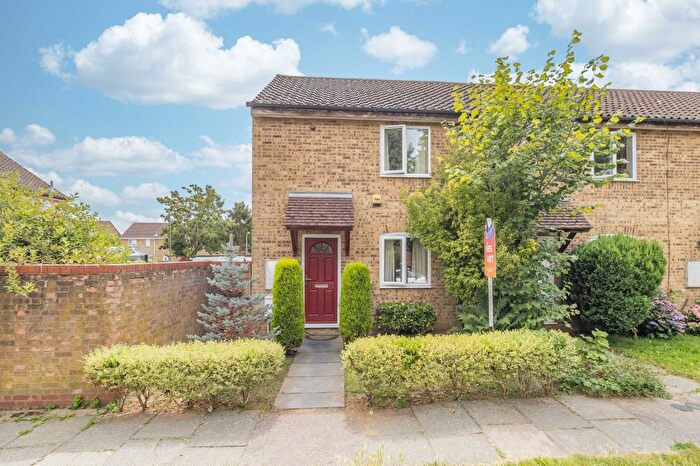
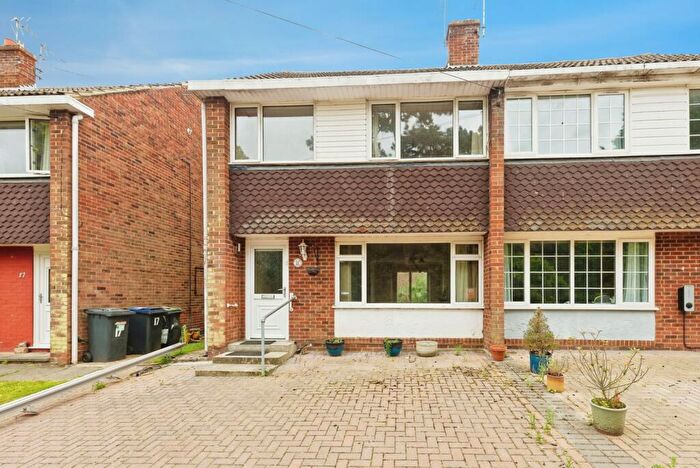
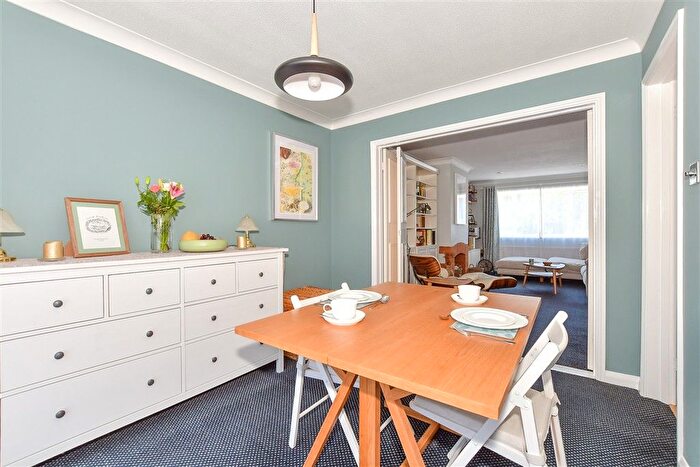
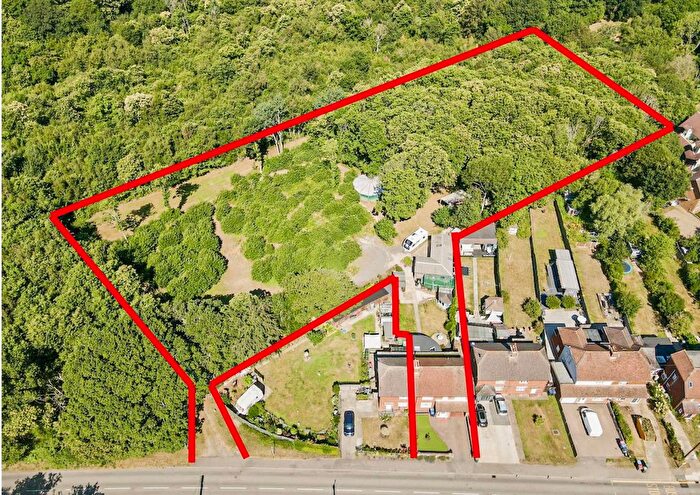
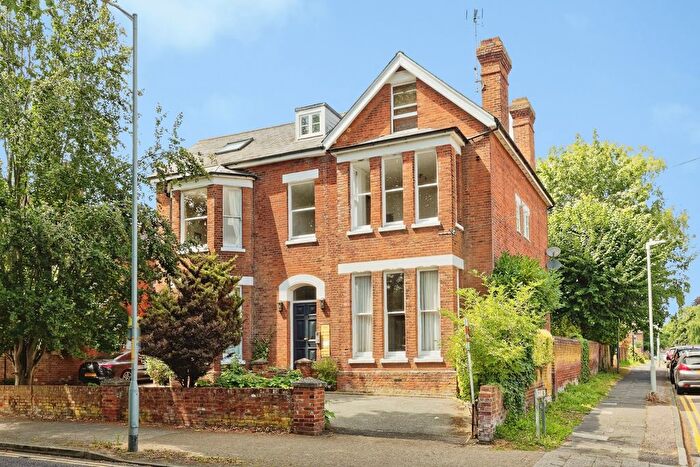
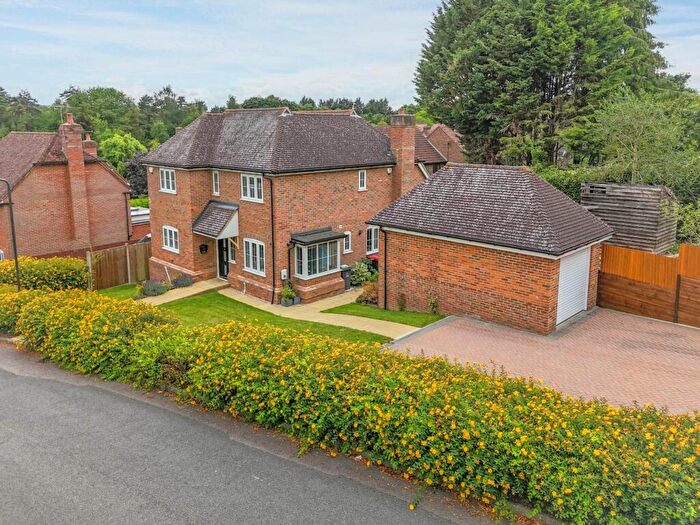
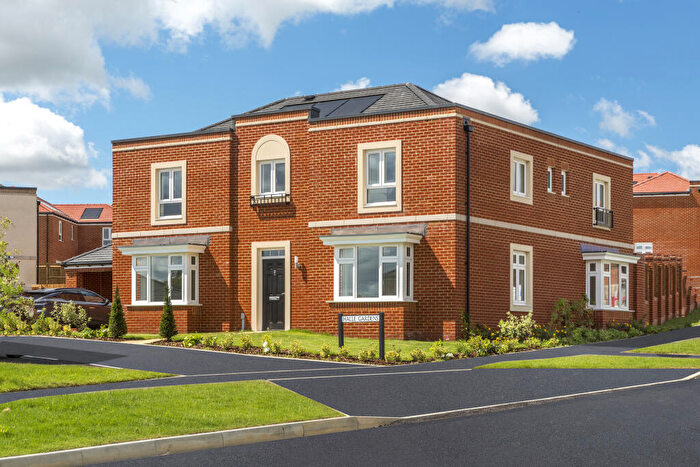
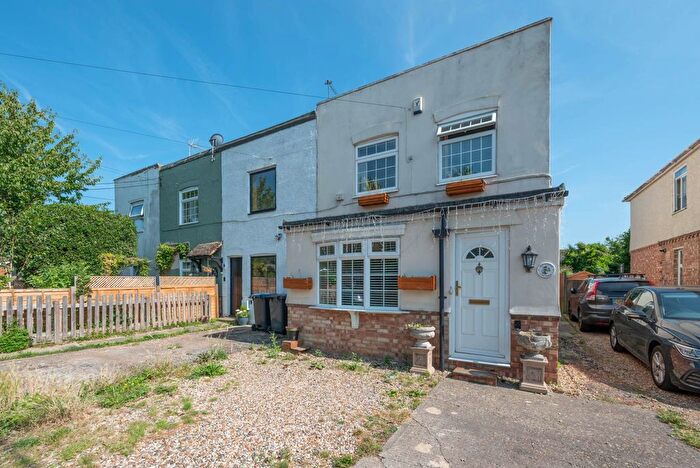
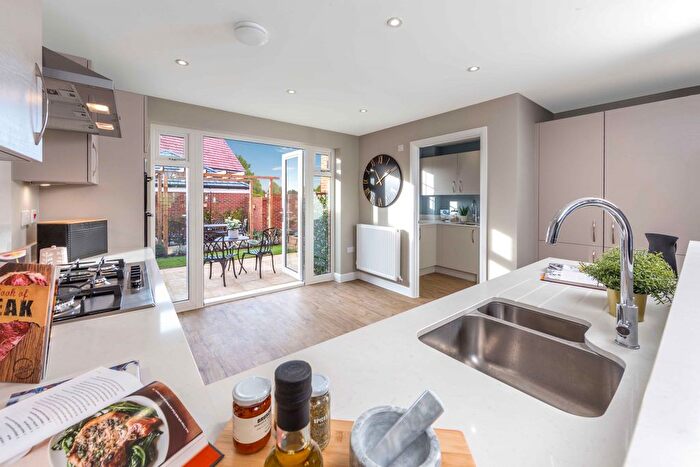
Properties for sale in Harbledown
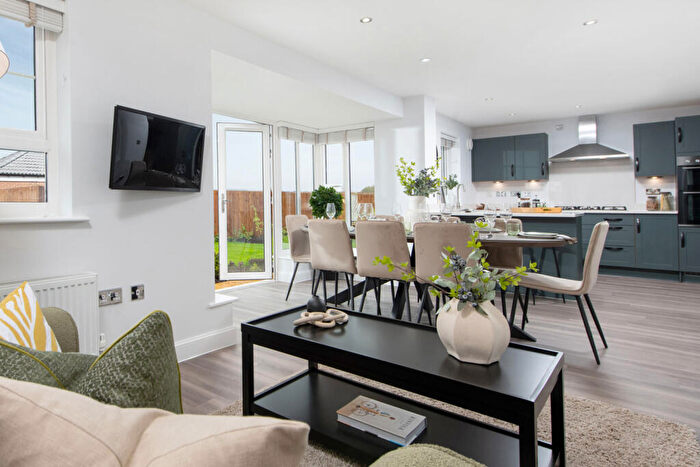
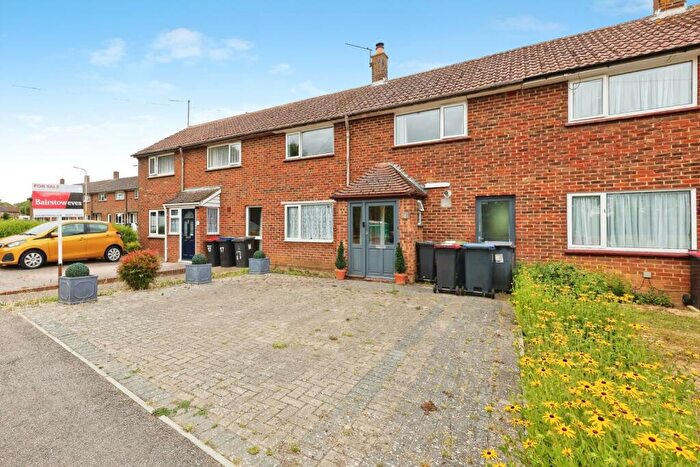
![]()
If you are looking to sell your house, let it out, or receive a property valuation, an expert can help you.
Click the button below to get started.


Roads and Postcodes in Harbledown
Navigate through our locations to find the location of your next house in Harbledown, Canterbury for sale or to rent.
| Streets | Postcodes |
|---|---|
| Ashford Road | CT4 7PF |
| Bigbury | CT2 9BJ |
| Bigbury Road | CT4 7ND CT4 7NE |
| Boundary Cottages | CT2 9AZ |
| Chaucer Mews | CT2 9BF |
| Church Hill | CT2 9AE CT2 9AH |
| Church Wood Close | CT2 9BT |
| Denstead Lane | CT4 7NL |
| Denstead Oast | CT4 7SH |
| Firtree Close | CT2 9DB |
| Garden Close | CT2 9BP |
| Glemsford Cottages | CT2 9AW |
| Gravel Hill | CT4 7NH |
| Harbledown Park | CT2 8NR |
| Harbledown Terrace | CT2 9AB |
| Hatch Lane | CT4 7LP CT4 7LS CT4 7LW |
| Highfield Close | CT2 9DX |
| Howfield Lane | CT4 7LX CT4 7LZ CT4 7NA |
| Keepers Croft | CT2 9AF |
| Lanfranc Gardens | CT2 8NJ |
| Little Meadow | CT2 9BD |
| Lovell Road | CT2 9DG |
| Maple Close | CT2 9BX |
| Mill Lane | CT2 8NF CT2 8NQ |
| Neals Place Road | CT2 8HX |
| New Cottages | CT2 9AT |
| New Town Street | CT4 7LT |
| Nightingale Close | CT4 7NB |
| Oaks Park | CT2 9DP |
| Palmars Cross Hill | CT2 9BL |
| Pilgrims Way | CT4 7LR |
| Plough Lane | CT2 9AR CT2 9AS |
| Primrose Hill | CT4 7NP |
| Primrose Villas | CT4 7LU |
| Ravenscourt Road | CT2 9DH |
| Ross Gardens | CT2 9BY CT2 9BZ |
| Rough Common Road | CT2 9BS CT2 9BU CT2 9BW CT2 9DA CT2 9DE CT2 9DJ CT2 9DL CT2 9DQ |
| Sidney Cooper Close | CT2 9BQ |
| St Michaels Close | CT2 9BN |
| Stockwood Chase | CT2 9BG |
| Summer Hill | CT2 8ND CT2 8NH CT2 8NN CT2 8NP |
| The Green | CT2 9BB |
| The Mint | CT2 9AA |
| Town Lane | CT4 7NN |
| CT2 9AL CT2 9AN CT2 9AX CT4 7PE |
Property price trends in Harbledown
According to the latest Land Registry data, the average home in Harbledown sold for £454,100 in 2025. That figure comes from 1,136 sales logged over the past 30 years.
Prices have softened over the last three years. Compared with 2022, when the typical sale came in around £465,621, that's a fall of roughly 2.5%.
Looking back five years, average prices are up about 16% since 2020, a gain of around £62,538 in cash terms.
Zoom out to the past decade for the fuller picture. Back in 2015, homes here averaged £317,698, so the typical sold price has climbed about 42.9% since then, roughly 3.6% a year. Stretch the view to fifteen years and that annual pace holds at about 3.6%.
Frequently asked questions about Harbledown
What is the average price for a property for sale in Harbledown?
The average price for a property for sale in Harbledown is £423,459. This amount is 13% higher than the average price in Canterbury. There are 1,132 property listings for sale in Harbledown.
What streets have the most expensive properties for sale in Harbledown?
The streets with the most expensive properties for sale in Harbledown are Harbledown Park at an average of £795,000, Hatch Lane at an average of £786,666 and Oaks Park at an average of £775,000.
What streets have the most affordable properties for sale in Harbledown?
The streets with the most affordable properties for sale in Harbledown are Howfield Lane at an average of £140,000, Stockwood Chase at an average of £232,950 and New Cottages at an average of £237,500.
Which train stations are available in or near Harbledown?
Some of the train stations available in or near Harbledown are Canterbury West, Canterbury East and Chartham.
Property Price Paid in Harbledown by Year
The average sold property price by year was:
| Year | Average Sold Price | Price Change |
Sold Properties
|
|---|---|---|---|
| 2025 | £454,100 | 12% |
25 Properties |
| 2024 | £398,913 | -6% |
30 Properties |
| 2023 | £422,113 | -10% |
22 Properties |
| 2022 | £465,621 | 13% |
44 Properties |
| 2021 | £406,277 | 4% |
36 Properties |
| 2020 | £391,562 | 14% |
24 Properties |
| 2019 | £338,682 | -6% |
37 Properties |
| 2018 | £358,250 | -13% |
26 Properties |
| 2017 | £405,172 | 5% |
34 Properties |
| 2016 | £385,446 | 18% |
33 Properties |
Property Price per Property Type in Harbledown
Here you can find historic sold price data in order to help with your property search.
The average Property Paid Price for specific property types in the last three years are:
| Property Type | Average Sold Price | Sold Properties |
|---|---|---|
| Semi Detached House | £382,790.00 | 31 Semi Detached Houses |
| Detached House | £555,833.00 | 24 Detached Houses |
| Terraced House | £368,617.00 | 17 Terraced Houses |
| Flat | £226,680.00 | 5 Flats |
