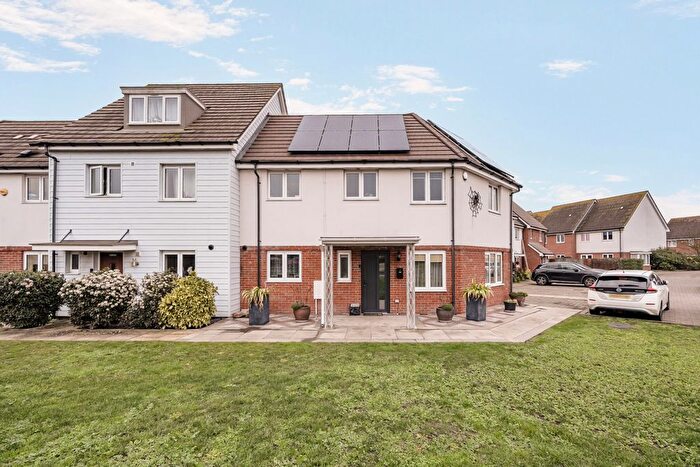
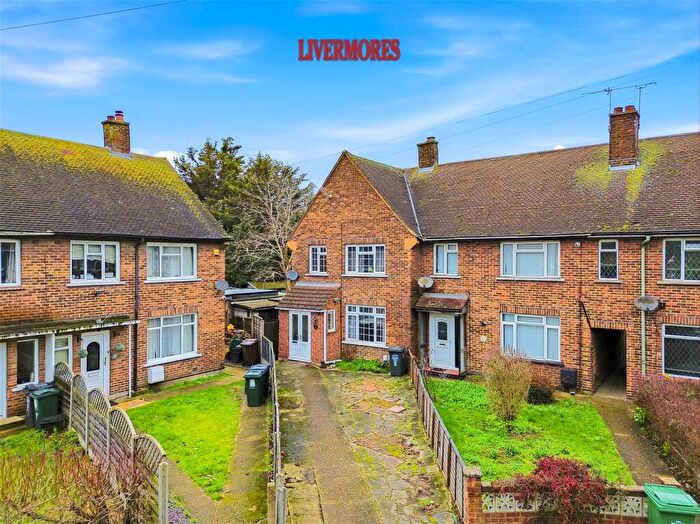
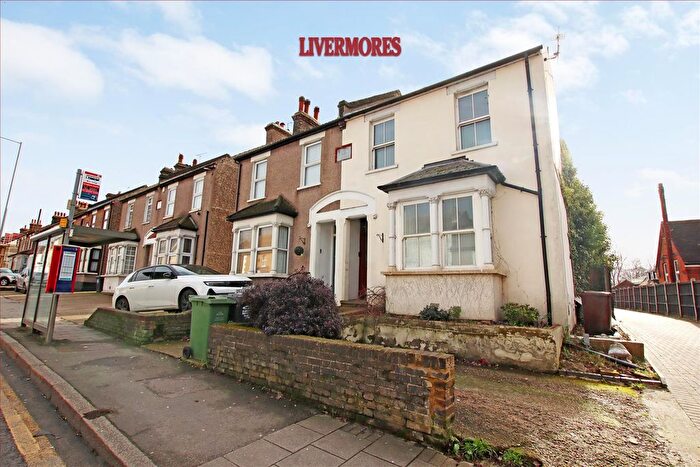
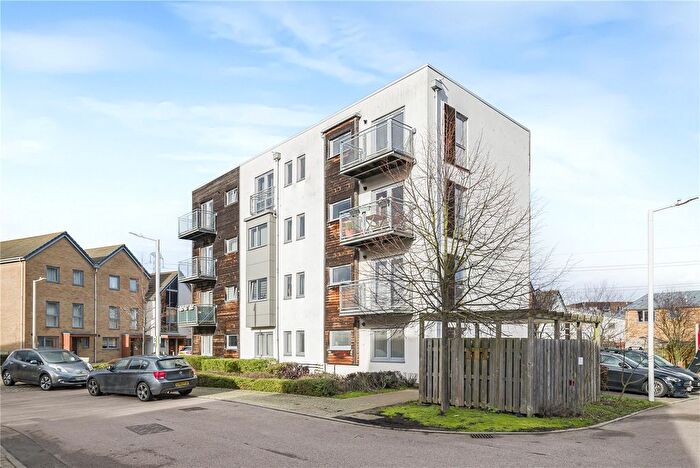
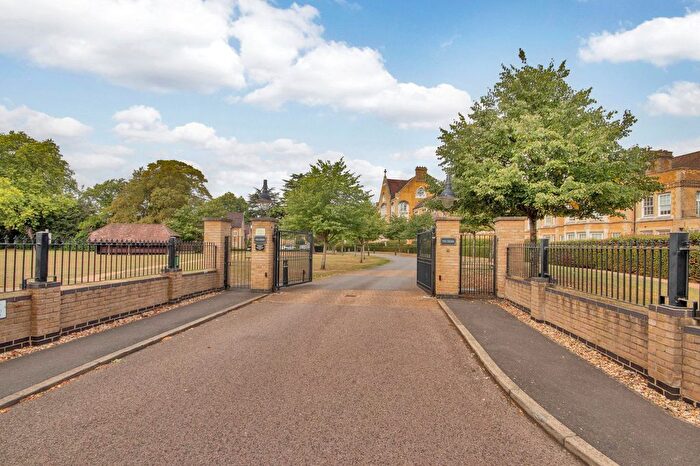
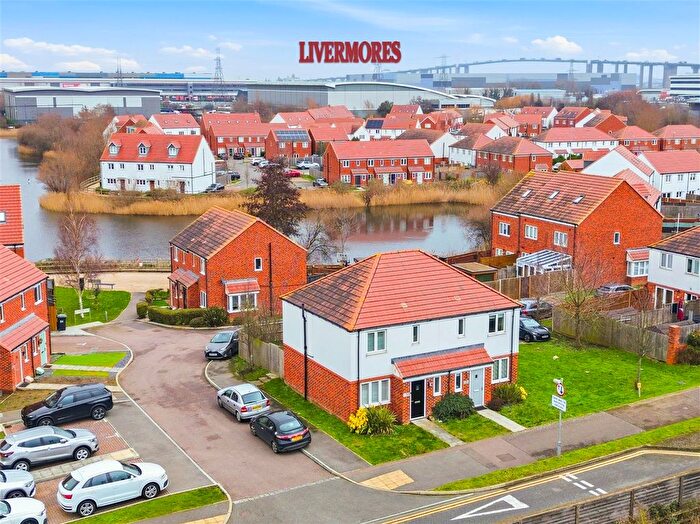
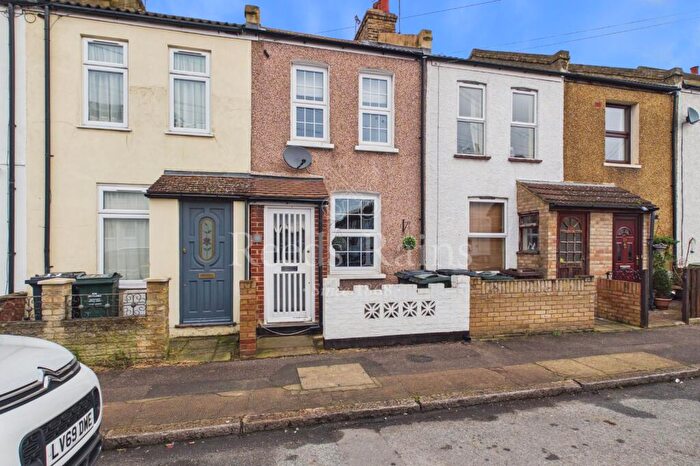
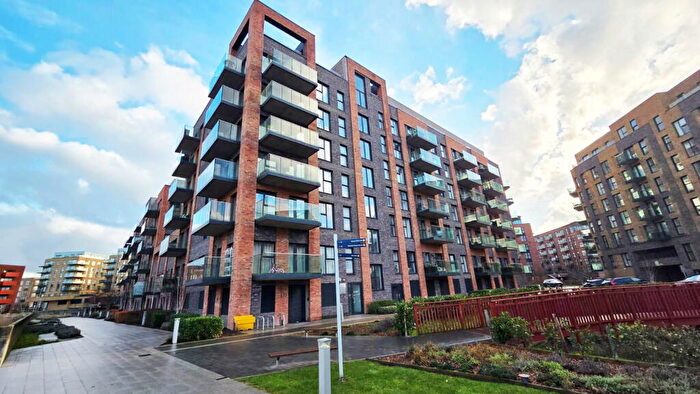
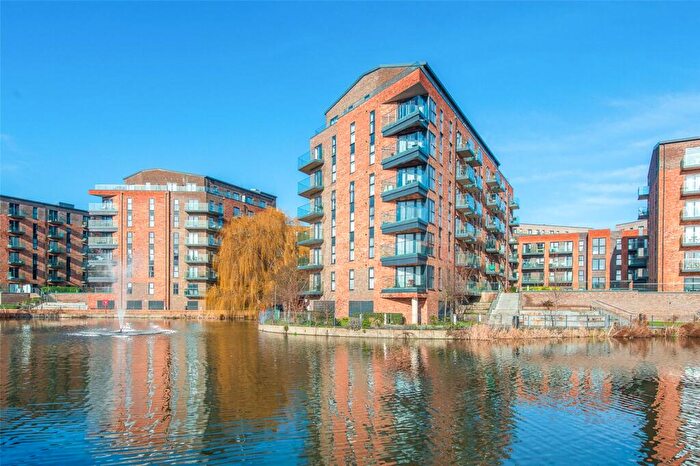
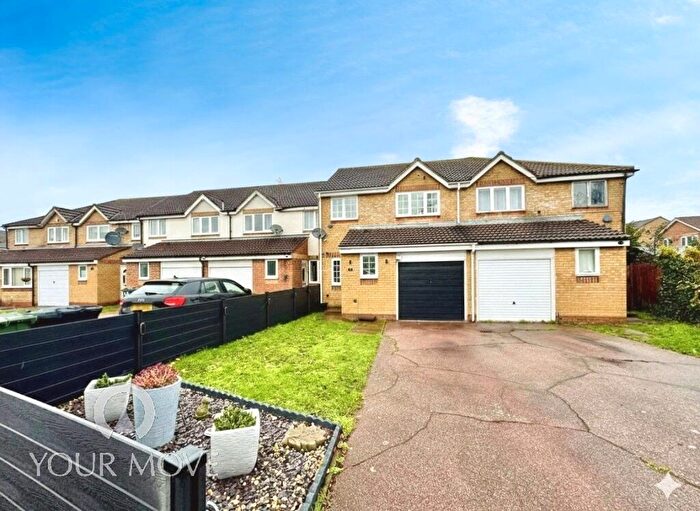
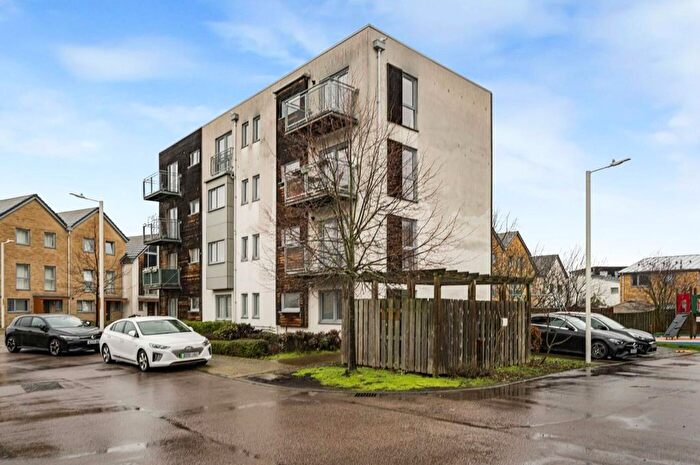
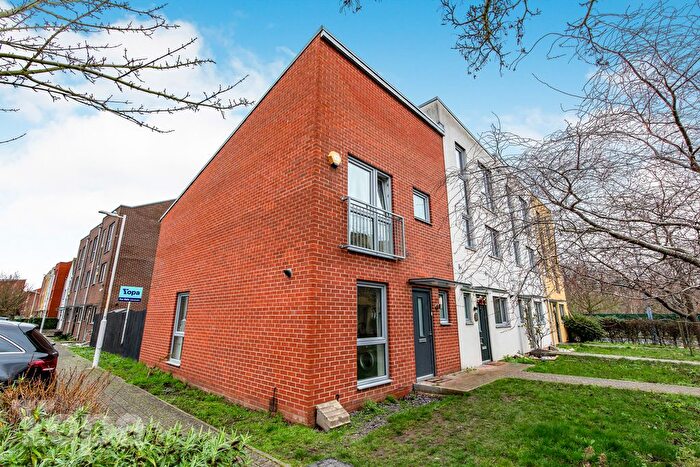
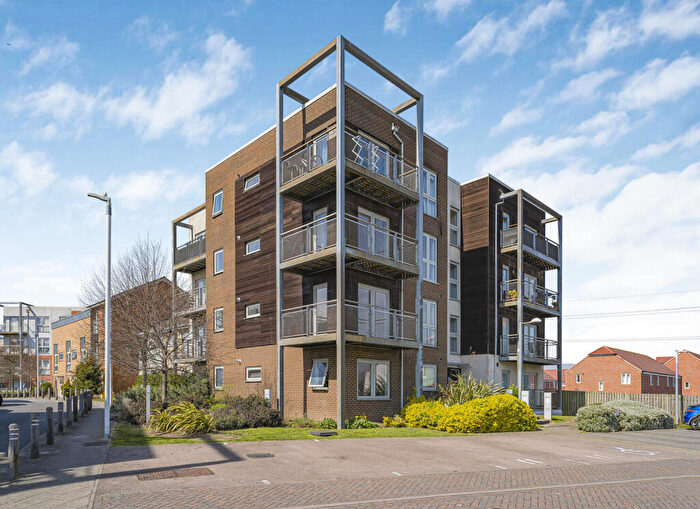
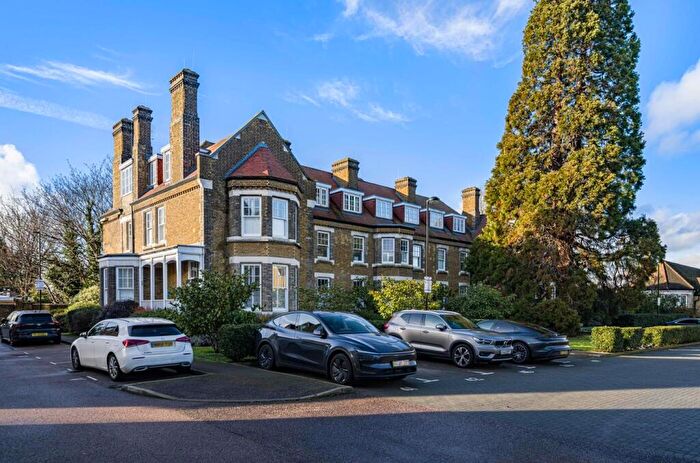
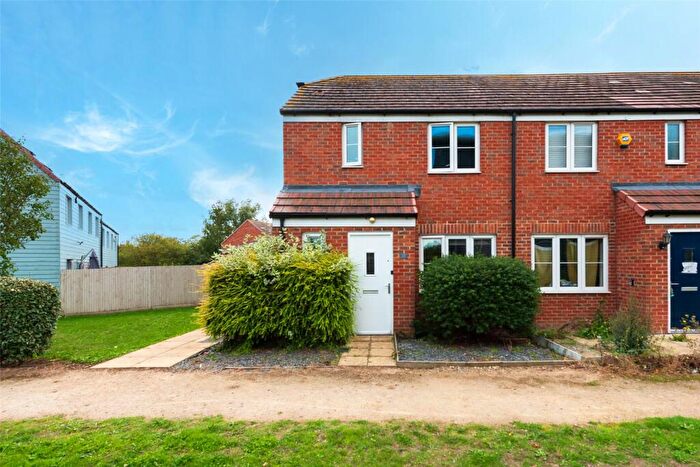
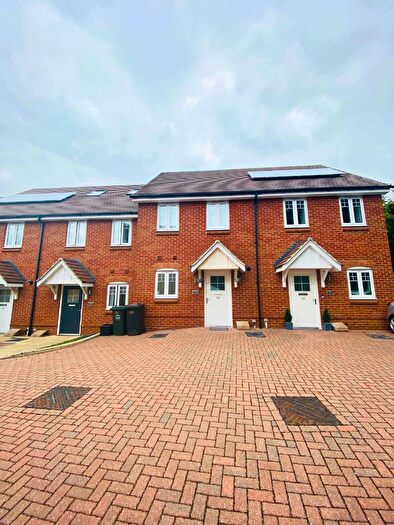
Houses for sale & to rent in Littlebrook, Dartford
House Prices in Littlebrook
Properties in Littlebrook have an average house price of £310,729.00 and had 138 Property Transactions within the last 3 years¹.
Littlebrook is an area in Dartford, Kent with 1,790 households², where the most expensive property was sold for £550,000.00.
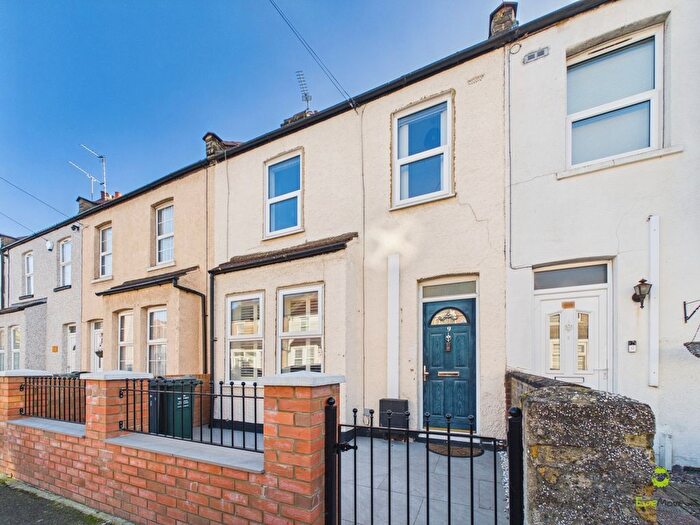
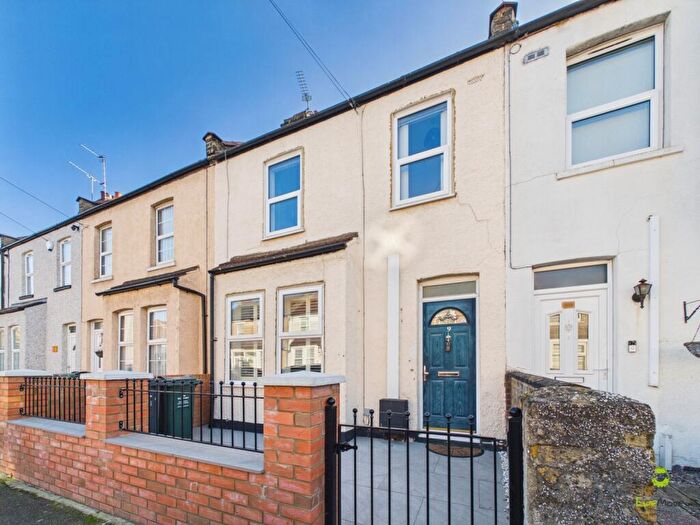
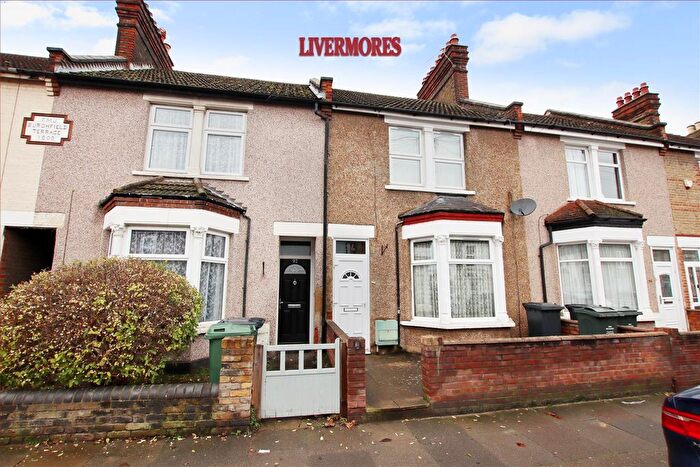
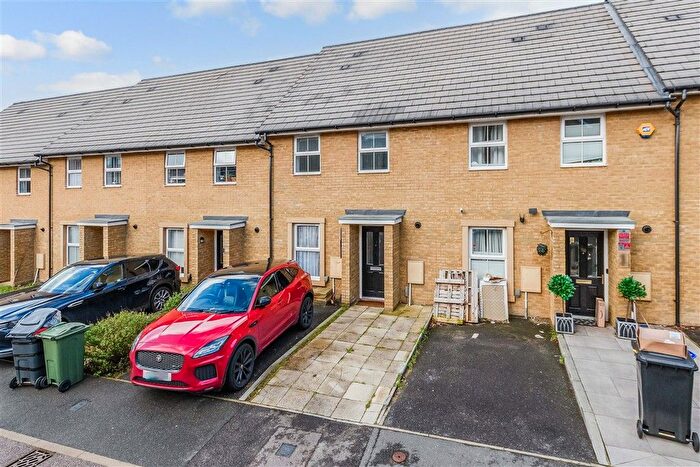
Properties for sale in Littlebrook
Roads and Postcodes in Littlebrook
Navigate through our locations to find the location of your next house in Littlebrook, Dartford for sale or to rent.
| Streets | Postcodes |
|---|---|
| Attlee Drive | DA1 5DE DA1 5DF DA1 5DN DA1 5DW DA1 5DY DA1 5DZ |
| Bridges Drive | DA1 5DR |
| Buttermere Close | DA1 5SY |
| Byron Road | DA1 5NT |
| Cavell Crescent | DA1 5NS |
| Claremont Place | DA1 5TE |
| Coleridge Road | DA1 5NR |
| Dickens Avenue | DA1 5NL |
| Dorney Place | DA1 5RT |
| Dunkin Road | DA1 5NJ |
| Eliot Road | DA1 5DP |
| Ellingham View | DA1 5SZ |
| Falcon Close | DA1 5SA |
| Farnol Road | DA1 5DT DA1 5NA DA1 5NG DA1 5NQ |
| Hardy Grove | DA1 5NU |
| Henderson Drive | DA1 5JY DA1 5JZ DA1 5LA DA1 5LB DA1 5LE DA1 5LF |
| Herald Walk | DA1 5SS DA1 5ST |
| Kingsley Avenue | DA1 5DH |
| Kipling Road | DA1 5DS |
| Knights Manor Way | DA1 5SB DA1 5SD DA1 5SH DA1 5SJ DA1 5SL DA1 5SP DA1 5SR |
| Lansbury Crescent | DA1 5DG DA1 5DQ |
| Littlebrook Manorway | DA1 5DU DA1 5DX DA1 5EA DA1 5EB DA1 5EE DA1 5EF |
| Lockwood Place | DA1 5TD |
| Mallard Close | DA1 5SU |
| Marsh Street | DA1 5JX |
| Masefield Road | DA1 5DL |
| Meldon View | DA1 5SX |
| Morris Gardens | DA1 5DB |
| Norfolk Close | DA1 5PD |
| Perry Grove | DA1 5NH |
| Pilgrims Court | DA1 5LZ |
| Ruskin Grove | DA1 5DD |
| Shaftesbury Lane | DA1 5NP |
| Shakespeare Road | DA1 5NN DA1 5NW |
| St Vincents Avenue | DA1 5DA |
| St Vincents Villas | DA1 5HT |
| Tennyson Road | DA1 5DJ |
| Virginia Court | DA1 5TA |
| Wordsworth Way | DA1 5NY DA1 5NZ |
Transport near Littlebrook
-
Dartford Station
-
Stone Crossing Station
-
Purfleet Station
-
Greenhithe Station
-
Slade Green Station
-
Crayford Station
- FAQ
- Price Paid By Year
- Property Type Price
Frequently asked questions about Littlebrook
What is the average price for a property for sale in Littlebrook?
The average price for a property for sale in Littlebrook is £310,729. This amount is 19% lower than the average price in Dartford. There are 2,060 property listings for sale in Littlebrook.
What streets have the most expensive properties for sale in Littlebrook?
The streets with the most expensive properties for sale in Littlebrook are St Vincents Avenue at an average of £423,500, Henderson Drive at an average of £408,642 and Perry Grove at an average of £405,000.
What streets have the most affordable properties for sale in Littlebrook?
The streets with the most affordable properties for sale in Littlebrook are Pilgrims Court at an average of £185,000, Shakespeare Road at an average of £188,333 and Falcon Close at an average of £222,666.
Which train stations are available in or near Littlebrook?
Some of the train stations available in or near Littlebrook are Dartford, Stone Crossing and Purfleet.
Property Price Paid in Littlebrook by Year
The average sold property price by year was:
| Year | Average Sold Price | Price Change |
Sold Properties
|
|---|---|---|---|
| 2025 | £317,703 | 4% |
27 Properties |
| 2024 | £304,293 | -3% |
58 Properties |
| 2023 | £314,219 | 8% |
53 Properties |
| 2022 | £290,563 | 2% |
57 Properties |
| 2021 | £283,714 | 3% |
65 Properties |
| 2020 | £275,613 | 8% |
52 Properties |
| 2019 | £254,227 | -1% |
59 Properties |
| 2018 | £256,200 | -1% |
53 Properties |
| 2017 | £257,552 | 14% |
68 Properties |
| 2016 | £222,317 | -4% |
61 Properties |
| 2015 | £230,943 | 19% |
98 Properties |
| 2014 | £187,036 | 2% |
76 Properties |
| 2013 | £183,327 | 17% |
109 Properties |
| 2012 | £152,427 | 6% |
36 Properties |
| 2011 | £143,720 | 0,1% |
42 Properties |
| 2010 | £143,564 | 0,4% |
31 Properties |
| 2009 | £142,967 | -12% |
32 Properties |
| 2008 | £160,258 | 3% |
50 Properties |
| 2007 | £155,406 | 7% |
92 Properties |
| 2006 | £144,587 | 12% |
92 Properties |
| 2005 | £127,505 | 4% |
87 Properties |
| 2004 | £122,043 | 5% |
101 Properties |
| 2003 | £116,428 | 17% |
103 Properties |
| 2002 | £97,045 | 23% |
112 Properties |
| 2001 | £74,937 | 16% |
96 Properties |
| 2000 | £62,836 | 11% |
84 Properties |
| 1999 | £55,856 | 5% |
91 Properties |
| 1998 | £52,962 | 8% |
71 Properties |
| 1997 | £48,582 | 8% |
96 Properties |
| 1996 | £44,598 | -1% |
45 Properties |
| 1995 | £45,152 | - |
55 Properties |
Property Price per Property Type in Littlebrook
Here you can find historic sold price data in order to help with your property search.
The average Property Paid Price for specific property types in the last three years are:
| Property Type | Average Sold Price | Sold Properties |
|---|---|---|
| Semi Detached House | £359,467.00 | 31 Semi Detached Houses |
| Detached House | £322,000.00 | 1 Detached House |
| Terraced House | £340,176.00 | 80 Terraced Houses |
| Flat | £161,576.00 | 26 Flats |

