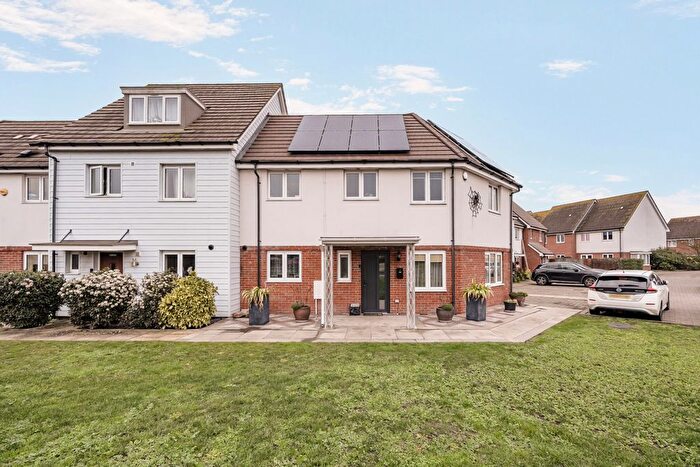
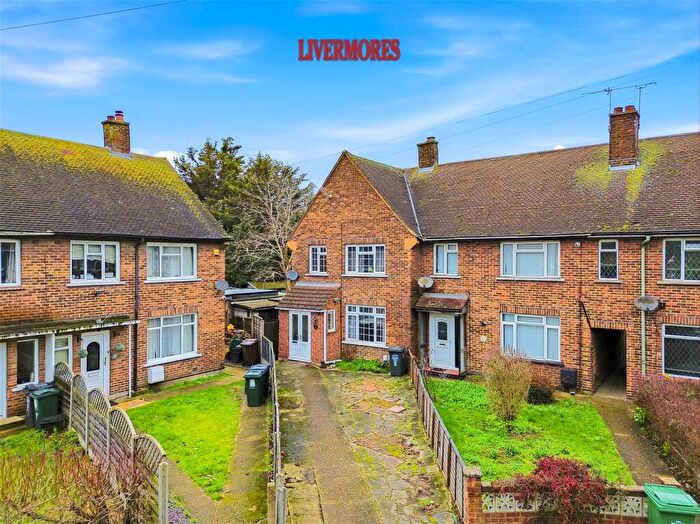
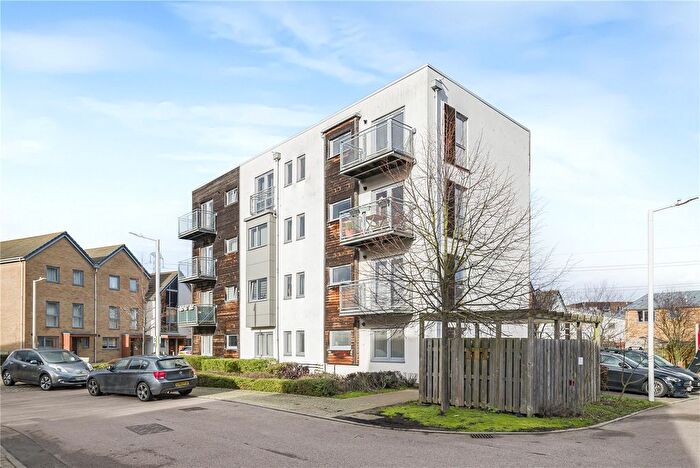
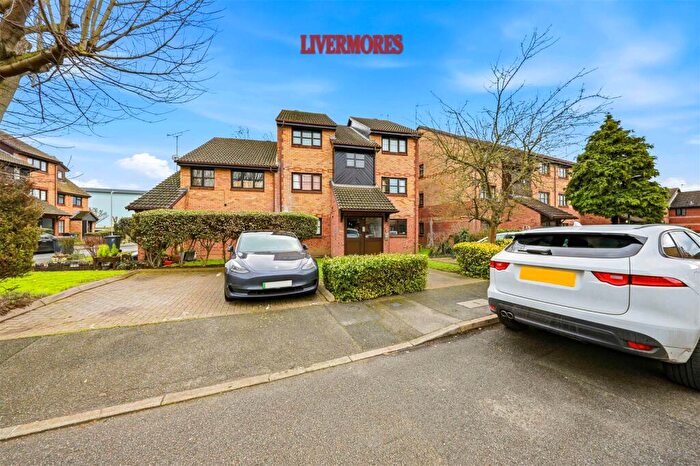
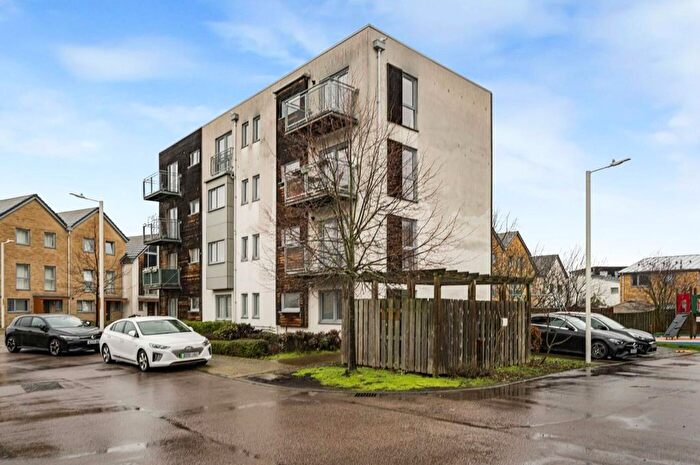
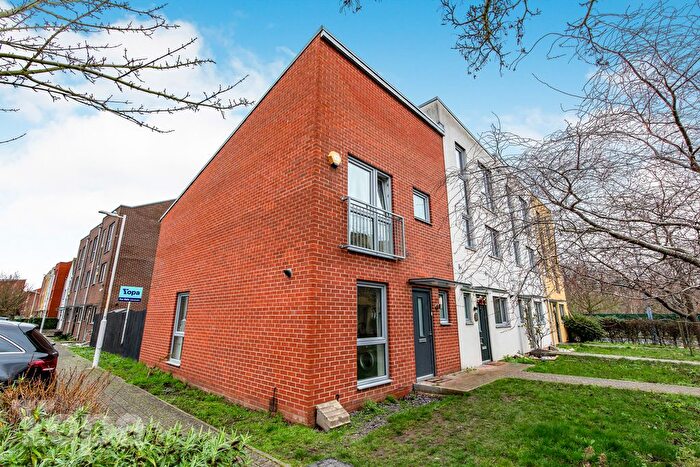
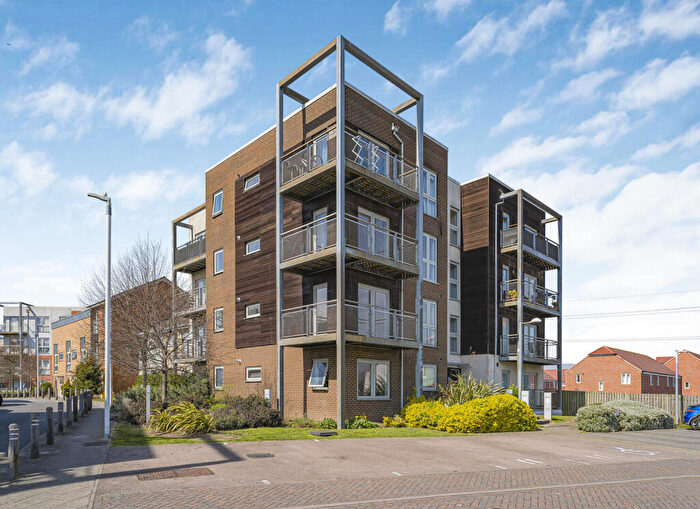
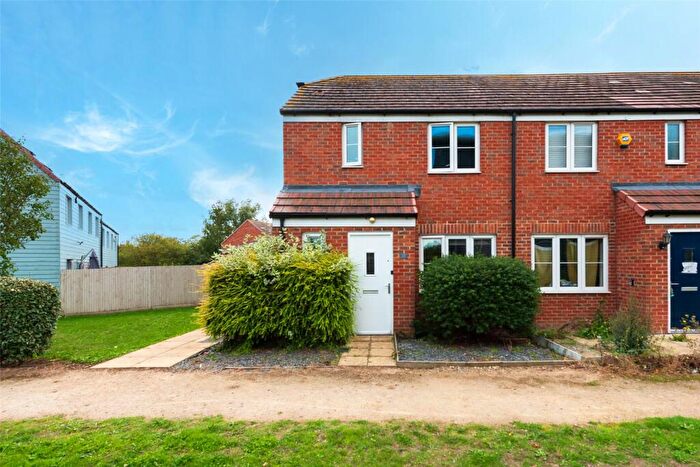
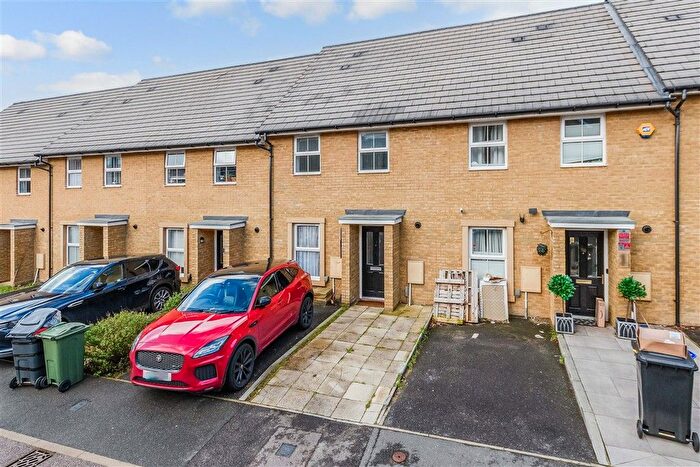
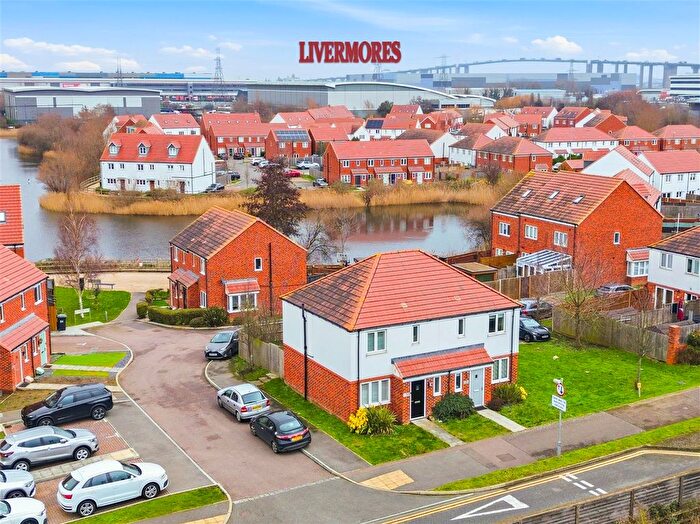
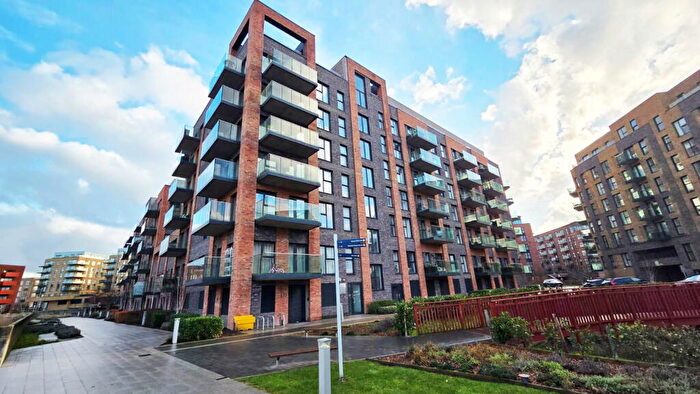
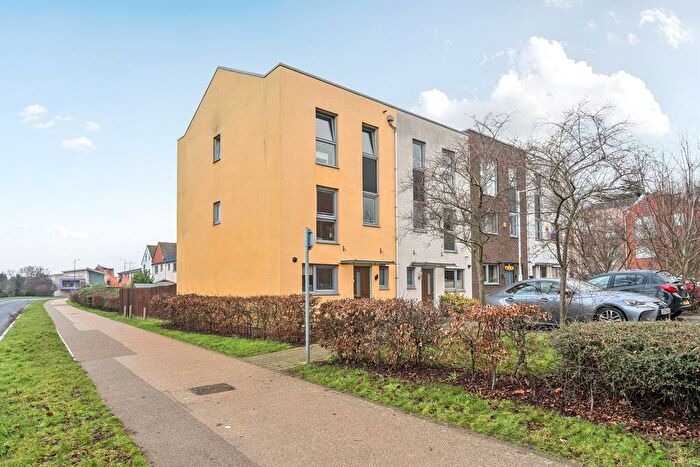
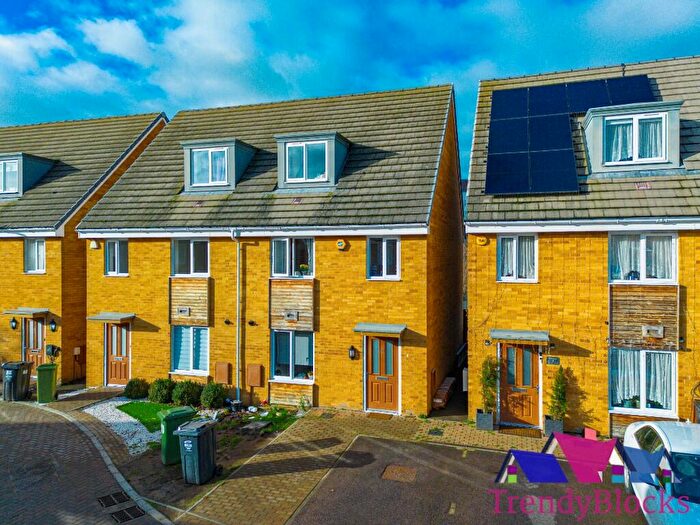
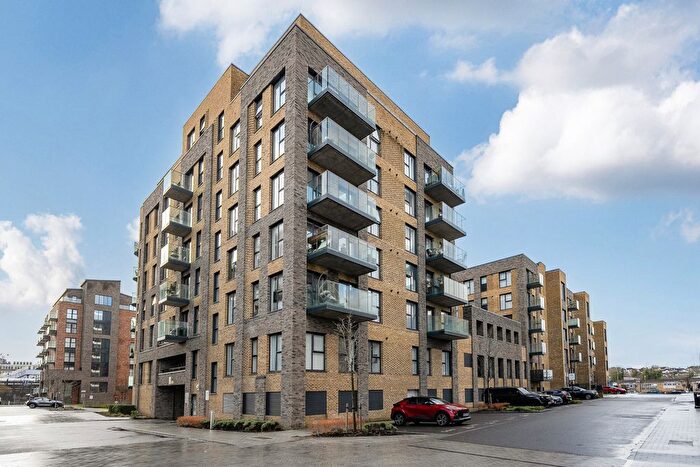
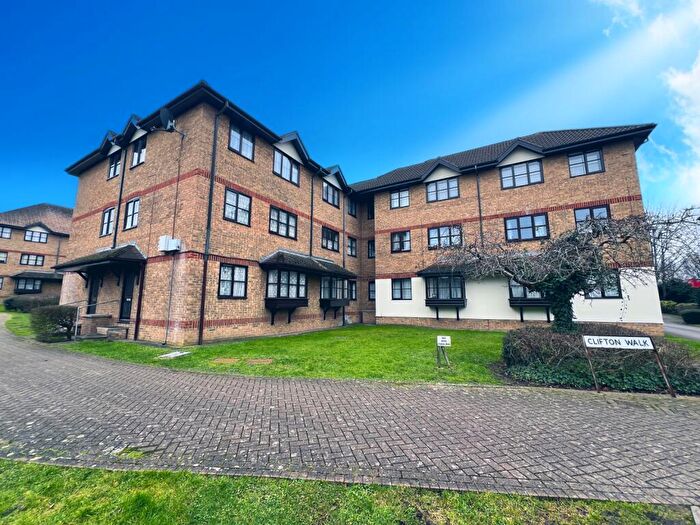
Houses for sale & to rent in Joyce Green, Dartford
House Prices in Joyce Green
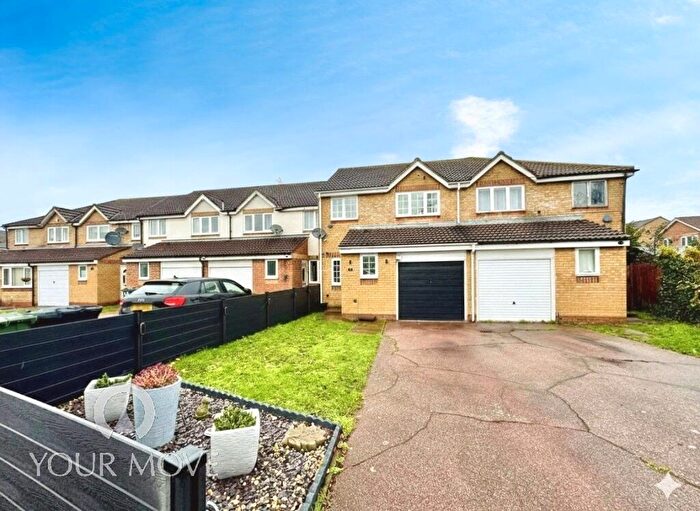
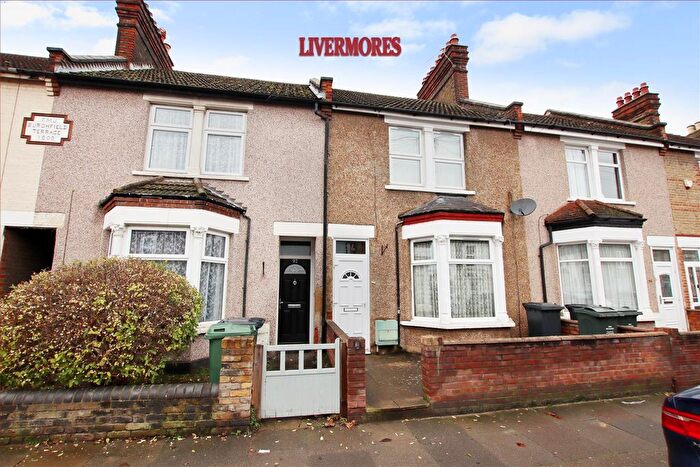
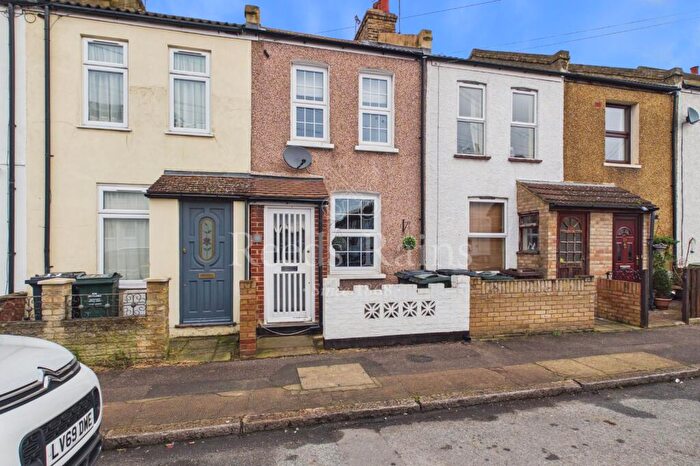
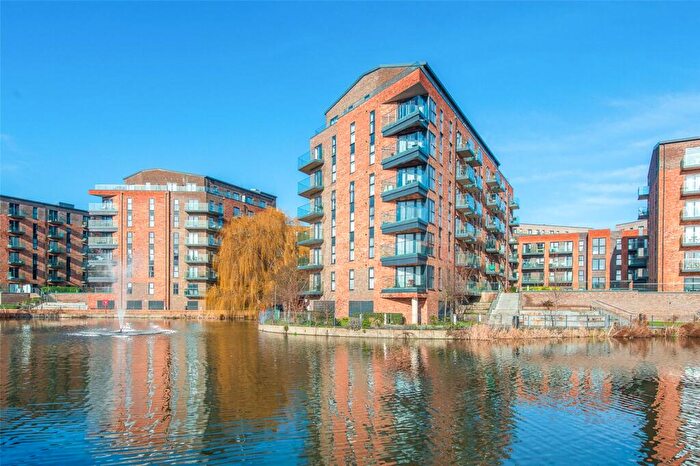
Properties in Joyce Green have an average house price of £303,538.00 and had 189 Property Transactions within the last 3 years¹.
Joyce Green is an area in Dartford, Kent with 1,920 households², where the most expensive property was sold for £590,000.00.
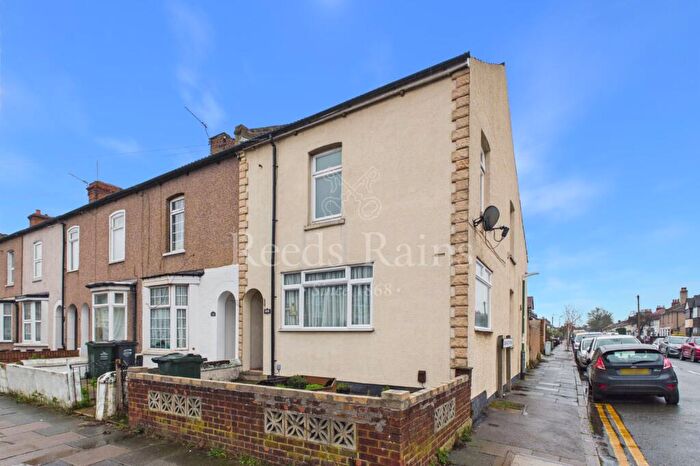
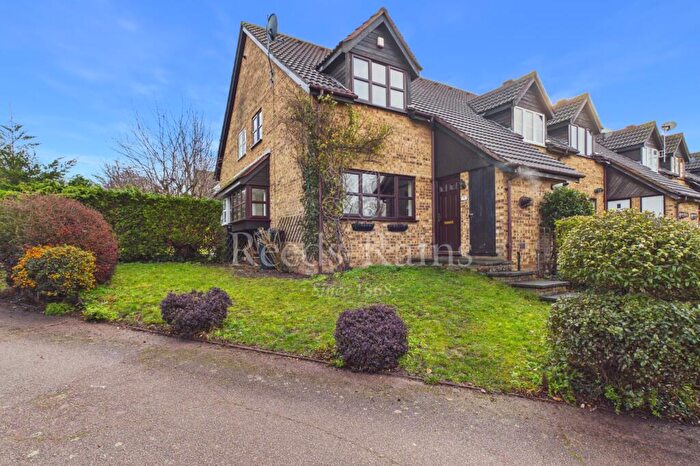
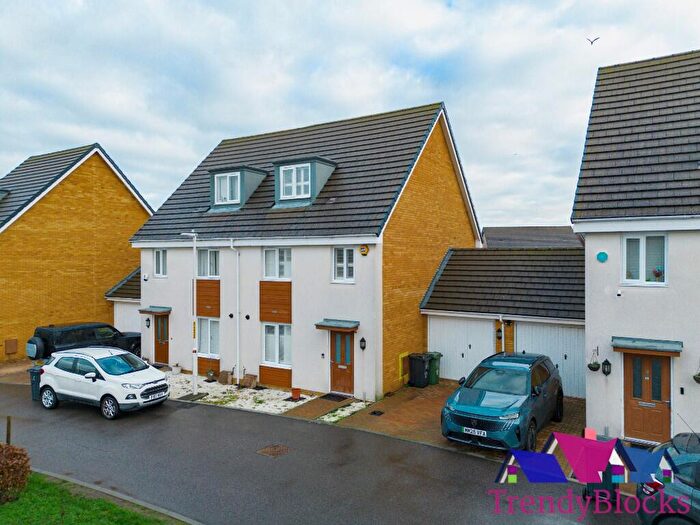
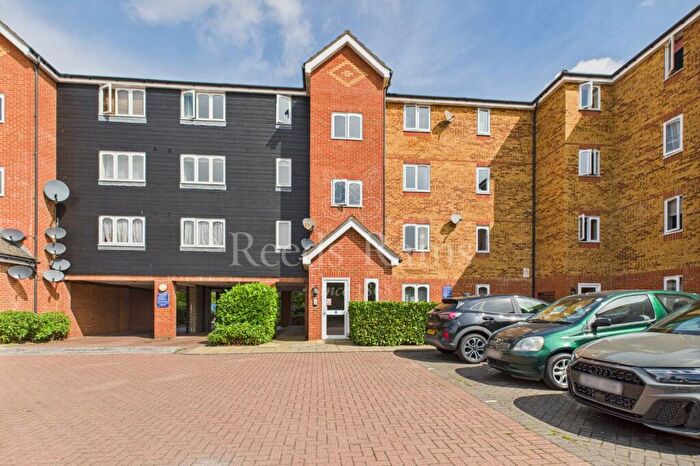
Properties for sale in Joyce Green
Roads and Postcodes in Joyce Green
Navigate through our locations to find the location of your next house in Joyce Green, Dartford for sale or to rent.
| Streets | Postcodes |
|---|---|
| Angie Mews | DA1 5GY |
| Atlas Road | DA1 5QR |
| Austen Gardens | DA1 5EX |
| Barnwell Road | DA1 5QS |
| Bell Terrace | DA1 5FN |
| Bennett Place | DA1 5FR |
| Birdwood Avenue | DA1 5GB |
| Blake Gardens | DA1 5EL |
| Bondfield Walk | DA1 5JS |
| Bronte Grove | DA1 5EU |
| Browning Road | DA1 5ET |
| Brunel Way | DA1 5FL |
| Cameron Drive | DA1 5GN |
| Chapman Court | DA1 5GL |
| Chaucer Way | DA1 5JU |
| Cloud Close | DA1 5QU |
| Cornwall Road | DA1 5PW DA1 5QE |
| Couzins Walk | DA1 5GD |
| Dunlop Close | DA1 5HR DA1 5LS DA1 5LT DA1 5LU DA1 5LY |
| Eastfield Terrace | DA1 5PJ |
| Farthing Close | DA1 5JJ |
| Groveherst Road | DA1 5JD |
| Hall Road | DA1 5HB |
| Henderson Drive | DA1 5LD DA1 5LG DA1 5LQ |
| Hilltop Gardens | DA1 5JE DA1 5JF |
| Hyde Grove | DA1 5GE |
| Joyce Green Lane | DA1 5HA DA1 5HH DA1 5HJ DA1 5HN DA1 5HW DA1 5PB |
| Joyce Green Walk | DA1 5GZ DA1 5JA |
| Keyes Road | DA1 5EN DA1 5EW |
| Macmillan Gardens | DA1 5ES |
| Mannock Road | DA1 5QT |
| Marsden Gardens | DA1 5GF |
| Mccudden Road | DA1 5QL |
| Morris Walk | DA1 5GP |
| Nightingale Grove | DA1 5ER |
| Osterberg Road | DA1 5HE DA1 5HF |
| Pepys Close | DA1 5EP |
| Rainbow Gardens | DA1 5RF |
| Ruby Tuesday Drive | DA1 5RE |
| Salmon Road | DA1 5JB |
| Sharp Way | DA1 5JP |
| Shiers Avenue | DA1 5FQ |
| Silver Train Gardens | DA1 5QD |
| Southfield Court | DA1 5PH |
| Spielman Road | DA1 5EY DA1 5EZ DA1 5HD |
| St Edmunds Road | DA1 5ND DA1 5NE DA1 5NF |
| Stones Avenue | DA1 5GS |
| Strickland Avenue | DA1 5JR |
| Sympathy Vale | DA1 5GW DA1 5GX |
| Temple Hill | DA1 5HX |
| Temple Hill Square | DA1 5HY DA1 5HZ |
| Trevelyan Close | DA1 5EJ |
| Trevithick Drive | DA1 5JH DA1 5LJ DA1 5LL DA1 5LN DA1 5LP DA1 5LW |
| Tyler Grove | DA1 5HG DA1 5HQ |
| Vickers Lane | DA1 5FF DA1 5FG |
| Vimy Drive | DA1 5FJ |
| Waylen Gardens | DA1 5GJ |
| Wellcome Avenue | DA1 5JL DA1 5JN DA1 5JW |
| Wilkinson Close | DA1 5JT DA1 5LH |
Transport near Joyce Green
-
Dartford Station
-
Stone Crossing Station
-
Purfleet Station
-
Slade Green Station
-
Crayford Station
-
Greenhithe Station
-
Erith Station
-
Barnehurst Station
- FAQ
- Price Paid By Year
- Property Type Price
Frequently asked questions about Joyce Green
What is the average price for a property for sale in Joyce Green?
The average price for a property for sale in Joyce Green is £303,538. This amount is 21% lower than the average price in Dartford. There are 1,559 property listings for sale in Joyce Green.
What streets have the most expensive properties for sale in Joyce Green?
The streets with the most expensive properties for sale in Joyce Green are Brunel Way at an average of £465,000, Vimy Drive at an average of £429,714 and Bell Terrace at an average of £415,750.
What streets have the most affordable properties for sale in Joyce Green?
The streets with the most affordable properties for sale in Joyce Green are Joyce Green Walk at an average of £115,000, Morris Walk at an average of £167,500 and Blake Gardens at an average of £180,000.
Which train stations are available in or near Joyce Green?
Some of the train stations available in or near Joyce Green are Dartford, Stone Crossing and Purfleet.
Property Price Paid in Joyce Green by Year
The average sold property price by year was:
| Year | Average Sold Price | Price Change |
Sold Properties
|
|---|---|---|---|
| 2025 | £319,026 | 4% |
57 Properties |
| 2024 | £307,262 | 7% |
65 Properties |
| 2023 | £286,750 | -12% |
67 Properties |
| 2022 | £319,897 | 9% |
74 Properties |
| 2021 | £292,296 | 8% |
102 Properties |
| 2020 | £268,309 | 8% |
73 Properties |
| 2019 | £246,673 | -14% |
74 Properties |
| 2018 | £281,201 | 13% |
140 Properties |
| 2017 | £243,946 | 3% |
101 Properties |
| 2016 | £236,209 | 15% |
99 Properties |
| 2015 | £200,727 | 6% |
116 Properties |
| 2014 | £189,625 | 2% |
201 Properties |
| 2013 | £186,104 | 7% |
138 Properties |
| 2012 | £173,831 | -10% |
122 Properties |
| 2011 | £190,476 | 14% |
105 Properties |
| 2010 | £164,582 | 4% |
45 Properties |
| 2009 | £158,645 | -19% |
52 Properties |
| 2008 | £188,921 | 1% |
113 Properties |
| 2007 | £186,366 | 28% |
146 Properties |
| 2006 | £133,295 | 8% |
94 Properties |
| 2005 | £122,216 | -1% |
62 Properties |
| 2004 | £123,315 | -2% |
101 Properties |
| 2003 | £125,515 | 19% |
175 Properties |
| 2002 | £101,306 | 27% |
84 Properties |
| 2001 | £74,080 | 2% |
53 Properties |
| 2000 | £72,521 | 12% |
51 Properties |
| 1999 | £63,983 | -8% |
67 Properties |
| 1998 | £69,246 | 26% |
146 Properties |
| 1997 | £51,579 | -13% |
22 Properties |
| 1996 | £58,357 | -6% |
26 Properties |
| 1995 | £61,970 | - |
45 Properties |
Property Price per Property Type in Joyce Green
Here you can find historic sold price data in order to help with your property search.
The average Property Paid Price for specific property types in the last three years are:
| Property Type | Average Sold Price | Sold Properties |
|---|---|---|
| Semi Detached House | £380,515.00 | 32 Semi Detached Houses |
| Terraced House | £367,208.00 | 78 Terraced Houses |
| Flat | £201,818.00 | 77 Flats |
| Detached House | £505,000.00 | 2 Detached Houses |

