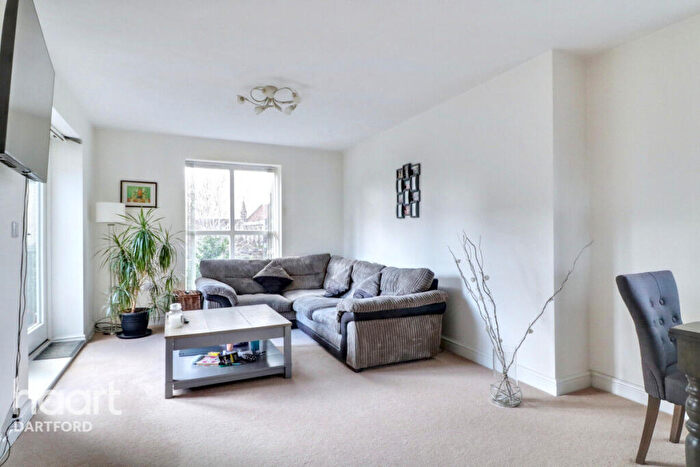
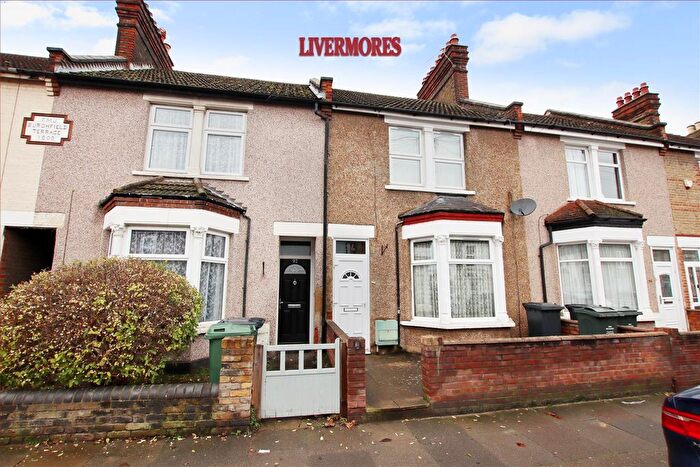
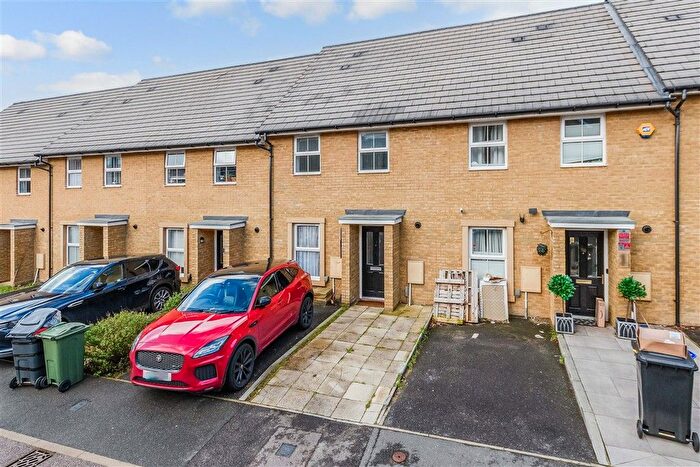
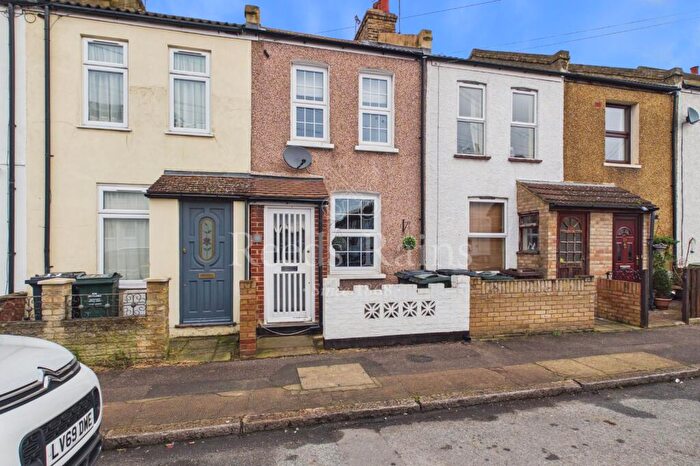
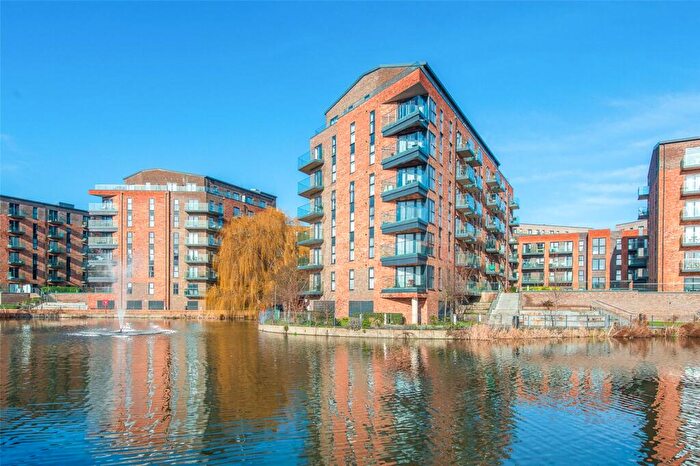
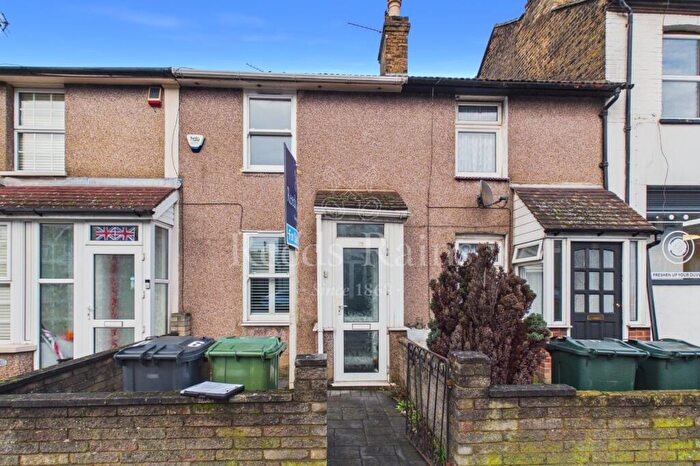
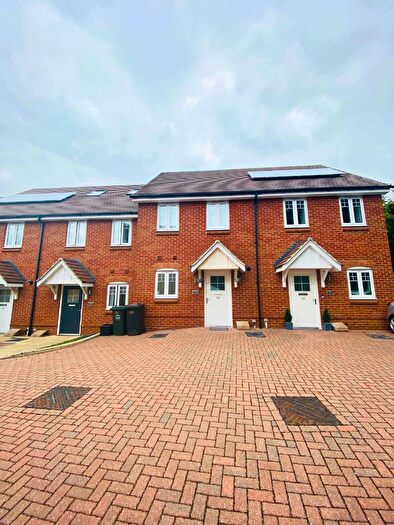
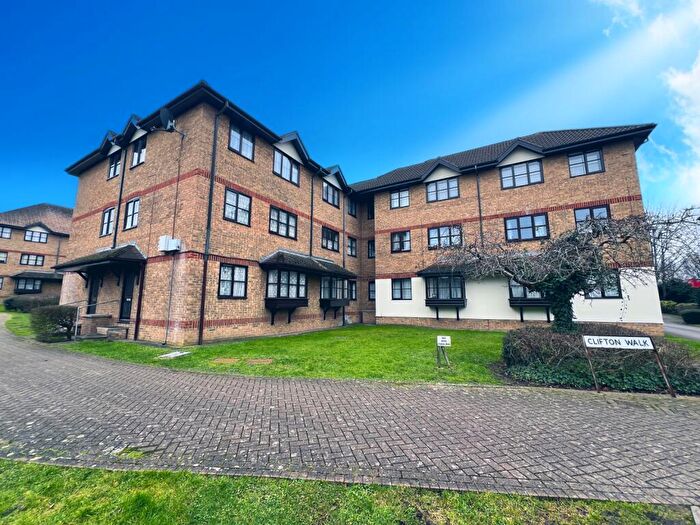
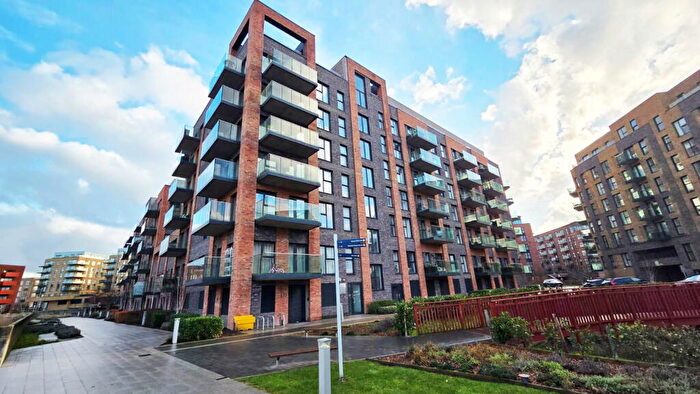
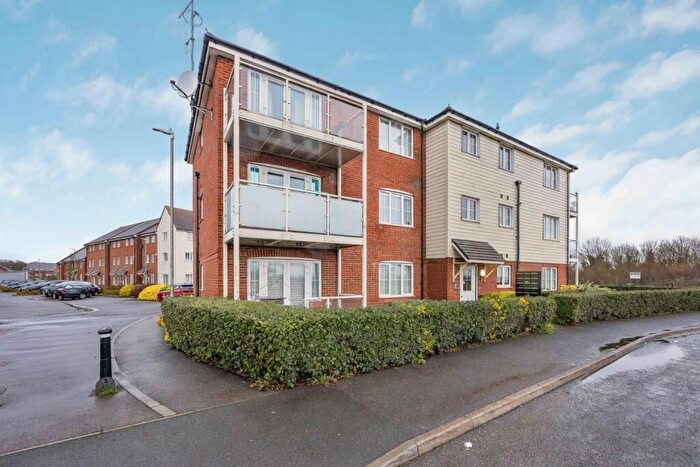
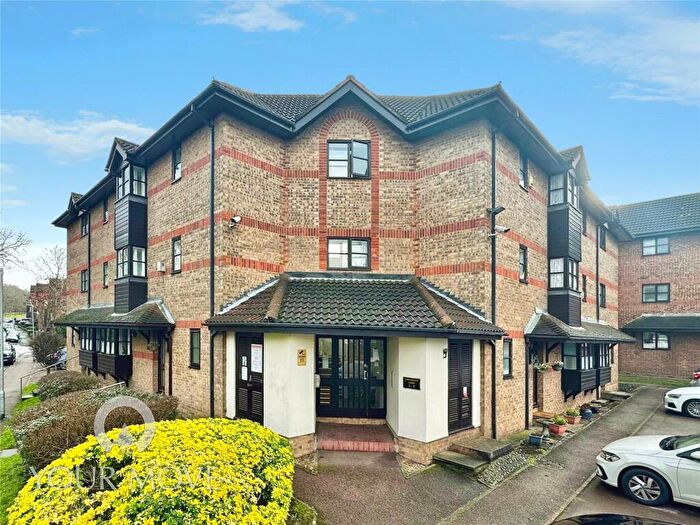
Houses for sale & to rent in Newtown, Dartford
House Prices in Newtown
Properties in Newtown have an average house price of £309,255.00 and had 313 Property Transactions within the last 3 years¹.
Newtown is an area in Dartford, Kent with 3,160 households², where the most expensive property was sold for £710,000.00.
Properties for sale in Newtown
Roads and Postcodes in Newtown
Navigate through our locations to find the location of your next house in Newtown, Dartford for sale or to rent.
| Streets | Postcodes |
|---|---|
| Barham Road | DA1 1XG DA1 1XQ |
| Bayly Road | DA1 1UY DA1 1UZ |
| Bow Arrow Lane | DA1 1YY DA2 6FX DA2 6PA DA2 6RA DA2 6RB DA2 6RD DA2 6SH DA2 6SJ |
| Brandon Road | DA1 1SD |
| Brent Close | DA2 6DB DA2 6DD DA2 6DH |
| Brent Way | DA2 6DA |
| Brentfield Road | DA1 1YJ |
| Carlisle Road | DA1 1XB DA1 1XJ DA1 1XL |
| Carrington Road | DA1 1XN DA1 1XW |
| Clifton Walk | DA2 6RY DA2 6RZ DA2 6SA |
| Colin Close | DA2 6DP |
| Colney Road | DA1 1TG DA1 1TQ DA1 1TX DA1 1UH |
| Dewlands Avenue | DA2 6AJ |
| East Hill | DA1 1RY DA1 1RZ DA1 1SB |
| Fairfax Court | DA1 1XY |
| Fairway Drive | DA2 6AR |
| Finchley Close | DA1 1XR |
| Fulwich Road | DA1 1UN DA1 1UT DA1 1UW |
| Gladstone Road | DA1 1TU |
| Grange Crescent | DA2 6RE DA2 6RF DA2 6RJ |
| Great Queen Street | DA1 1TJ DA1 1TN DA1 1TW |
| Hardwick Crescent | DA2 6SD DA2 6SE DA2 6SF DA2 6SG |
| High Trees | DA2 6PL |
| Howard Road | DA1 1XH DA1 1XS |
| Invicta Road | DA2 6AY DA2 6AZ |
| Ivy Close | DA1 1XT |
| Lamplighters Close | DA1 1TB |
| Lavinia Road | DA1 1TS |
| Lingfield Avenue | DA2 6AH DA2 6AP |
| Little Queen Street | DA1 1TL |
| London Road | DA2 6AN DA2 6AX DA2 6DJ DA2 6DL |
| Marriott Road | DA1 1UD |
| Marshall Close | DA1 1BL |
| Meadow Way | DA2 6AB |
| Merryweather Close | DA1 1UG |
| Mildred Close | DA1 1XP |
| Milestone Road | DA2 6DN DA2 6DW |
| Mount Pleasant Road | DA1 1TD DA1 1TH |
| Newbury Close | DA2 6AQ |
| Osbourne Road | DA2 6RG DA2 6RH DA2 6RL DA2 6RN DA2 6RP DA2 6RQ DA2 6RR DA2 6RS DA2 6RT DA2 6RU DA2 6RW DA2 6RX |
| Overy Street | DA1 1UP DA1 1AH |
| Pilgrims Way | DA1 1QY |
| Rose Villas | DA1 1RN |
| Rosedale Close | DA2 6AL |
| Shenley Road | DA1 1YE DA1 1YF |
| Somerville Road | DA1 1TT |
| St Albans Road | DA1 1TE DA1 1TF DA1 1TY DA1 1TZ |
| St Martins Road | DA1 1UJ |
| St Vincents Road | DA1 1UX DA1 1XA DA1 1XE DA1 1XF DA1 1XZ DA1 1UU |
| Sundridge Close | DA1 1XD |
| The Brent | DA1 1YB DA1 1YG DA1 1YH DA1 1YN DA1 1YW DA2 6DE DA2 6DG |
| The Oaks | DA2 6PF |
| Thirza Road | DA1 1UB |
| Tufnail Road | DA1 1TP |
| Waid Close | DA1 1UL |
| Waldeck Road | DA1 1UA |
| Watling Street | DA1 1RF DA2 6AE DA2 6AF DA1 1RW |
| West View Road | DA1 1TR |
Transport near Newtown
-
Dartford Station
-
Stone Crossing Station
-
Greenhithe Station
-
Crayford Station
-
Slade Green Station
-
Purfleet Station
-
Farningham Road Station
- FAQ
- Price Paid By Year
- Property Type Price
Frequently asked questions about Newtown
What is the average price for a property for sale in Newtown?
The average price for a property for sale in Newtown is £309,255. This amount is 19% lower than the average price in Dartford. There are 1,827 property listings for sale in Newtown.
What streets have the most expensive properties for sale in Newtown?
The streets with the most expensive properties for sale in Newtown are The Oaks at an average of £710,000, Watling Street at an average of £486,562 and High Trees at an average of £485,000.
What streets have the most affordable properties for sale in Newtown?
The streets with the most affordable properties for sale in Newtown are Osbourne Road at an average of £168,944, Hardwick Crescent at an average of £179,363 and Clifton Walk at an average of £192,750.
Which train stations are available in or near Newtown?
Some of the train stations available in or near Newtown are Dartford, Stone Crossing and Greenhithe.
Property Price Paid in Newtown by Year
The average sold property price by year was:
| Year | Average Sold Price | Price Change |
Sold Properties
|
|---|---|---|---|
| 2025 | £317,428 | 3% |
102 Properties |
| 2024 | £309,136 | 3% |
110 Properties |
| 2023 | £301,132 | -5% |
101 Properties |
| 2022 | £317,085 | 7% |
145 Properties |
| 2021 | £294,703 | 7% |
183 Properties |
| 2020 | £274,570 | 5% |
112 Properties |
| 2019 | £261,230 | -1% |
124 Properties |
| 2018 | £264,289 | 3% |
147 Properties |
| 2017 | £256,258 | 7% |
177 Properties |
| 2016 | £237,672 | 10% |
186 Properties |
| 2015 | £212,973 | 11% |
188 Properties |
| 2014 | £188,507 | 12% |
219 Properties |
| 2013 | £165,606 | 6% |
109 Properties |
| 2012 | £155,847 | 1% |
97 Properties |
| 2011 | £154,958 | -2% |
102 Properties |
| 2010 | £157,815 | 7% |
106 Properties |
| 2009 | £146,061 | -16% |
101 Properties |
| 2008 | £169,817 | 3% |
124 Properties |
| 2007 | £164,807 | 9% |
279 Properties |
| 2006 | £149,999 | 5% |
256 Properties |
| 2005 | £142,825 | 4% |
221 Properties |
| 2004 | £136,691 | 9% |
238 Properties |
| 2003 | £124,929 | 12% |
291 Properties |
| 2002 | £110,426 | 25% |
292 Properties |
| 2001 | £82,864 | 10% |
273 Properties |
| 2000 | £74,755 | 14% |
244 Properties |
| 1999 | £64,452 | 11% |
270 Properties |
| 1998 | £57,591 | 11% |
260 Properties |
| 1997 | £51,361 | 7% |
228 Properties |
| 1996 | £47,519 | 1% |
194 Properties |
| 1995 | £46,955 | - |
168 Properties |
Property Price per Property Type in Newtown
Here you can find historic sold price data in order to help with your property search.
The average Property Paid Price for specific property types in the last three years are:
| Property Type | Average Sold Price | Sold Properties |
|---|---|---|
| Semi Detached House | £389,728.00 | 59 Semi Detached Houses |
| Detached House | £462,500.00 | 12 Detached Houses |
| Terraced House | £324,322.00 | 163 Terraced Houses |
| Flat | £194,791.00 | 79 Flats |

