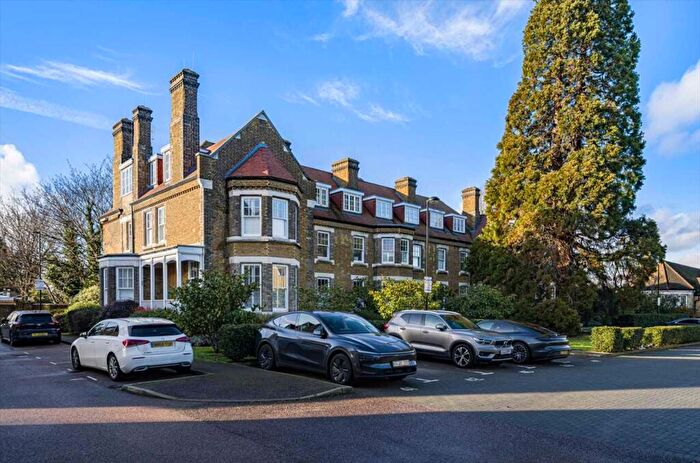
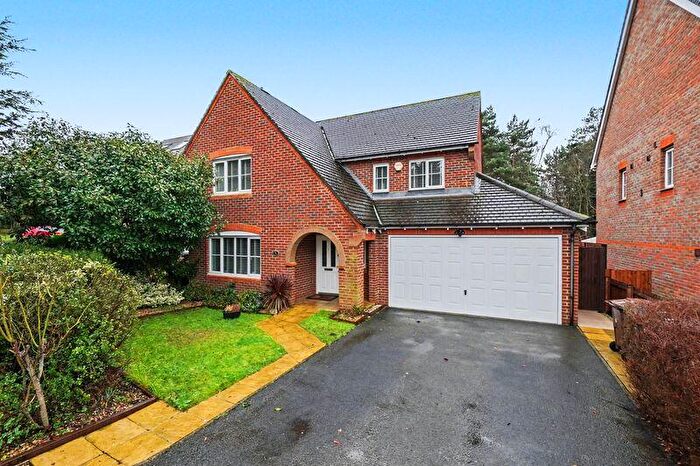
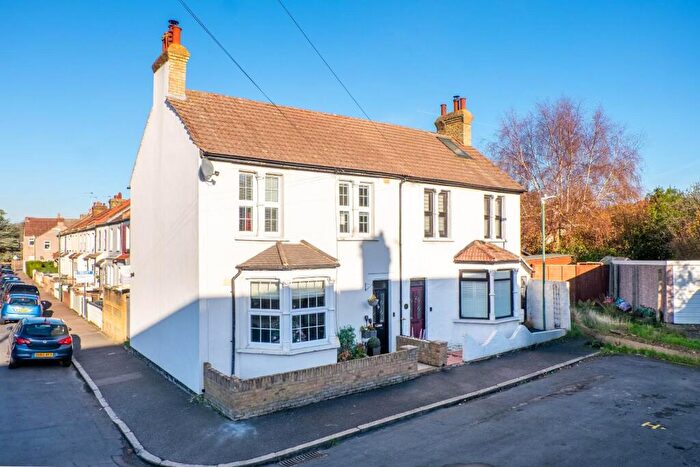
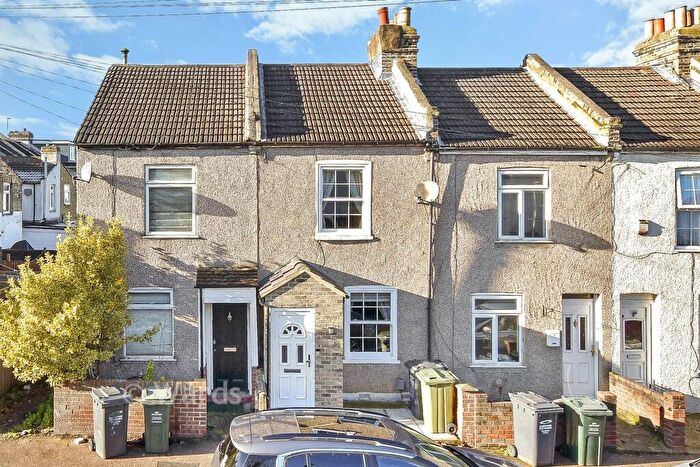
Houses for sale & to rent in Brent, Dartford
House Prices in Brent
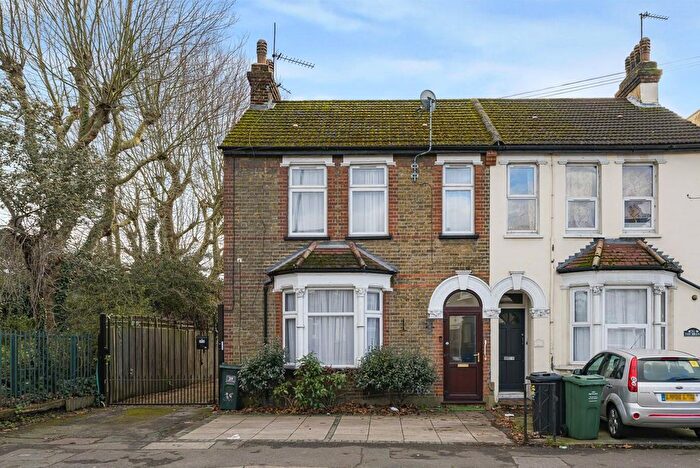
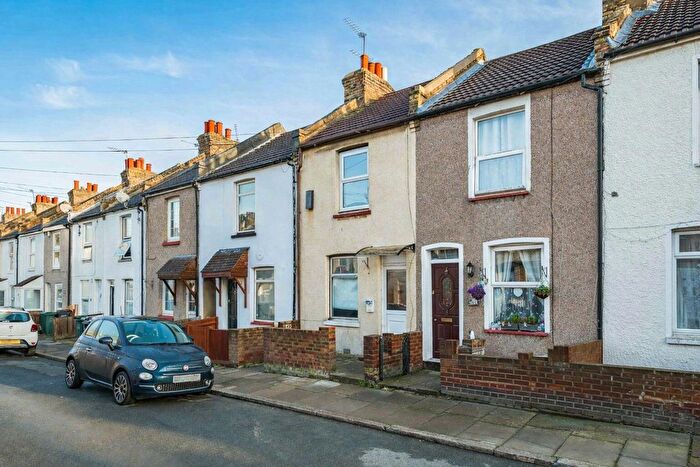
Properties in Brent have an average house price of £373,279.00 and had 246 Property Transactions within the last 3 years¹.
Brent is an area in Dartford, Kent with 2,573 households², where the most expensive property was sold for £980,000.00.
Properties for sale in Brent
Roads and Postcodes in Brent
Navigate through our locations to find the location of your next house in Brent, Dartford for sale or to rent.
| Streets | Postcodes |
|---|---|
| Airedale Close | DA2 6JL |
| Allendale Close | DA2 6JP |
| Bedale Walk | DA2 6HS |
| Bedford Road | DA1 1SR |
| Berkeley Crescent | DA1 1NH |
| Brent Lane | DA1 1QN DA1 1QS DA1 1QT DA1 1QU DA1 1QW DA1 1QX |
| Brentlands Drive | DA1 1RH |
| Brook Park | DA1 1NG |
| Canterbury Close | DA1 1RR |
| Carleton Road | DA1 1SS |
| Chalk Close | DA1 1AN |
| Chaucer Park | DA1 1RE |
| Churchill Close | DA1 1QJ DA1 1QL |
| Clearwater Lane | DA1 1AP |
| Craigie Court | DA1 1QB |
| Cumberland Drive | DA1 1NB |
| Dale Walk | DA2 6JA |
| Darenth Road | DA1 1LP DA1 1LR DA1 1LS DA1 1LU DA1 1LY DA1 1LZ DA1 1NJ DA1 1NL DA1 1NE |
| Dene Road | DA1 1LX |
| Dorchester Close | DA1 1ND |
| Dovedale Road | DA2 6JJ |
| Downs Avenue | DA1 1SU DA1 1SX |
| East Hill | DA1 1RX DA1 1SN DA1 1SW DA1 1SA |
| East Hill Drive | DA1 1QP |
| Edgefield Close | DA1 1QH |
| Eskdale Close | DA2 6LA |
| Fleet Avenue | DA2 6NL |
| Fleet Road | DA2 6JE DA2 6JF |
| Fleetdale Parade | DA2 6JB |
| Gore Road | DA2 6LT DA2 6LY |
| Green Street Green Road | DA1 1NF DA1 1QF DA2 6NR DA2 6PS DA1 1QE |
| Hesketh Avenue | DA2 6NP |
| James Clubb Way | DA1 1AL |
| Lonsdale Crescent | DA2 6LG DA2 6LQ |
| Lunedale Road | DA2 6HT DA2 6HU DA2 6JX DA2 6LN DA2 6LR DA2 6LW DA2 6NA |
| Marina Drive | DA1 1RD |
| Maybury Avenue | DA2 6JD |
| Oaklands Road | DA2 6NH |
| Oakwood Close | DA1 1YU |
| Orbital One | DA1 1QG |
| Park Road | DA1 1SL DA1 1ST DA1 1SY DA1 1SZ |
| Patterdale Road | DA2 6LP |
| Pilgrims Way | DA1 1QA DA1 1QZ |
| Princes Avenue | DA2 6HX DA2 6NE DA2 6NF DA2 6NJ |
| Princes Road | DA1 1RB DA1 1YS DA2 6JG DA2 6JQ DA2 6NG DA2 6NQ DA1 1YT |
| Princes View | DA1 1RJ |
| Queens Gardens | DA2 6HY DA2 6HZ |
| Ribblesdale Road | DA2 6JH |
| Rochester Road | DA1 1SP |
| Salisbury Road | DA2 6GY |
| St Ronan's View | DA1 1QD DA1 1AE |
| Sterndale Road | DA1 1QR |
| Sussex Road | DA1 1SH DA1 1SJ |
| Swaledale Road | DA2 6JY DA2 6JZ |
| Teesdale Road | DA2 6LB DA2 6LD DA2 6LJ |
| Teynham Road | DA2 6GE |
| The Brent | DA1 1YD |
| Tynedale Close | DA2 6LL |
| Watling Street | DA1 1RP DA2 6AA DA2 6EG DA2 6EP DA2 6GB |
| Wayville Road | DA1 1RL |
| Weardale Avenue | DA2 6LE DA2 6LF |
| Wharfedale Road | DA2 6LH |
| Whitfield Crescent | DA2 6GD |
| York Road | DA1 1SG DA1 1SQ |
| DA1 1AT DA1 1RT |
Transport near Brent
-
Dartford Station
-
Stone Crossing Station
-
Greenhithe Station
-
Farningham Road Station
-
Crayford Station
-
Slade Green Station
-
Purfleet Station
- FAQ
- Price Paid By Year
- Property Type Price
Frequently asked questions about Brent
What is the average price for a property for sale in Brent?
The average price for a property for sale in Brent is £373,279. This amount is 2% lower than the average price in Dartford. There are 1,440 property listings for sale in Brent.
What streets have the most expensive properties for sale in Brent?
The streets with the most expensive properties for sale in Brent are Clearwater Lane at an average of £640,000, Pilgrims Way at an average of £605,000 and Darenth Road at an average of £589,375.
What streets have the most affordable properties for sale in Brent?
The streets with the most affordable properties for sale in Brent are Churchill Close at an average of £153,555, Downs Avenue at an average of £161,055 and Edgefield Close at an average of £246,666.
Which train stations are available in or near Brent?
Some of the train stations available in or near Brent are Dartford, Stone Crossing and Greenhithe.
Property Price Paid in Brent by Year
The average sold property price by year was:
| Year | Average Sold Price | Price Change |
Sold Properties
|
|---|---|---|---|
| 2025 | £391,464 | 2% |
70 Properties |
| 2024 | £385,357 | 11% |
95 Properties |
| 2023 | £343,398 | -8% |
81 Properties |
| 2022 | £372,399 | 5% |
93 Properties |
| 2021 | £354,581 | -2% |
114 Properties |
| 2020 | £362,320 | 11% |
89 Properties |
| 2019 | £321,429 | -13% |
92 Properties |
| 2018 | £363,173 | 1% |
96 Properties |
| 2017 | £360,424 | 15% |
114 Properties |
| 2016 | £305,118 | 16% |
113 Properties |
| 2015 | £254,914 | 11% |
104 Properties |
| 2014 | £226,222 | 11% |
107 Properties |
| 2013 | £201,058 | 1% |
88 Properties |
| 2012 | £199,283 | 9% |
61 Properties |
| 2011 | £181,760 | 4% |
73 Properties |
| 2010 | £174,318 | -4% |
58 Properties |
| 2009 | £181,594 | -2% |
87 Properties |
| 2008 | £185,118 | -11% |
66 Properties |
| 2007 | £205,821 | 14% |
162 Properties |
| 2006 | £177,254 | -3% |
133 Properties |
| 2005 | £183,051 | 12% |
105 Properties |
| 2004 | £160,720 | 6% |
127 Properties |
| 2003 | £151,443 | 19% |
99 Properties |
| 2002 | £122,094 | 16% |
122 Properties |
| 2001 | £102,221 | -7% |
120 Properties |
| 2000 | £109,150 | 27% |
119 Properties |
| 1999 | £79,912 | 13% |
93 Properties |
| 1998 | £69,303 | 11% |
108 Properties |
| 1997 | £61,952 | 1% |
100 Properties |
| 1996 | £61,357 | 5% |
92 Properties |
| 1995 | £58,275 | - |
79 Properties |
Property Price per Property Type in Brent
Here you can find historic sold price data in order to help with your property search.
The average Property Paid Price for specific property types in the last three years are:
| Property Type | Average Sold Price | Sold Properties |
|---|---|---|
| Semi Detached House | £422,224.00 | 117 Semi Detached Houses |
| Detached House | £555,444.00 | 18 Detached Houses |
| Terraced House | £373,446.00 | 66 Terraced Houses |
| Flat | £172,911.00 | 45 Flats |

