
Houses for sale & to rent in West Hill, Dartford
House Prices in West Hill
Properties in West Hill have an average house price of £390k and had 270 Property Transactions within the last 3 years¹.
West Hill is an area in Dartford, Kent with 2,688 households², where the most expensive property was sold for £1.23M.
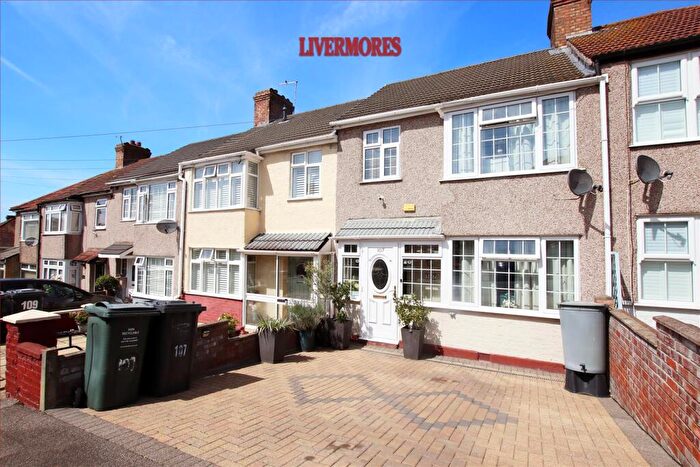
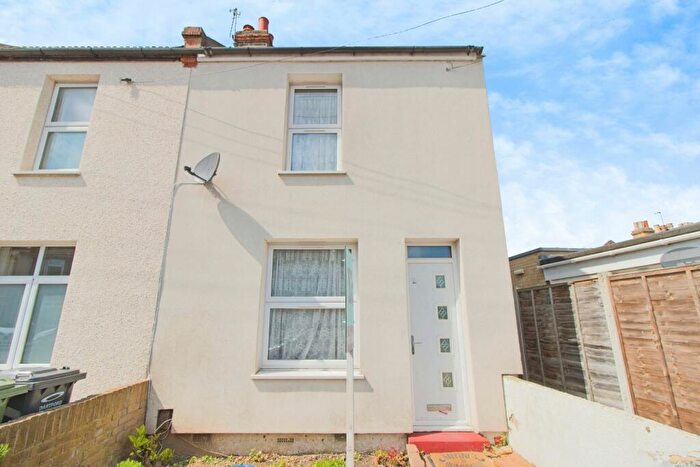
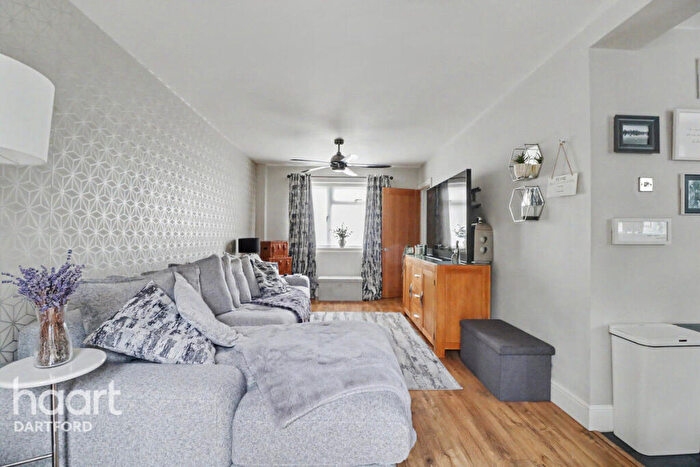
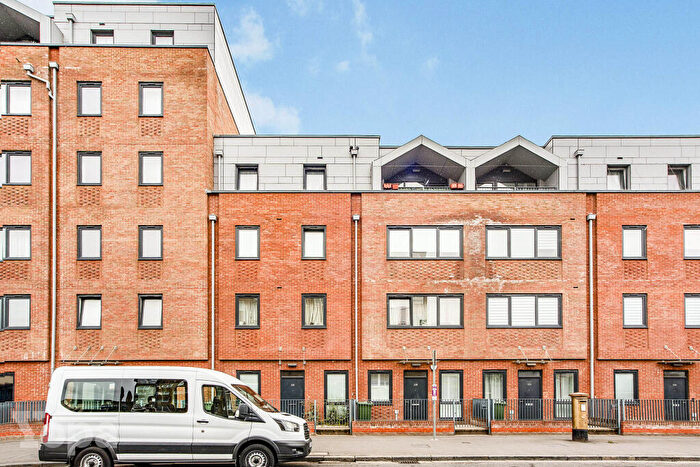
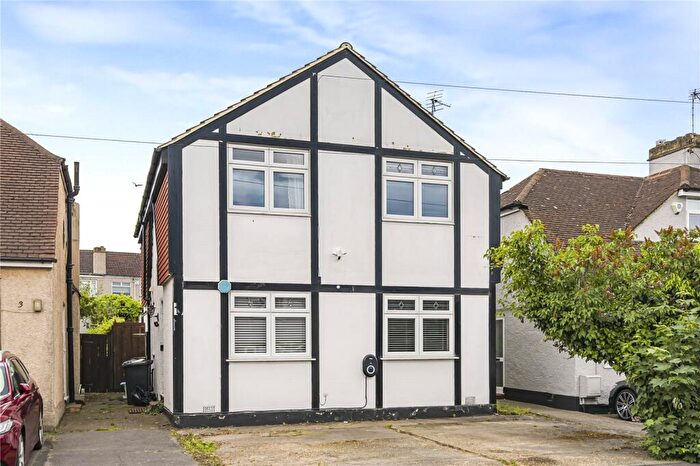
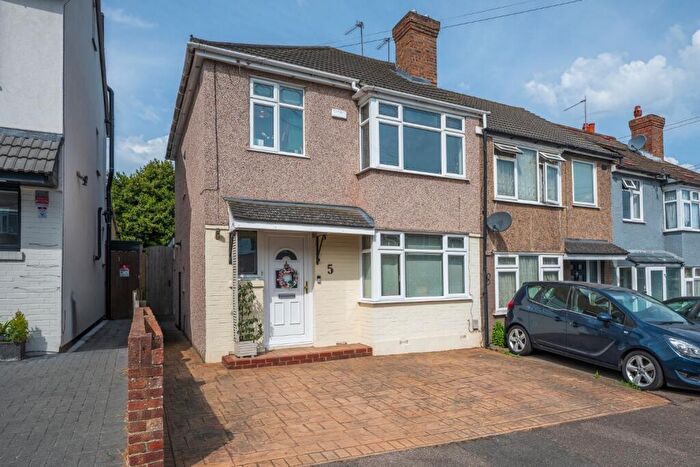
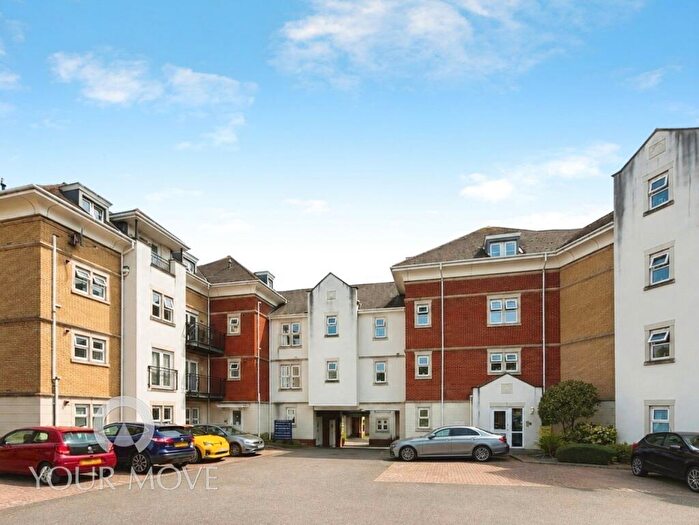
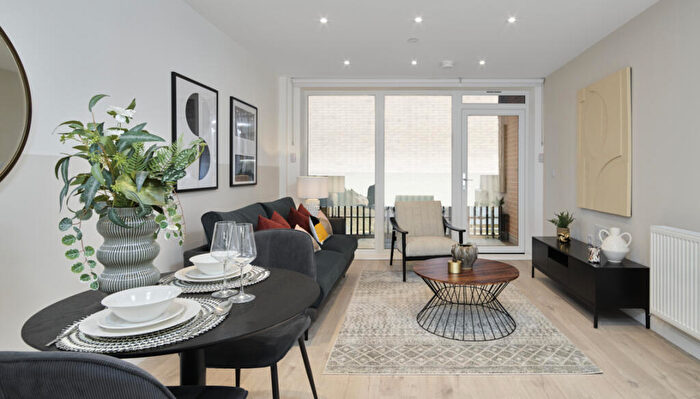
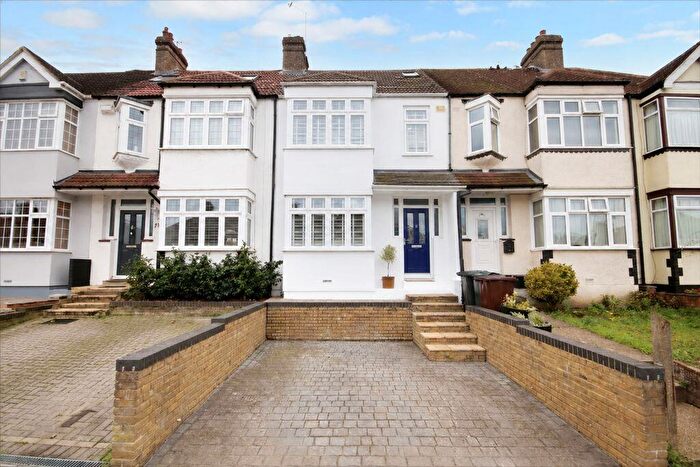
Properties for sale in West Hill
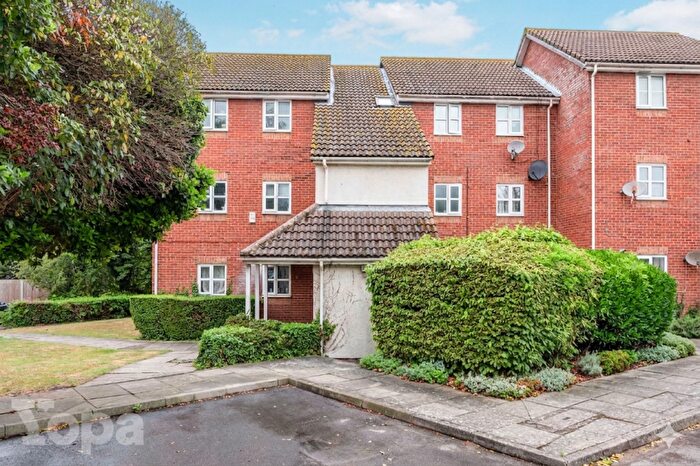
![]()
If you are looking to sell your house, let it out, or receive a property valuation, an expert can help you.
Click the button below to get started.
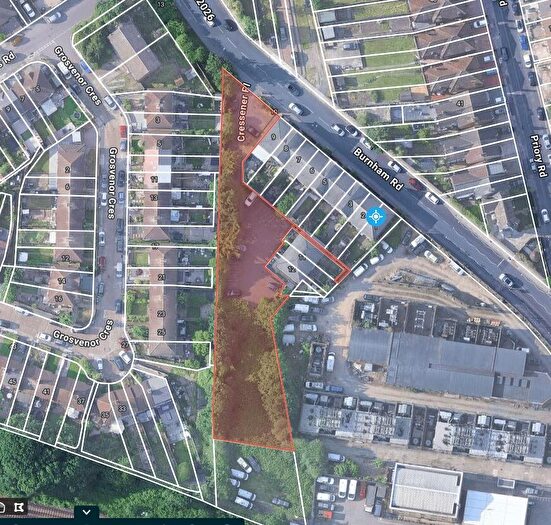

Roads and Postcodes in West Hill
Navigate through our locations to find the location of your next house in West Hill, Dartford for sale or to rent.
Transport near West Hill
-
 Dartford Station
 -
Crayford Station
-
Slade Green Station
-
Barnehurst Station
-
Stone Crossing Station
-
Bexley Station
-
Purfleet Station
-
Erith Station
- FAQ
- Price Paid By Year
- Property Type Price
Frequently asked questions about West Hill
What is the average price for a property for sale in West Hill?
The average price for a property for sale in West Hill is £390,180. This amount is 2% higher than the average price in Dartford. There are 1,624 property listings for sale in West Hill.
What streets have the most expensive properties for sale in West Hill?
The streets with the most expensive properties for sale in West Hill are Christchurch Road at an average of £778,525, Landale Gardens at an average of £730,000 and Raeburn Avenue at an average of £592,666.
What streets have the most affordable properties for sale in West Hill?
The streets with the most affordable properties for sale in West Hill are Millers Close at an average of £122,000, Constance Grove at an average of £229,000 and Rosedene Court at an average of £249,200.
Which train stations are available in or near West Hill?
Some of the train stations available in or near West Hill are Dartford, Crayford and Slade Green.
Property Price Paid in West Hill by Year
The average sold property price by year was:
| Year | Average Sold Price | Price Change |
Sold Properties
|
|---|---|---|---|
| 2026 | £407,000 | 1% |
5 Properties |
| 2025 | £403,874 | 6% |
93 Properties |
| 2024 | £378,215 | -2% |
96 Properties |
| 2023 | £387,431 | -1% |
76 Properties |
| 2022 | £391,347 | 6% |
115 Properties |
| 2021 | £367,868 | 12% |
153 Properties |
| 2020 | £324,637 | 3% |
101 Properties |
| 2019 | £315,808 | 3% |
114 Properties |
| 2018 | £307,883 | -2% |
133 Properties |
| 2017 | £314,514 | 14% |
159 Properties |
| 2016 | £272,037 | 4% |
145 Properties |
| 2015 | £262,273 | 6% |
107 Properties |
| 2014 | £245,649 | 13% |
117 Properties |
| 2013 | £214,201 | -6% |
92 Properties |
| 2012 | £227,904 | 4% |
116 Properties |
| 2011 | £219,754 | 2% |
120 Properties |
| 2010 | £216,172 | 14% |
98 Properties |
| 2009 | £185,997 | -21% |
85 Properties |
| 2008 | £224,823 | -0,1% |
174 Properties |
| 2007 | £225,115 | 10% |
246 Properties |
| 2006 | £201,640 | 7% |
159 Properties |
| 2005 | £187,735 | 2% |
132 Properties |
| 2004 | £184,907 | 15% |
142 Properties |
| 2003 | £157,894 | 12% |
110 Properties |
| 2002 | £138,765 | 16% |
143 Properties |
| 2001 | £116,430 | -1% |
114 Properties |
| 2000 | £118,042 | 27% |
95 Properties |
| 1999 | £86,232 | 2% |
115 Properties |
| 1998 | £84,096 | 1% |
114 Properties |
| 1997 | £83,101 | 15% |
131 Properties |
| 1996 | £71,039 | 13% |
108 Properties |
| 1995 | £62,073 | - |
75 Properties |
Property Price per Property Type in West Hill
Here you can find historic sold price data in order to help with your property search.
The average Property Paid Price for specific property types in the last three years are:
| Property Type | Average Sold Price | Sold Properties |
|---|---|---|
| Flat | £231,130.00 | 63 Flats |
| Semi Detached House | £491,967.00 | 57 Semi Detached Houses |
| Detached House | £753,007.00 | 14 Detached Houses |
| Terraced House | £383,847.00 | 136 Terraced Houses |