
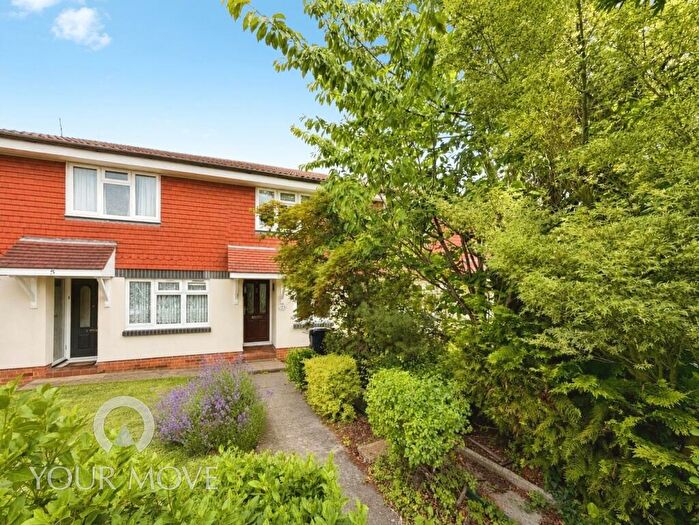
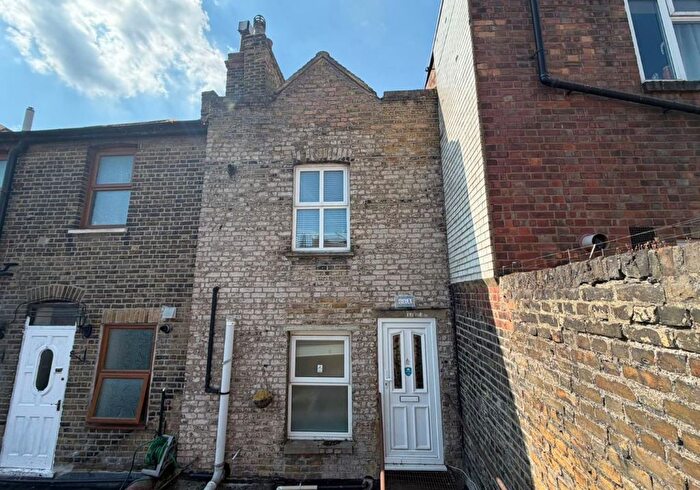
Houses for sale in Burnham, Dartford
House Prices in Burnham
Properties in Burnham have an average house price of £326k and had 21 Property Transactions within the last 3 years¹.
Burnham is an area in Dartford, Kent with 255 households², where the most expensive property was sold for £1.26M.
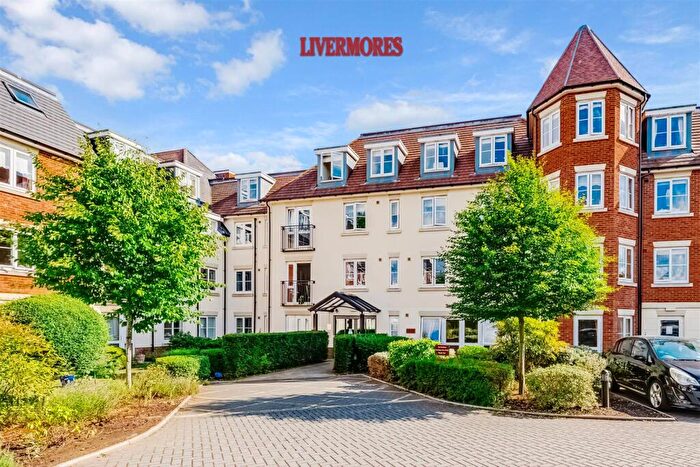
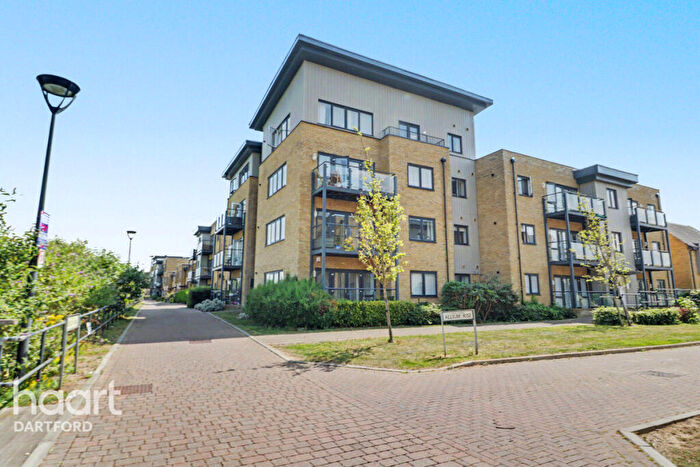
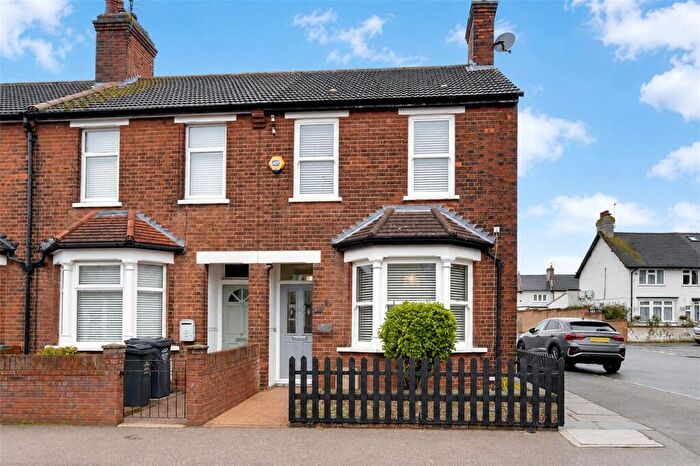
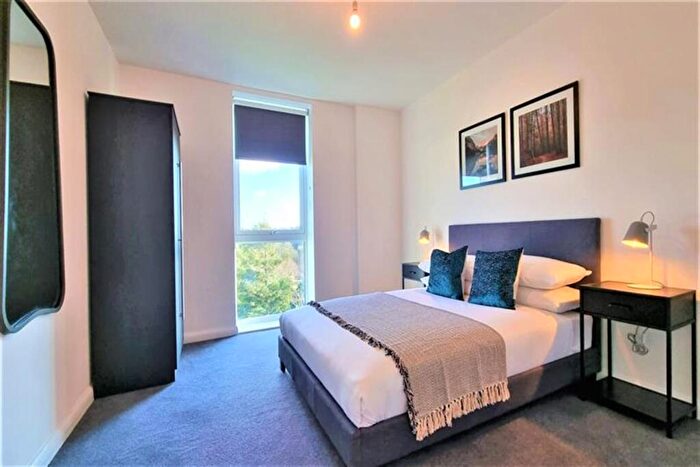
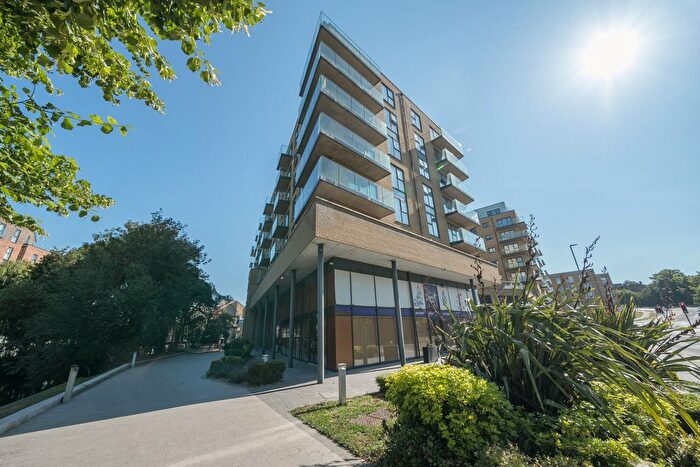
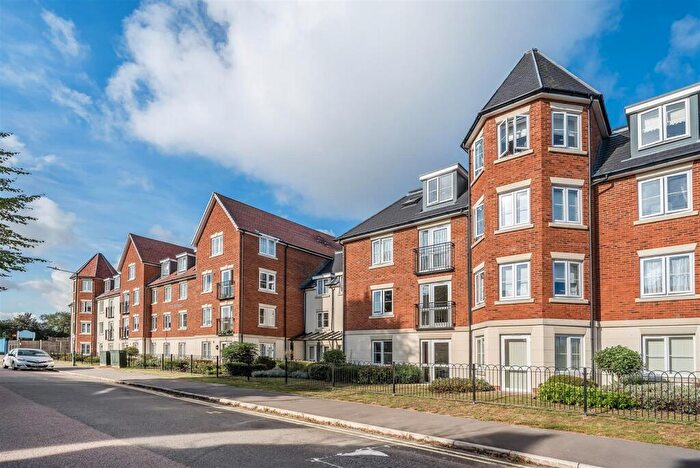
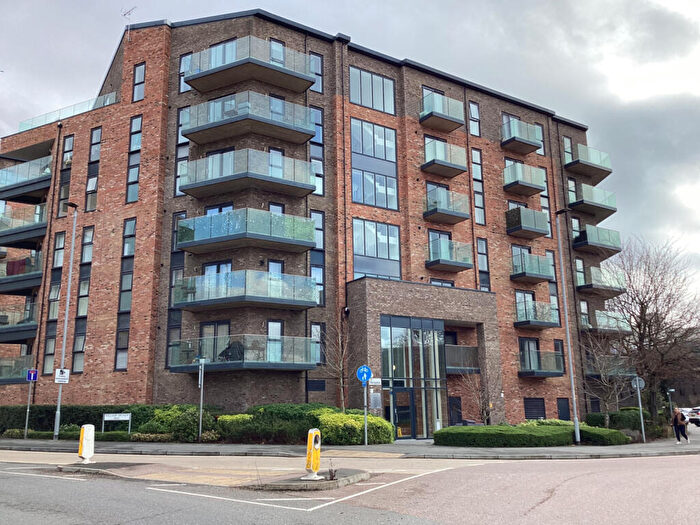
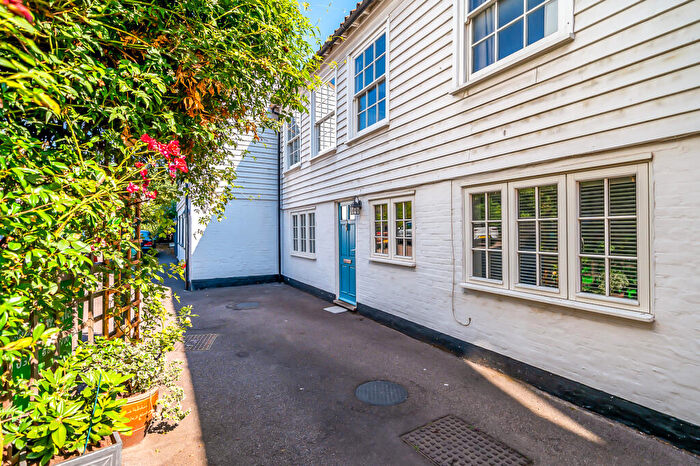
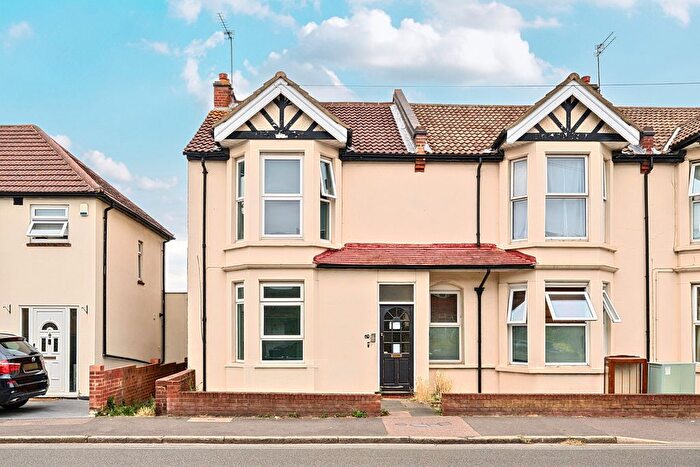
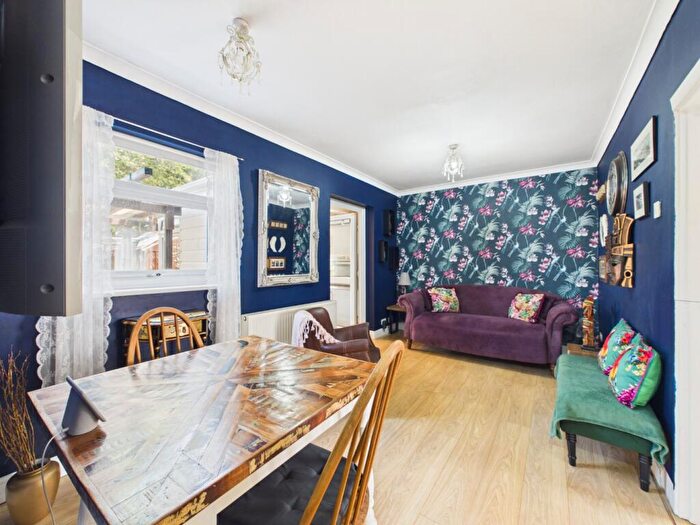
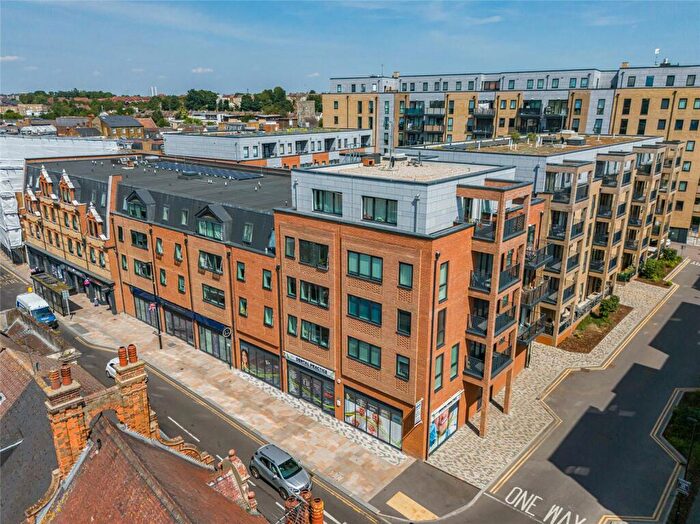
Properties for sale in Burnham
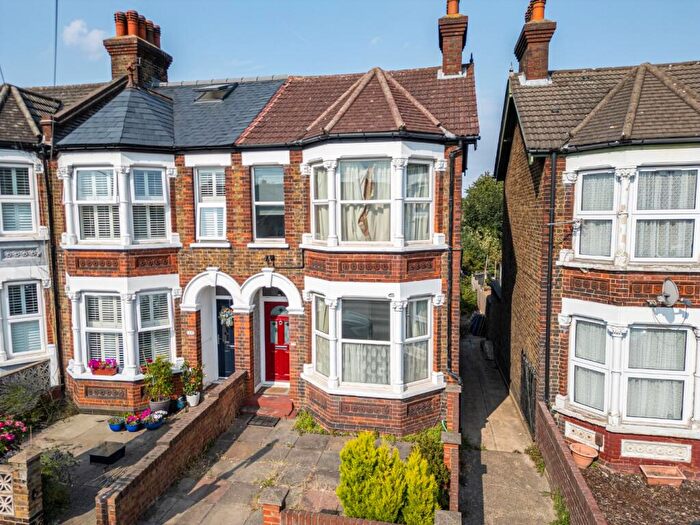
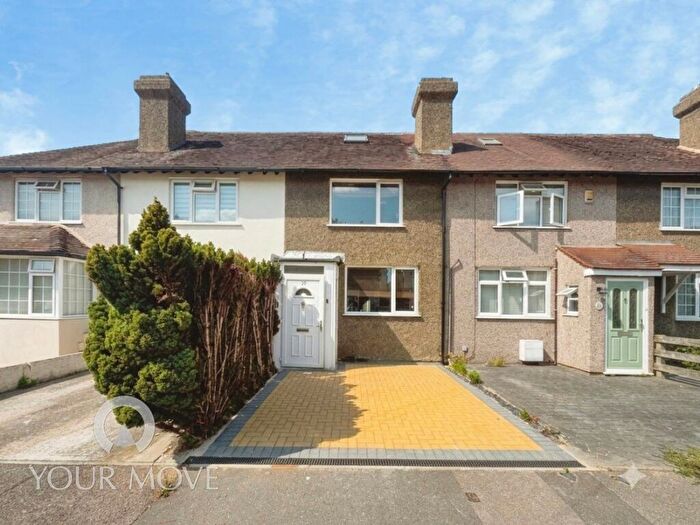
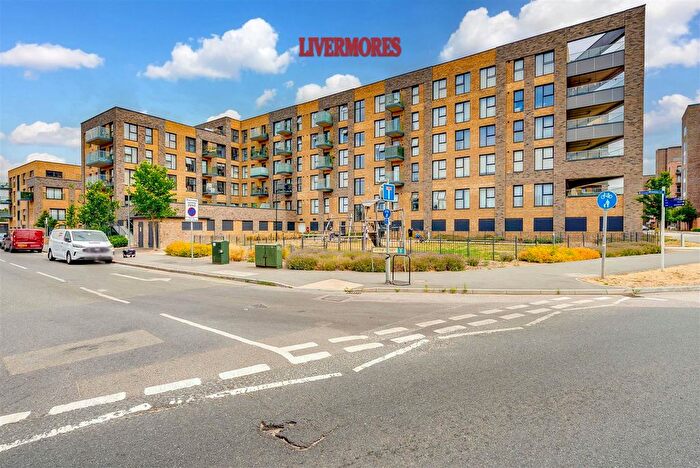
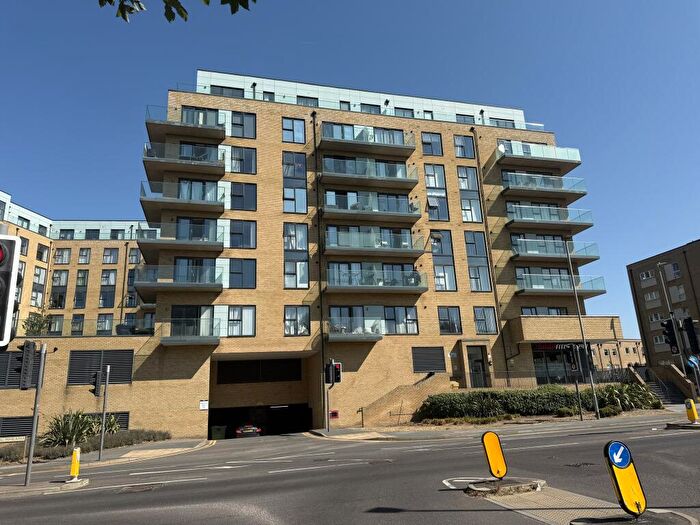
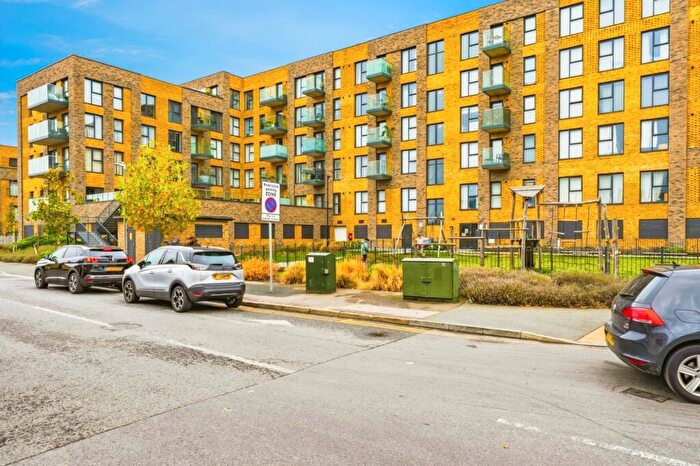
![]()
If you are looking to sell your house, let it out, or receive a property valuation, an expert can help you.
Click the button below to get started.
Roads and Postcodes in Burnham
Navigate through our locations to find the location of your next house in Burnham, Dartford for sale or to rent.
| Streets | Postcodes |
|---|---|
| Abbey Place | DA1 2BU |
| Allium Rise | DA1 5TL DA1 5TS |
| Avonmouth Road | DA1 2TQ |
| Burnham Road | DA1 5BL DA1 5BN DA1 5FH |
| Burnham Terrace | DA1 2BX |
| Burnham Trading Estate | DA1 5BH |
| Chatsworth Road | DA1 5AF |
| Creek Mill Way | DA1 2FA DA1 2FB |
| Lawson Road | DA1 5BP |
| Millside Industrial Estate | DA1 5BW |
| Priory Road | DA1 2BZ DA1 5TJ |
| Riverside Wharf | DA1 5TN DA1 5TP DA1 5TQ DA1 5TR |
| Sandpit Road | DA1 5BD DA1 5BU |
| Swan Business Park | DA1 5ED |
| Willow Walk | DA1 5AA |
Property price trends in Burnham
According to the latest Land Registry data, the average home in Burnham sold for £315,000 in 2025. That figure comes from 323 sales logged over the past 10 years.
Prices have continued to climb over the last three years. Compared with 2022, when the typical sale came in around £252,705, that's a rise of roughly 24.7%.
Looking back five years, average prices are up about 16.7% since 2020, a gain of around £45,000 in cash terms.
Zoom out to the past decade for the fuller picture. Back in 2015, homes here averaged £209,788, so the typical sold price has climbed about 50.2% since then, roughly 4.1% a year.
Frequently asked questions about Burnham
What is the average price for a property for sale in Burnham?
The average price for a property for sale in Burnham is £325,833. This amount is 15% lower than the average price in Dartford. There are 1,449 property listings for sale in Burnham.
What streets have the most expensive properties for sale in Burnham?
The streets with the most expensive properties for sale in Burnham are Avonmouth Road at an average of £1,260,000, Priory Road at an average of £376,666 and Allium Rise at an average of £278,750.
What streets have the most affordable properties for sale in Burnham?
The streets with the most affordable properties for sale in Burnham are Riverside Wharf at an average of £254,250 and Creek Mill Way at an average of £270,500.
Which train stations are available in or near Burnham?
Some of the train stations available in or near Burnham are Dartford, Slade Green and Crayford.
Property Price Paid in Burnham by Year
The average sold property price by year was:
| Year | Average Sold Price | Price Change |
Sold Properties
|
|---|---|---|---|
| 2025 | £315,000 | -32% |
8 Properties |
| 2024 | £414,857 | 43% |
7 Properties |
| 2023 | £236,416 | -7% |
6 Properties |
| 2022 | £252,705 | -6% |
17 Properties |
| 2021 | £268,636 | -1% |
11 Properties |
| 2020 | £270,000 | 4% |
11 Properties |
| 2019 | £259,097 | 0,4% |
18 Properties |
| 2018 | £258,076 | 2% |
13 Properties |
| 2017 | £252,600 | 14% |
11 Properties |
| 2016 | £216,624 | 3% |
163 Properties |
Property Price per Property Type in Burnham
Here you can find historic sold price data in order to help with your property search.
The average Property Paid Price for specific property types in the last three years are:
| Property Type | Average Sold Price | Sold Properties |
|---|---|---|
| Terraced House | £430,000.00 | 1 Terraced House |
| Flat | £320,625.00 | 20 Flats |
