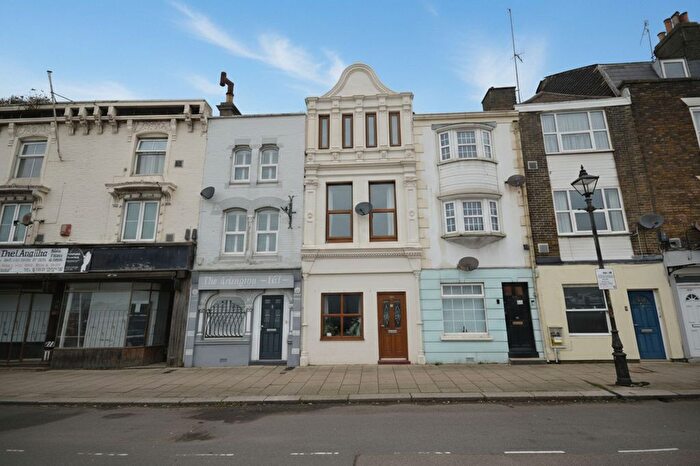
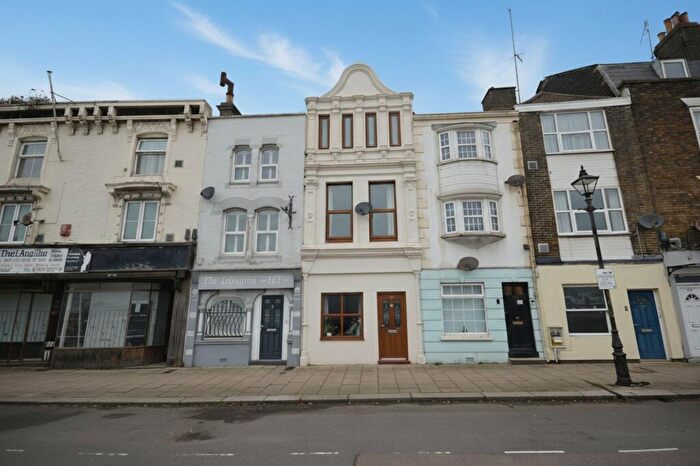
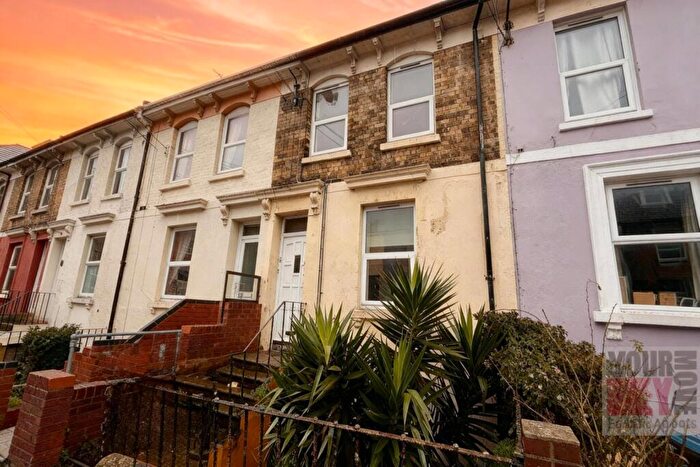
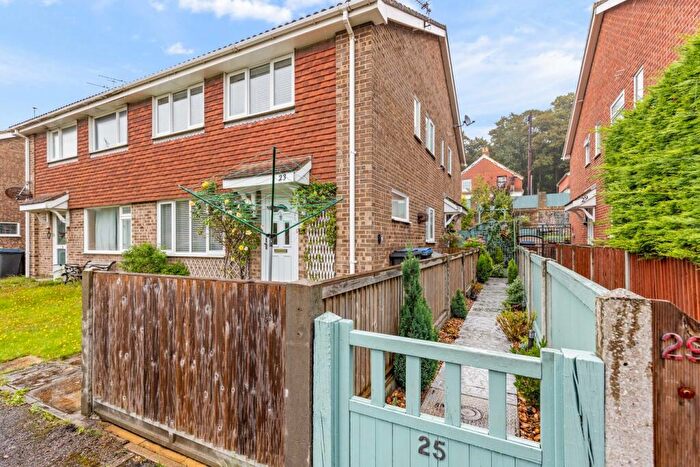
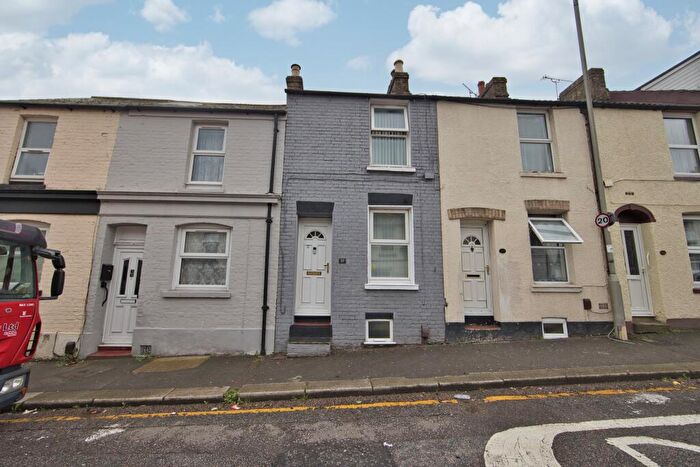
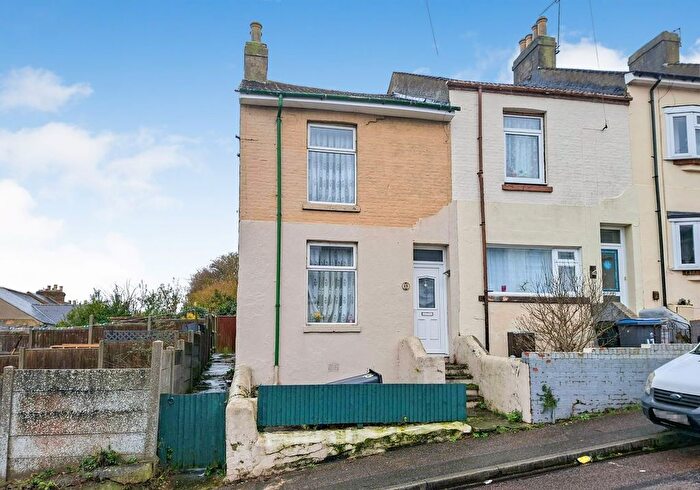
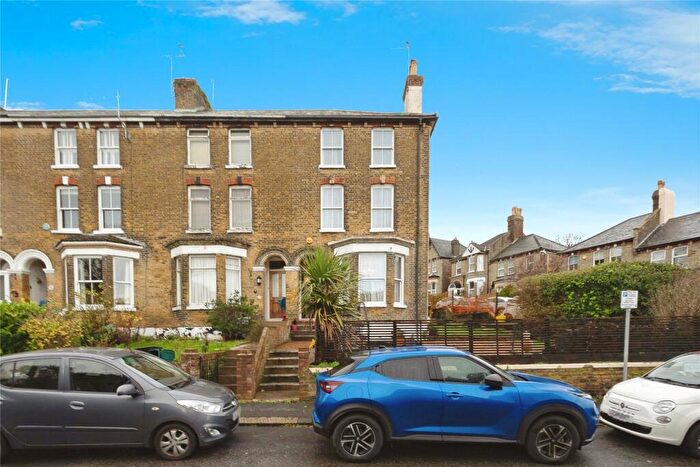
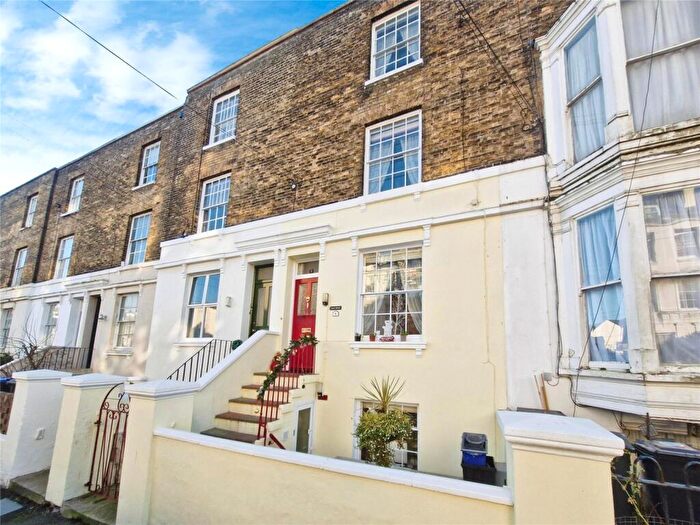
Houses for sale & to rent in Castle, Dover
House Prices in Castle
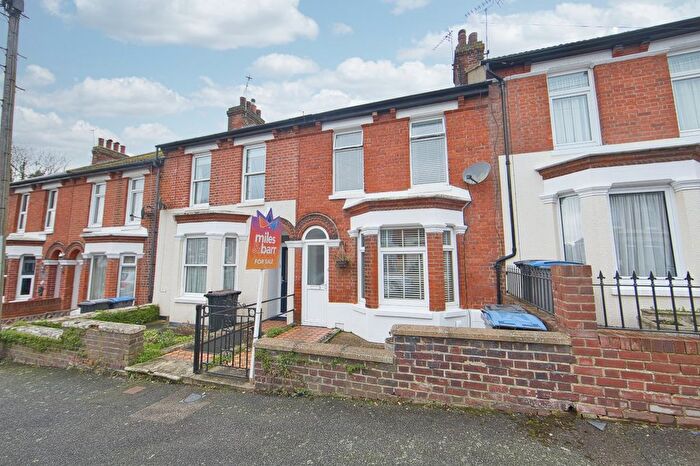
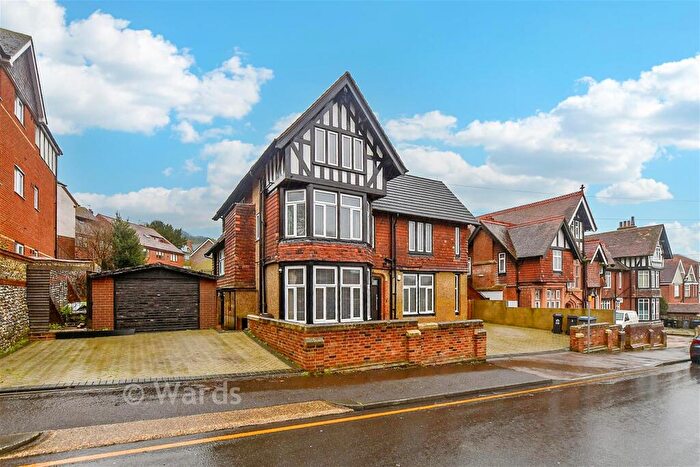
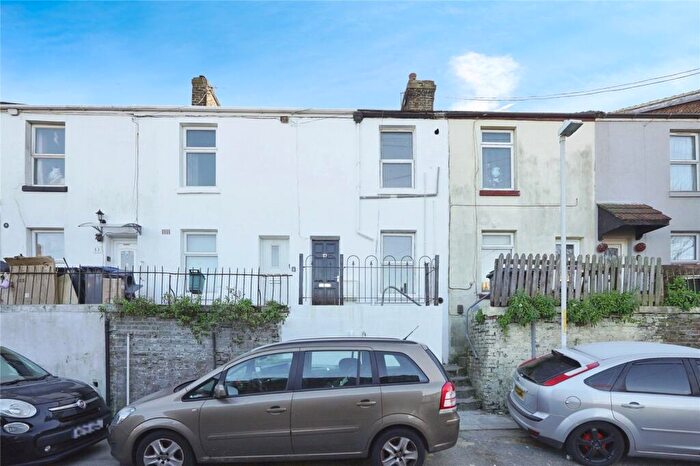
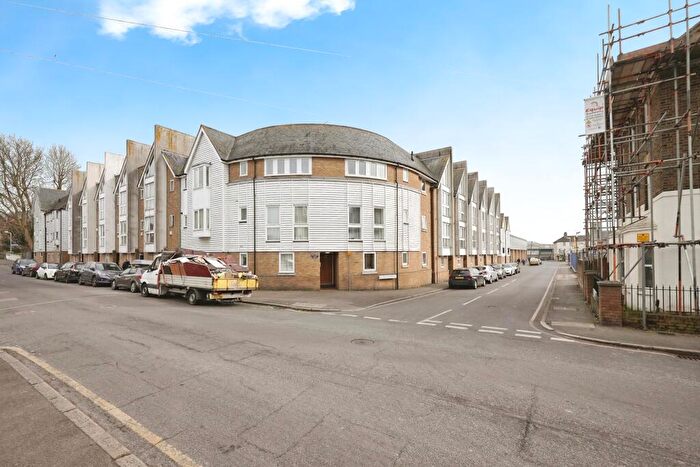
Properties in Castle have an average house price of £234,270.00 and had 109 Property Transactions within the last 3 years¹.
Castle is an area in Dover, Kent with 1,197 households², where the most expensive property was sold for £800,000.00.
Properties for sale in Castle
Roads and Postcodes in Castle
Navigate through our locations to find the location of your next house in Castle, Dover for sale or to rent.
| Streets | Postcodes |
|---|---|
| Athol Terrace | CT16 1LT |
| Bench Street | CT16 1JH |
| Biggin Street | CT16 1BU CT16 1DB |
| Camden Crescent | CT16 1LE |
| Cannon Street | CT16 1BY CT16 1BZ |
| Castle Avenue | CT16 1EZ CT16 1HA |
| Castle Hill Road | CT16 1QG CT16 1QN CT16 1QW CT16 1QY |
| Castle Street | CT16 1NZ CT16 1PJ CT16 1PT CT16 1PW CT16 1QH |
| Castlemount Road | CT16 1SP CT16 1TX |
| Caves Court | CT16 1AH CT16 1AN |
| Connaught Road | CT16 1HB CT16 1HF |
| Dolphin Passage | CT16 1PP |
| East Cliff | CT16 1LS CT16 1LU CT16 1LX |
| Eastbrook Place | CT16 1RP |
| Flying Horse Lane | CT16 1HG |
| Godwyne Close | CT16 1RX |
| Harold Street | CT16 1SA CT16 1SB CT16 1SD CT16 1SF CT16 1SU |
| Heritage Gardens | CT16 1AL |
| King Street | CT16 1NR CT16 1NU CT16 1NW |
| Laureston Place | CT16 1QX |
| Leyburne Road | CT16 1SH CT16 1SL |
| Maison Dieu Road | CT16 1RR CT16 1RT CT16 1RU CT16 1RW CT16 1TU |
| Market Square | CT16 1NG CT16 1NY |
| Monastery Avenue | CT16 1AB |
| Old Charlton Road | CT16 2QA CT16 2QD CT16 2QQ |
| Park Avenue | CT16 1HD |
| Pencester Court | CT16 1PG |
| Pharos Drive | CT16 1AF |
| Queens Courtyard | CT17 9BF |
| Queens Gardens | CT17 9AH |
| Russell Street | CT16 1PX CT16 1QB |
| Samphire Court | CT16 1AJ |
| Stembrook Court | CT16 1PE |
| Taswell Close | CT16 1SQ |
| Taswell Street | CT16 1SG |
| The Gateway | CT16 1LG CT16 1LH CT16 1LJ CT16 1LL CT16 1LQ |
| The Paddock | CT16 1RN |
| Victoria Park | CT16 1QR CT16 1QS |
| Worthington Street | CT17 9AF CT17 9AQ |
Transport near Castle
- FAQ
- Price Paid By Year
- Property Type Price
Frequently asked questions about Castle
What is the average price for a property for sale in Castle?
The average price for a property for sale in Castle is £234,270. This amount is 15% lower than the average price in Dover. There are 1,353 property listings for sale in Castle.
What streets have the most expensive properties for sale in Castle?
The streets with the most expensive properties for sale in Castle are Park Avenue at an average of £800,000, Monastery Avenue at an average of £552,500 and Pharos Drive at an average of £550,000.
What streets have the most affordable properties for sale in Castle?
The streets with the most affordable properties for sale in Castle are Caves Court at an average of £69,000, Cannon Street at an average of £122,000 and Godwyne Close at an average of £150,000.
Which train stations are available in or near Castle?
Some of the train stations available in or near Castle are Dover Priory, Kearsney and Martin Mill.
Property Price Paid in Castle by Year
The average sold property price by year was:
| Year | Average Sold Price | Price Change |
Sold Properties
|
|---|---|---|---|
| 2025 | £219,865 | -9% |
26 Properties |
| 2024 | £240,367 | 2% |
53 Properties |
| 2023 | £235,984 | 7% |
30 Properties |
| 2022 | £219,892 | 17% |
65 Properties |
| 2021 | £181,432 | -18% |
88 Properties |
| 2020 | £214,973 | 15% |
40 Properties |
| 2019 | £182,287 | -8% |
58 Properties |
| 2018 | £196,747 | 4% |
49 Properties |
| 2017 | £188,630 | 15% |
57 Properties |
| 2016 | £160,133 | 12% |
48 Properties |
| 2015 | £141,543 | 9% |
68 Properties |
| 2014 | £129,273 | -8% |
64 Properties |
| 2013 | £139,896 | 18% |
46 Properties |
| 2012 | £115,337 | -12% |
37 Properties |
| 2011 | £129,071 | -47% |
30 Properties |
| 2010 | £189,888 | 26% |
27 Properties |
| 2009 | £140,413 | -5% |
26 Properties |
| 2008 | £147,730 | -9% |
41 Properties |
| 2007 | £160,553 | 11% |
84 Properties |
| 2006 | £143,218 | -2% |
88 Properties |
| 2005 | £146,517 | 2% |
68 Properties |
| 2004 | £143,886 | 20% |
63 Properties |
| 2003 | £114,729 | -2% |
75 Properties |
| 2002 | £117,432 | 24% |
67 Properties |
| 2001 | £88,679 | 6% |
46 Properties |
| 2000 | £83,597 | -12% |
58 Properties |
| 1999 | £93,681 | 7% |
73 Properties |
| 1998 | £87,262 | 21% |
51 Properties |
| 1997 | £69,180 | 31% |
44 Properties |
| 1996 | £47,972 | -3% |
44 Properties |
| 1995 | £49,649 | - |
42 Properties |
Property Price per Property Type in Castle
Here you can find historic sold price data in order to help with your property search.
The average Property Paid Price for specific property types in the last three years are:
| Property Type | Average Sold Price | Sold Properties |
|---|---|---|
| Semi Detached House | £395,833.00 | 6 Semi Detached Houses |
| Detached House | £506,611.00 | 9 Detached Houses |
| Terraced House | £246,131.00 | 25 Terraced Houses |
| Flat | £180,401.00 | 69 Flats |

