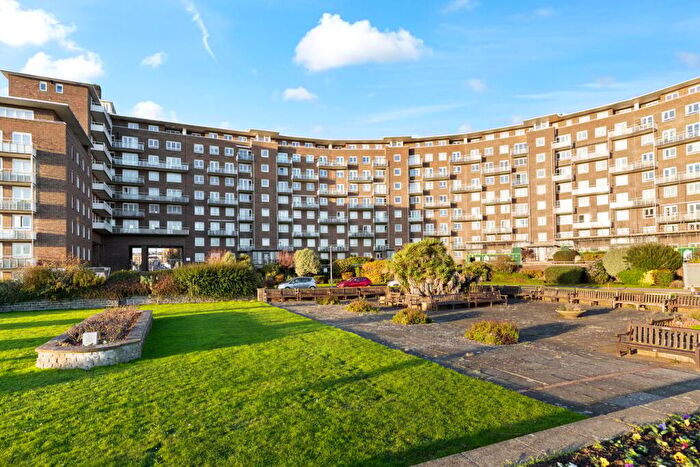
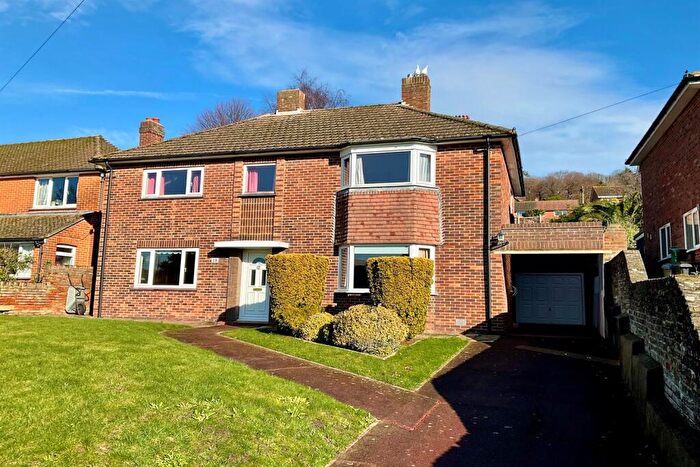
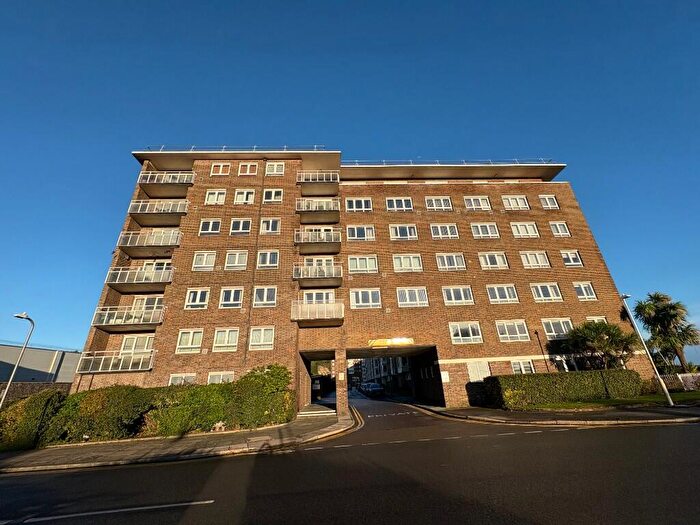
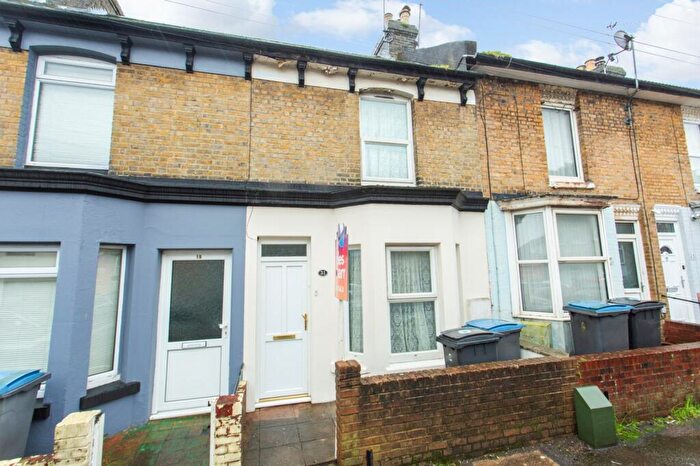
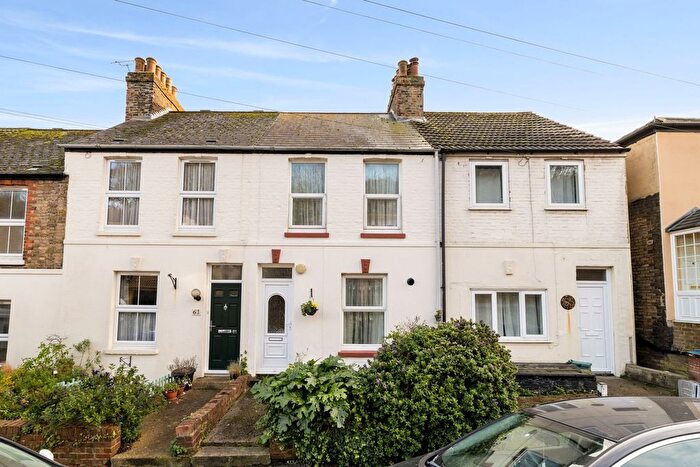
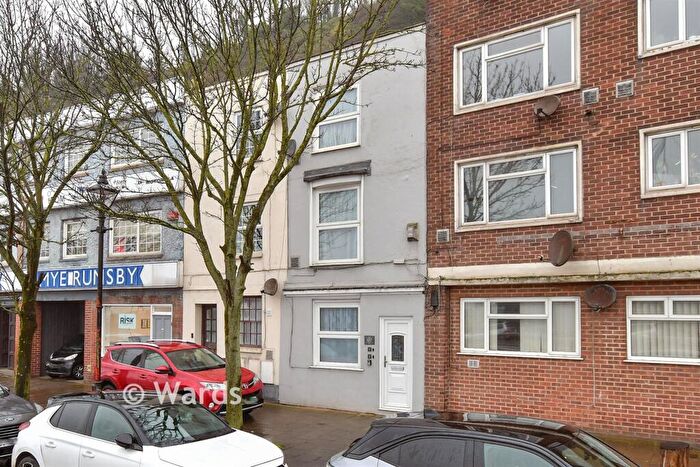
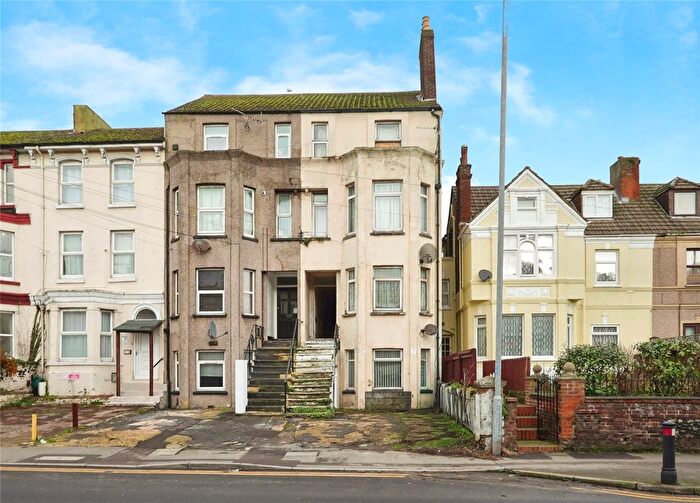
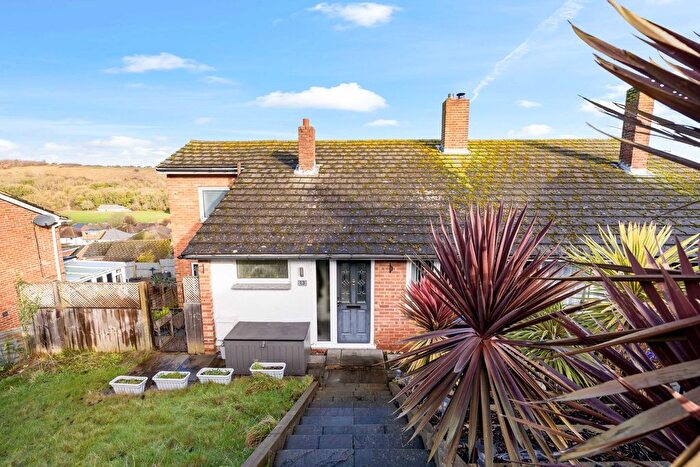
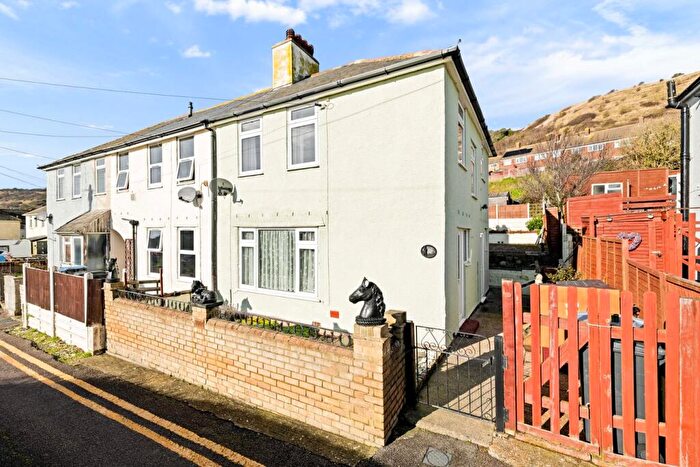
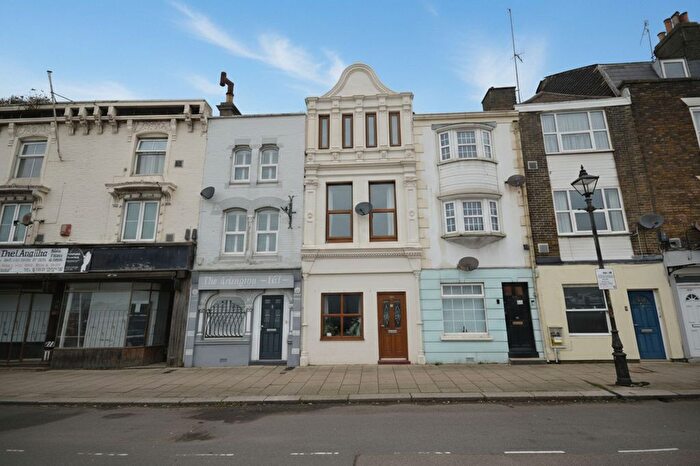
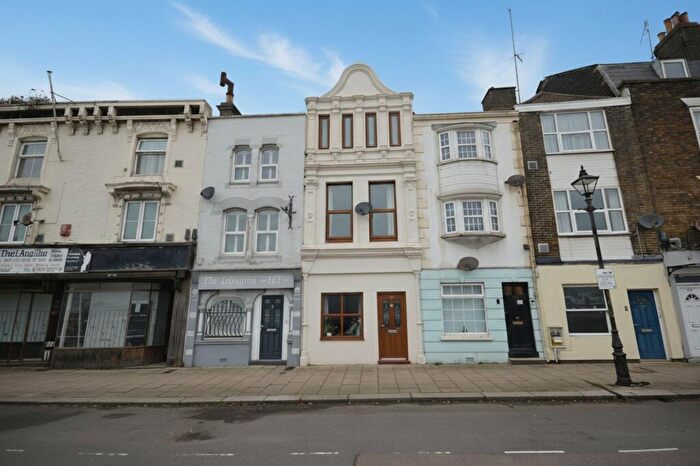
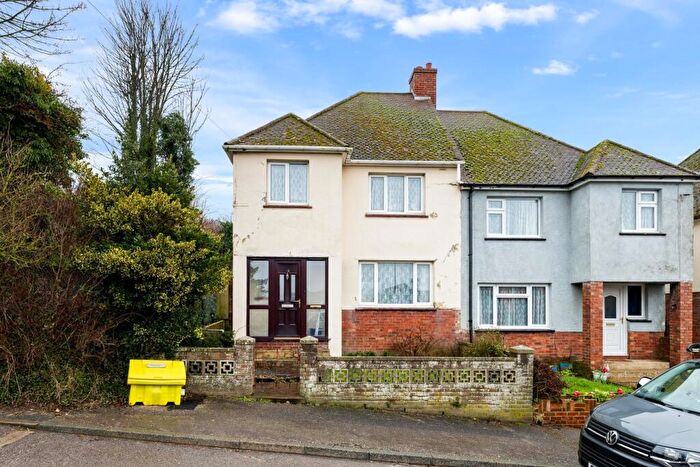
Houses for sale & to rent in Town & Castle, Dover
House Prices in Town & Castle
Properties in Town & Castle have an average house price of £196,714.00 and had 7 Property Transactions within the last 3 years¹.
Town & Castle is an area in Dover, Kent with 317 households², where the most expensive property was sold for £295,000.00.
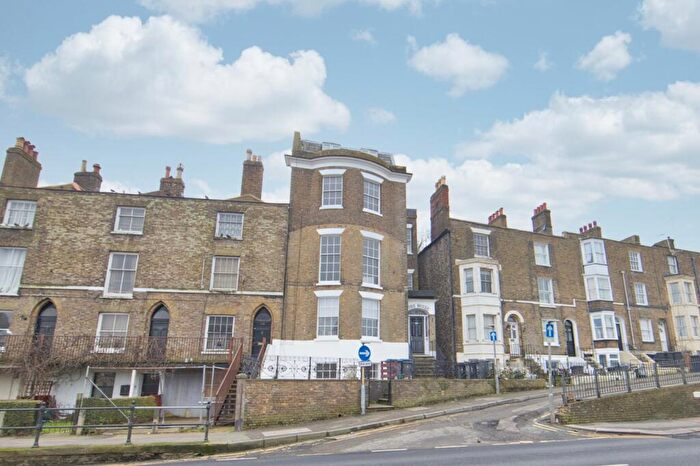
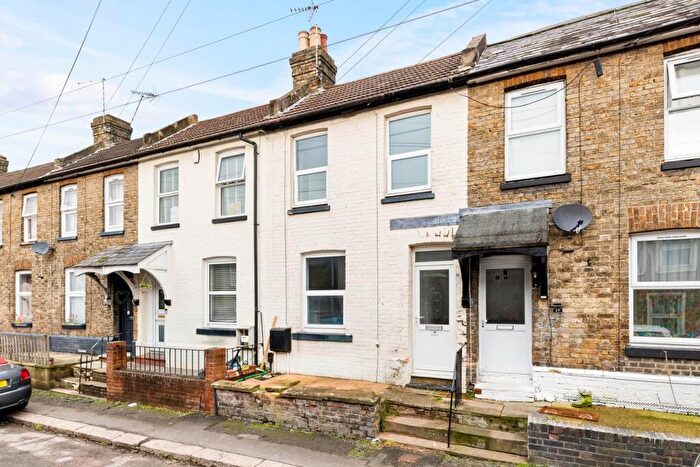
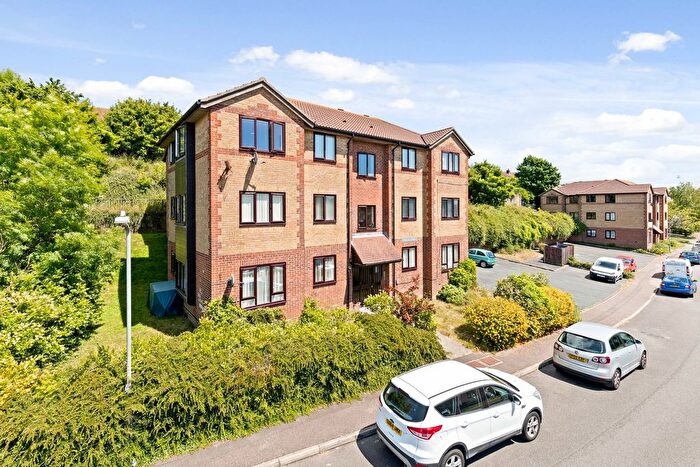
Properties for sale in Town & Castle
Roads and Postcodes in Town & Castle
Navigate through our locations to find the location of your next house in Town & Castle, Dover for sale or to rent.
| Streets | Postcodes |
|---|---|
| Albany Place | CT17 9AU |
| Archcliffe Road | CT17 9EL CT17 9EN |
| Ashen Tree Lane | CT16 1QL CT16 1RS |
| Bastion Road | CT17 9DZ |
| Battle Of Britain Flats | CT17 9AR |
| Bench Street | CT16 1JW |
| Biggin Street | CT16 1AU CT16 1BD CT16 1BJ CT16 1BX CT16 1DW |
| Bulwark Street | CT17 9TZ |
| Cambridge Road | CT17 9BJ CT17 9BS CT17 9BY |
| Cambridge Terrace | CT16 1JT |
| Cannon Street | CT16 1BN CT16 1DA CT16 1ST |
| Castle Street | CT16 1PA CT16 1PD CT16 1TN |
| Channel View Road | CT17 9TJ CT17 9TP CT17 9TW |
| Chapel Lane | CT16 1NP |
| Chapel Place | CT17 9AS |
| Church Street | CT16 1LY |
| Citadel Crescent | CT17 9DT |
| Clarence Place | CT17 9DQ |
| Clarendon Street | CT17 9UP CT17 9UR CT17 9UT CT17 9UU |
| Connaught Road | CT16 1HH |
| Cowgate Hill | CT17 9AX |
| Crosswall Quay | CT17 9BN |
| Durham Hill | CT17 9TS |
| Eastern Docks | CT16 1JA CT16 1PS |
| Effingham Crescent | CT17 9RL CT17 9RN CT17 9RP |
| Elizabeth Street | CT17 9FE |
| Esplanade | CT17 9FS |
| Fishmongers Lane | CT16 1FL |
| Folkestone Road | CT17 9FB CT17 9FD CT17 9FH CT17 9RU CT17 9RY |
| Gloster Way | CT17 9ER |
| Godwyne Road | CT16 1AW |
| Granville Dock | CT17 9DG |
| Harold Street | CT16 1AX |
| Hawkesbury Street | CT17 9EG |
| High Street | CT16 1DL |
| Hole Coombe Walk | CT15 5FT |
| Jen Place | CT17 9TA |
| Laureston Place | CT16 1QU |
| Leyburne Road | CT16 1SN CT16 1AS |
| Limekiln Street | CT17 9EF |
| Lord Warden Square | CT17 9EQ |
| Maison Dieu Gardens | CT16 1TG |
| Maison Dieu Road | CT16 1DH CT16 1QQ CT16 1RH CT16 1RL |
| Marina Curve | CT17 9FQ |
| Marine Parade | CT16 1LW |
| Market Square | CT16 1LZ CT16 1NB CT16 1ND CT16 1NH CT16 1NJ CT16 1NX CT16 1PH |
| New Bridge | CT16 1JS CT16 1JZ |
| New Street | CT17 9AJ CT17 9AL |
| North Military Road | CT17 9BQ |
| Old Folkestone Road | CT17 9EZ |
| Pencester Gardens | CT16 1NS |
| Pencester Road | CT16 1BT CT16 1FA |
| Princes Street | CT17 9AZ |
| Priory Road | CT17 9RG |
| Priory Station Approach | CT17 9SB |
| Priory Street | CT17 9AA |
| Russell Street | CT16 1PY |
| Samphire Road | CT17 9FL |
| Snargate Street | CT17 9AP |
| South Military Road | CT17 9UE |
| St Davids Avenue | CT17 9JS |
| St Giles Close | CT17 9HZ |
| St James Street | CT16 1QF CT16 1QD |
| St Johns Road | CT17 9SH |
| St Martins Close | CT17 9HY |
| Taswell Street | CT16 1SE |
| Townwall Street | CT16 1LN |
| Union Street | CT17 9FJ |
| Vale View Road | CT17 9NR |
| Victoria Park Mews | CT16 1QP |
| Waterloo Crescent | CT16 1LA CT17 9BP CT17 9BT CT17 9BU CT17 9BW |
| Western Docks | CT17 9DH CT17 9DN CT17 9TF |
| Winchelsea Works | CT17 9SS |
| Worthington Street | CT17 9AG |
| York Street | CT17 9FA |
| CT16 1HU CT16 1HZ CT16 1PF CT17 9FP |
Transport near Town & Castle
- FAQ
- Price Paid By Year
- Property Type Price
Frequently asked questions about Town & Castle
What is the average price for a property for sale in Town & Castle?
The average price for a property for sale in Town & Castle is £196,714. This amount is 29% lower than the average price in Dover. There are 3,116 property listings for sale in Town & Castle.
What streets have the most expensive properties for sale in Town & Castle?
The street with the most expensive properties for sale in Town & Castle is Connaught Road at an average of £295,000.
What streets have the most affordable properties for sale in Town & Castle?
The street with the most affordable properties for sale in Town & Castle is Cambridge Terrace at an average of £205,200.
Which train stations are available in or near Town & Castle?
Some of the train stations available in or near Town & Castle are Dover Priory, Kearsney and Martin Mill.
Property Price Paid in Town & Castle by Year
The average sold property price by year was:
| Year | Average Sold Price | Price Change |
Sold Properties
|
|---|---|---|---|
| 2025 | £185,000 | -27% |
1 Property |
| 2024 | £235,500 | 23% |
2 Properties |
| 2023 | £180,250 | -1% |
4 Properties |
| 2022 | £181,200 | 3% |
10 Properties |
| 2021 | £176,135 | 7% |
18 Properties |
| 2020 | £163,350 | 16% |
10 Properties |
| 2019 | £137,100 | 7% |
5 Properties |
| 2018 | £128,000 | -95% |
1 Property |
| 2017 | £250,000 | 52% |
1 Property |
| 2016 | £121,000 | -7% |
1 Property |
| 2010 | £129,640 | -89% |
1 Property |
| 2008 | £245,000 | -139% |
2 Properties |
| 2007 | £585,000 | 26% |
1 Property |
| 2005 | £435,000 | 69% |
3 Properties |
| 2003 | £136,166 | - |
3 Properties |
Property Price per Property Type in Town & Castle
Here you can find historic sold price data in order to help with your property search.
The average Property Paid Price for specific property types in the last three years are:
| Property Type | Average Sold Price | Sold Properties |
|---|---|---|
| Detached House | £295,000.00 | 1 Detached House |
| Flat | £180,333.00 | 6 Flats |

