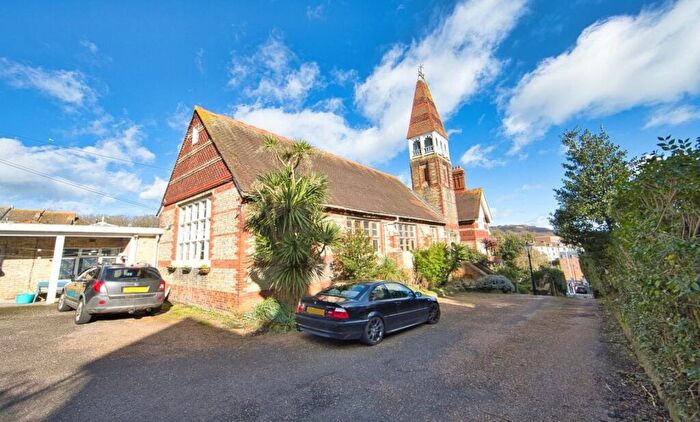
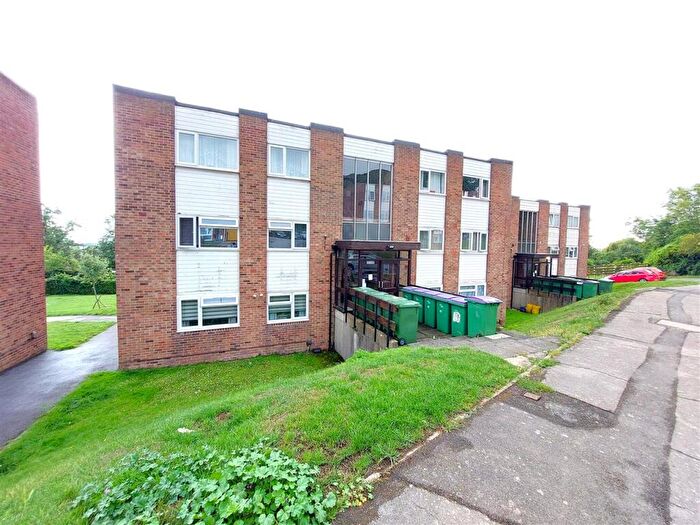
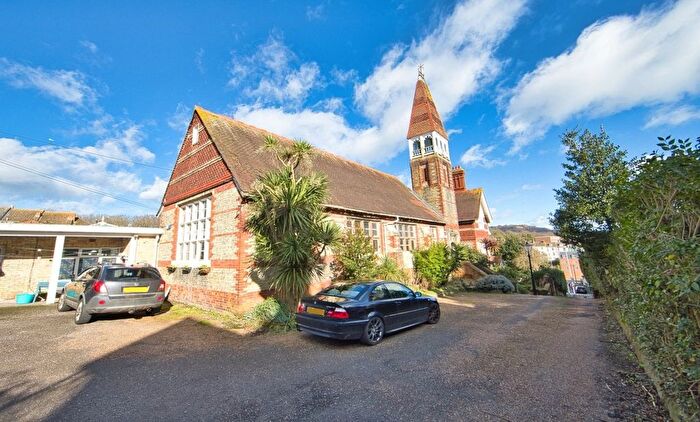
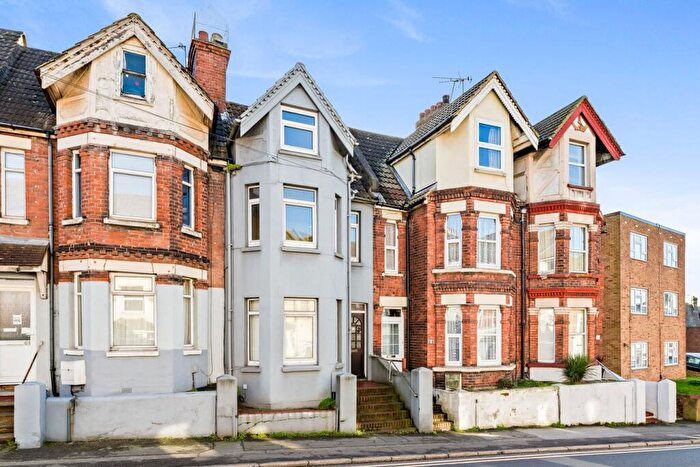
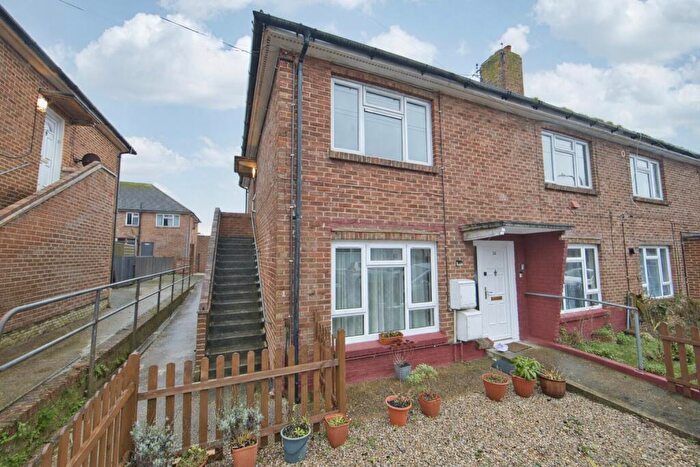
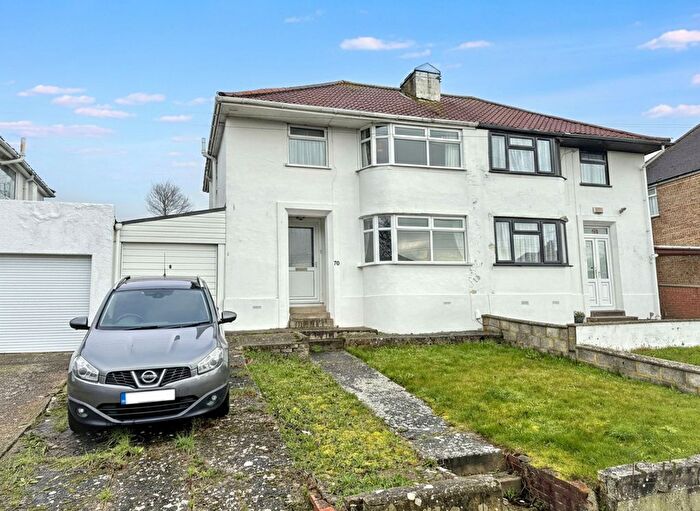
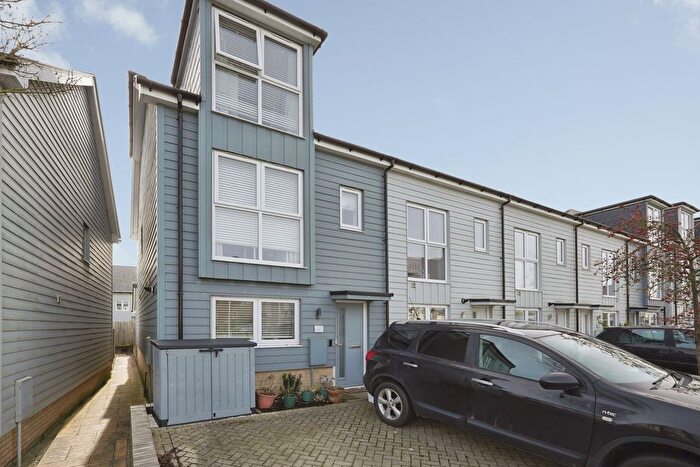
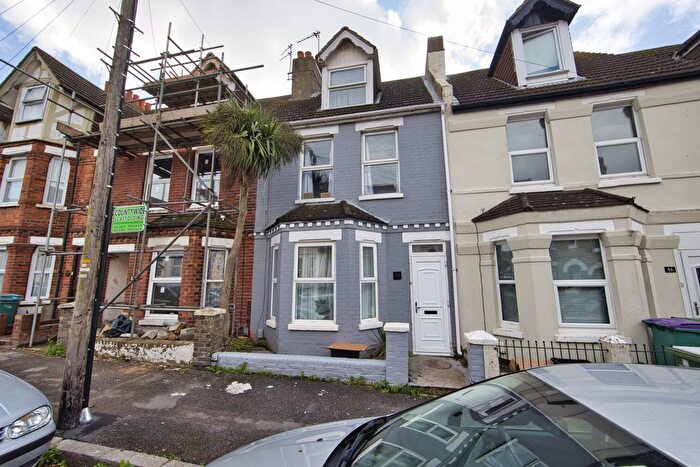
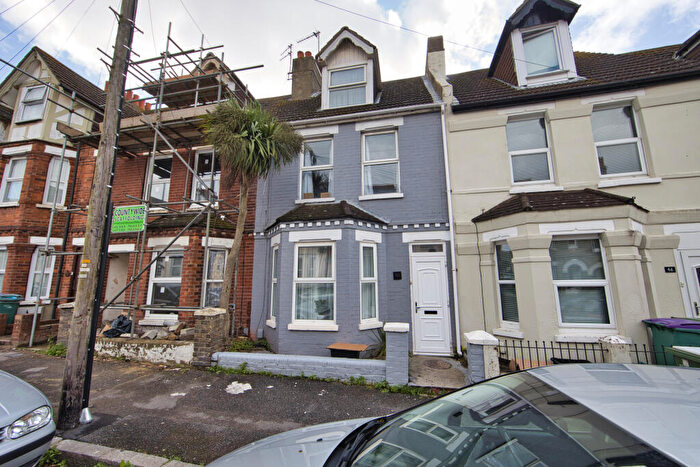
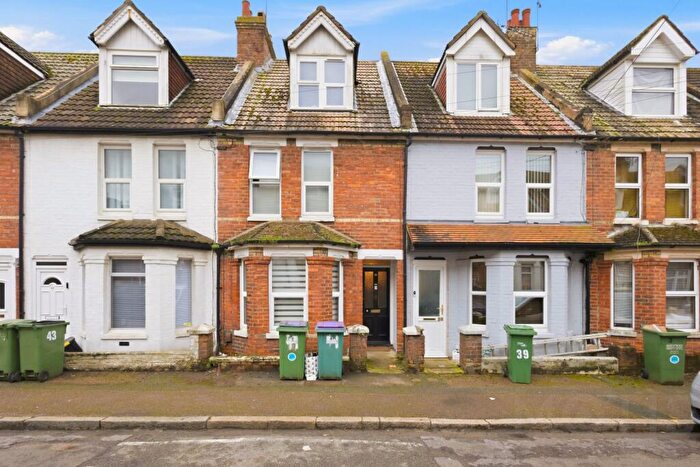
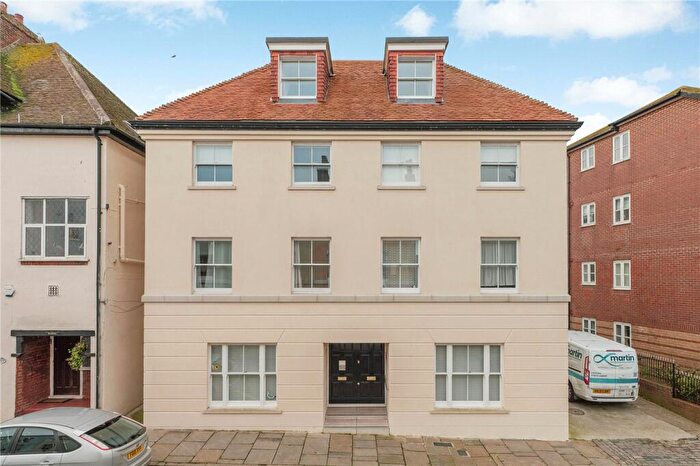
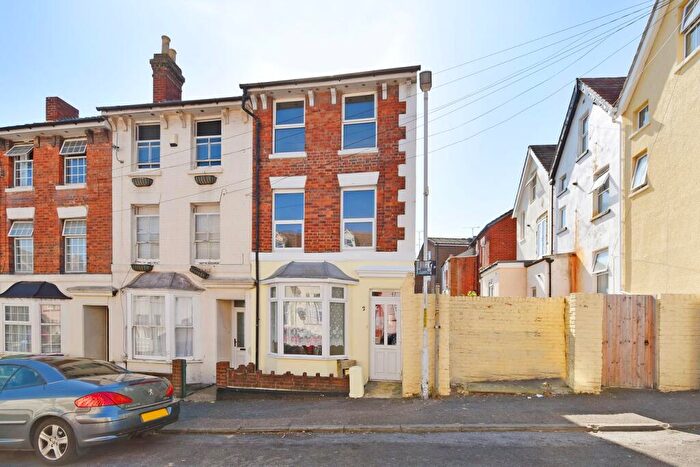
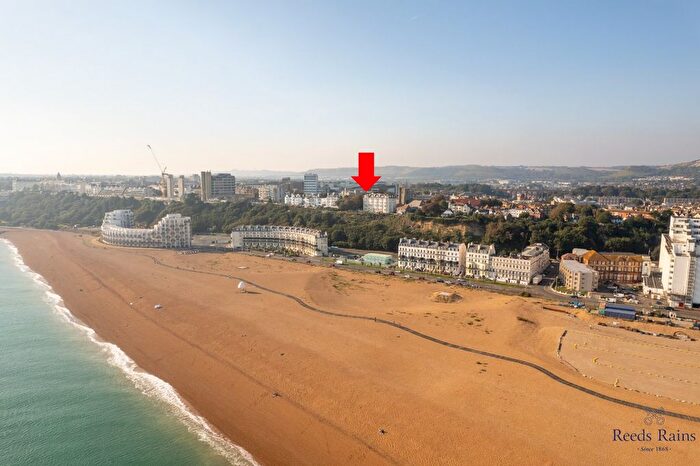
Houses for sale & to rent in East Folkestone, Folkestone
House Prices in East Folkestone
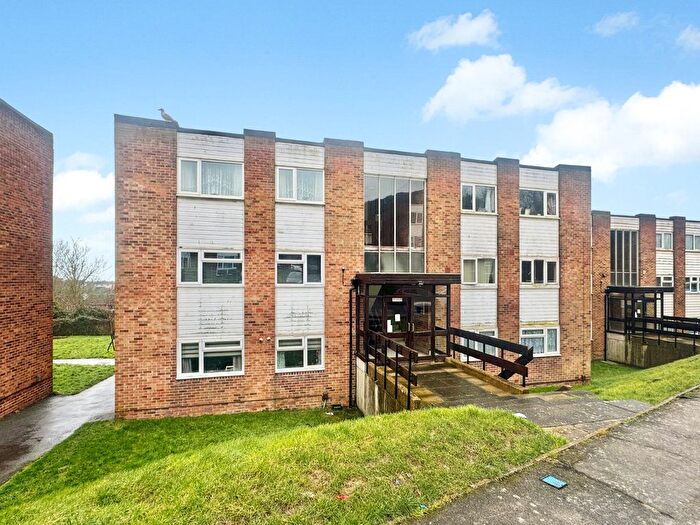
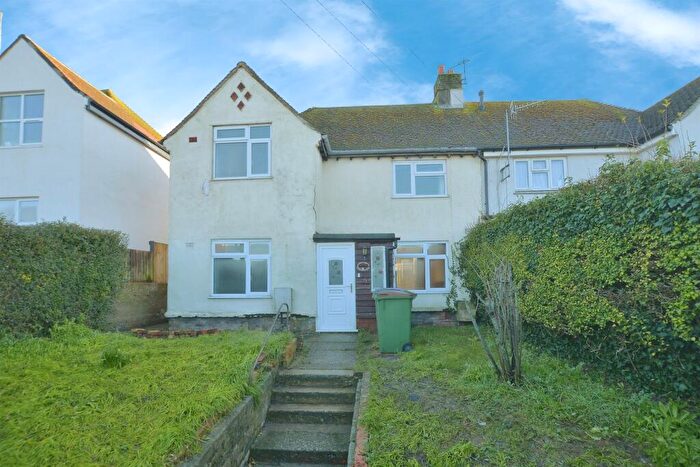
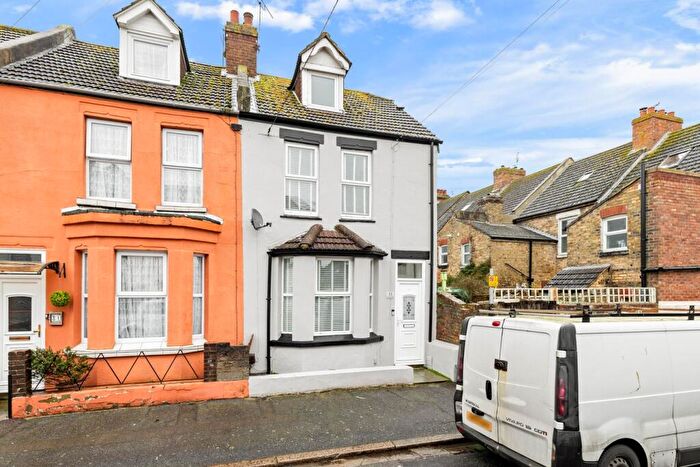
Properties in East Folkestone have an average house price of £273,750.00 and had 4 Property Transactions within the last 3 years¹.
East Folkestone is an area in Folkestone, Kent with 378 households², where the most expensive property was sold for £360,000.00.
Properties for sale in East Folkestone
Roads and Postcodes in East Folkestone
Navigate through our locations to find the location of your next house in East Folkestone, Folkestone for sale or to rent.
| Streets | Postcodes |
|---|---|
| Barnfield Road | CT19 5SU |
| Black Bull Road | CT19 5SH |
| Bridge Street | CT19 6HA |
| Broadmead Road | CT19 5FU |
| Canterbury Close | CT19 5EL |
| Canterbury Road | CT19 5SR |
| Downs Road | CT19 5PY |
| Gladstone Road | CT19 5NE CT19 5NF |
| Green Lane | CT19 6BW CT19 6HD CT19 6QS |
| Holly Close | CT19 6JQ |
| Holywell Avenue | CT19 6LA CT19 6SH |
| Invicta Road | CT19 6EW |
| Kitchener Square | CT19 6JB |
| Moat Farm Close | CT19 5DQ |
| Palmerston Street | CT19 5SN |
| Park Farm Close | CT19 5DU |
| Park Farm Road | CT19 5DR CT19 5DS CT19 5DW CT19 5EH CT19 5EY |
| Peto Close | CT19 5SQ CT19 5ST |
| Princess Street | CT19 6QP |
| St Saviours Close | CT19 5TQ |
| Walter Tull Way | CT19 5UN |
| Walton Manor Close | CT19 5FQ CT19 5SX |
| Watkin Road | CT19 5WG |
| Wood Avenue | CT19 6HS |
Transport near East Folkestone
- FAQ
- Price Paid By Year
- Property Type Price
Frequently asked questions about East Folkestone
What is the average price for a property for sale in East Folkestone?
The average price for a property for sale in East Folkestone is £273,750. This amount is 12% lower than the average price in Folkestone. There are 2,240 property listings for sale in East Folkestone.
Which train stations are available in or near East Folkestone?
Some of the train stations available in or near East Folkestone are Folkestone Central, Folkestone West and Sandling.
Property Price Paid in East Folkestone by Year
The average sold property price by year was:
| Year | Average Sold Price | Price Change |
Sold Properties
|
|---|---|---|---|
| 2023 | £273,750 | -36% |
4 Properties |
| 2022 | £373,333 | 44% |
3 Properties |
| 2021 | £210,000 | 5% |
1 Property |
| 2019 | £199,666 | -13% |
3 Properties |
| 2018 | £225,000 | 24% |
1 Property |
| 2017 | £170,000 | -5% |
1 Property |
| 2015 | £178,000 | 8% |
1 Property |
| 2014 | £164,638 | 33% |
9 Properties |
| 2006 | £110,235 | 16% |
1 Property |
| 1998 | £93,000 | - |
2 Properties |
Property Price per Property Type in East Folkestone
Here you can find historic sold price data in order to help with your property search.
The average Property Paid Price for specific property types in the last three years are:
| Property Type | Average Sold Price | Sold Properties |
|---|---|---|
| Semi Detached House | £352,500.00 | 2 Semi Detached Houses |
| Terraced House | £195,000.00 | 2 Terraced Houses |

