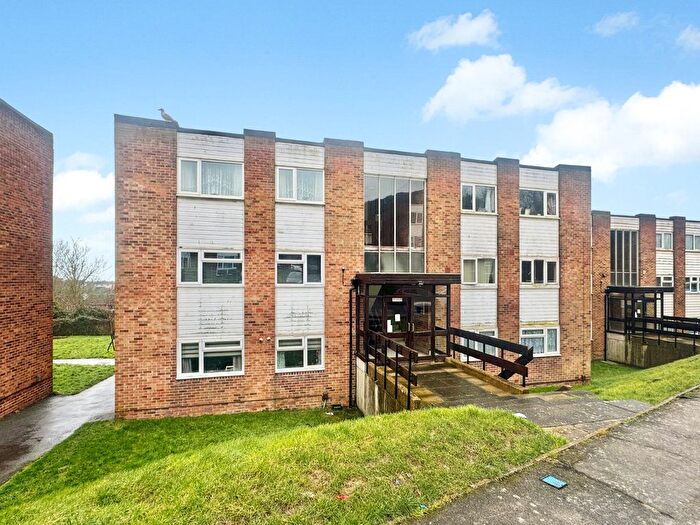
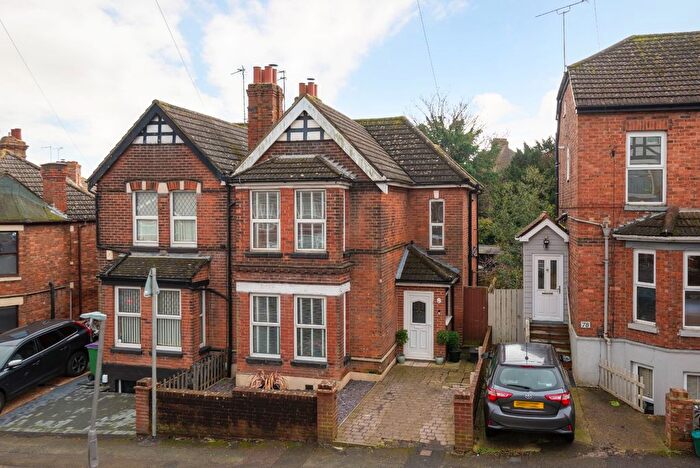
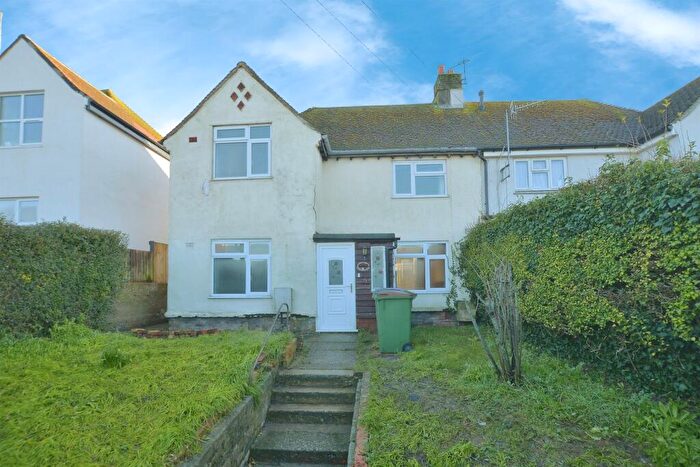
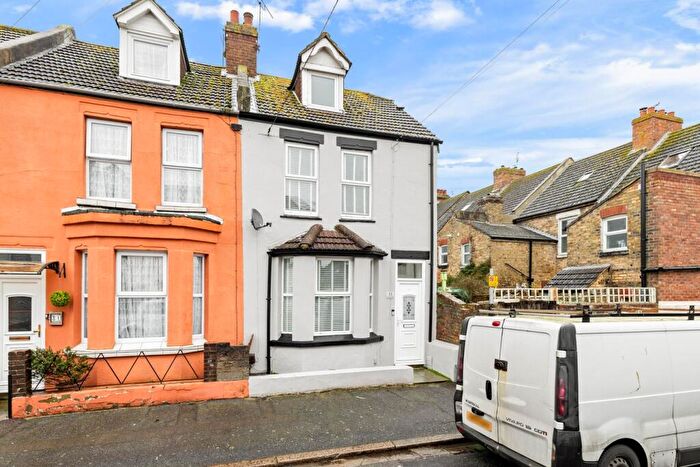
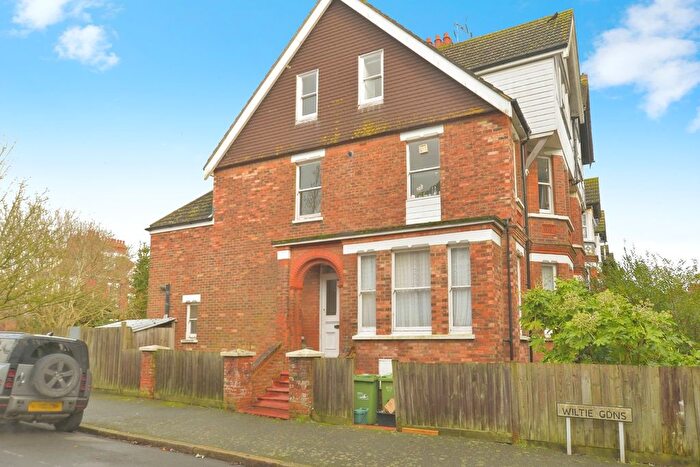
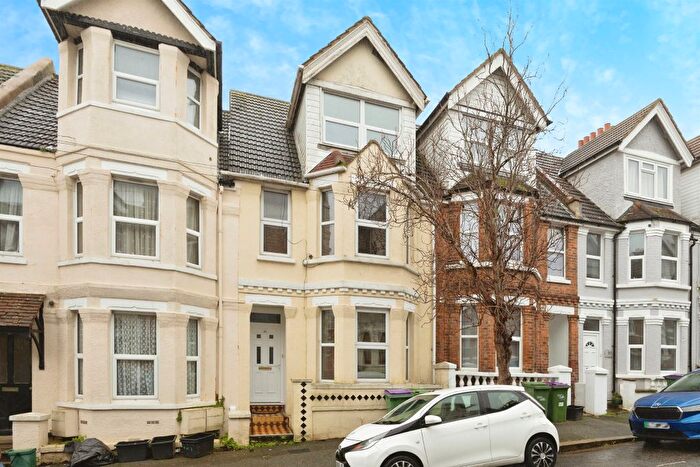
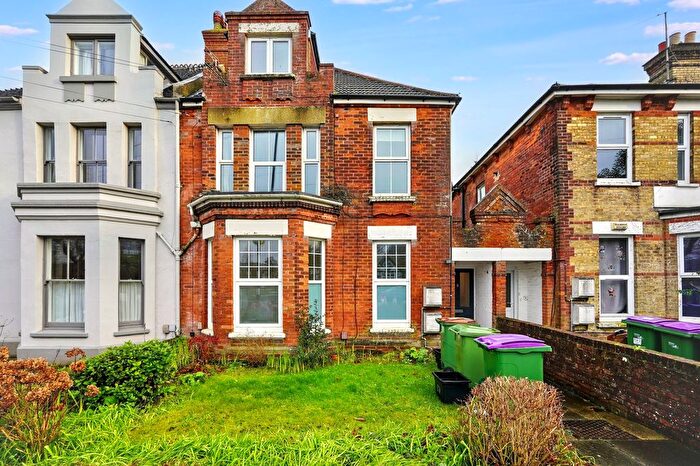
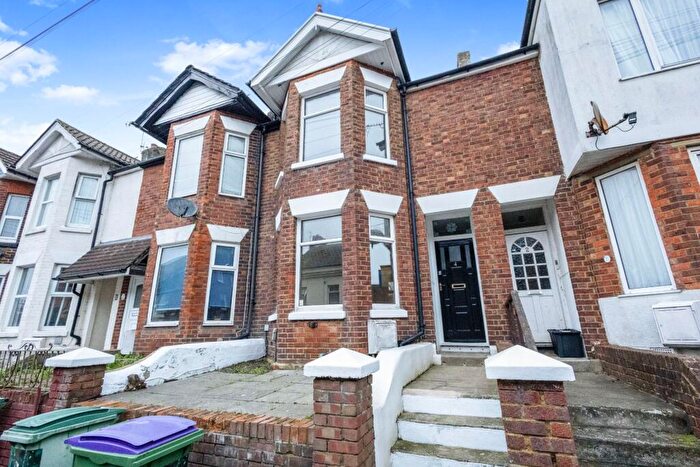
Houses for sale & to rent in Folkestone Foord, Folkestone
House Prices in Folkestone Foord
Properties in Folkestone Foord have an average house price of £237,580.00 and had 270 Property Transactions within the last 3 years¹.
Folkestone Foord is an area in Folkestone, Kent with 2,222 households², where the most expensive property was sold for £600,000.00.
Properties for sale in Folkestone Foord
Roads and Postcodes in Folkestone Foord
Navigate through our locations to find the location of your next house in Folkestone Foord, Folkestone for sale or to rent.
| Streets | Postcodes |
|---|---|
| Albert Road | CT19 5RF CT19 5RG |
| Albion Road | CT19 5SE |
| Alexandra Street | CT19 6EF CT19 6EG CT19 6EH |
| Allendale Street | CT19 5RE CT19 5RH |
| Archer Road | CT19 5RZ CT19 5SA |
| Arthur Street | CT19 6HE |
| Ash Tree Road | CT19 6ED |
| Athelstan Road | CT19 6EU |
| Baldwin Terrace | CT19 5RY |
| Black Bull Road | CT19 5NS CT19 5QL CT19 5QN CT19 5QP CT19 5QT CT19 5QU CT19 5QX |
| Bolton Road | CT19 5RX |
| Bonsor Road | CT19 5ET |
| Boscombe Road | CT19 5BD |
| Bournemouth Gardens | CT19 5BB |
| Bournemouth Road | CT19 5AZ |
| Bradstone Avenue | CT19 5AG CT19 5AQ |
| Brambledown | CT19 5SL |
| Bridge Street | CT19 6HB |
| Canterbury Road | CT19 5NG CT19 5NH CT19 5NJ CT19 5NL CT19 5NN CT19 5NR CT19 5NW CT19 5PF CT19 5PG CT19 5PH CT19 5PQ CT19 5UJ |
| Dawson Road | CT19 5RR CT19 5RS |
| Denmark Street | CT19 6EJ CT19 6EQ |
| Devon Road | CT19 5AH |
| Dover Road | CT19 6NG CT19 6NH |
| Eastfields | CT19 5RT CT19 5RU |
| Edward Road | CT19 5RQ |
| Elm Road | CT19 6EA |
| Ernwell Road | CT19 5NT |
| Ethelbert Road | CT19 6EX |
| Fernbank Crescent | CT19 5SF |
| Foord Road | CT19 5AB CT19 5AD CT19 5AE |
| Garden Road | CT19 5RA CT19 5RB CT19 5RD |
| Gladstone Road | CT19 5NQ |
| Greenfield Road | CT19 6EP CT19 6ER |
| Invicta Road | CT19 6EY |
| James Street | CT19 5NP |
| Jesmond Street | CT19 5QW |
| Joyes Road | CT19 6NU CT19 6NX |
| Linden Crescent | CT19 5RP CT19 5SB CT19 5SD |
| Marshall Street | CT19 6EN CT19 6ES CT19 6ET |
| Mead Road | CT19 5QY CT19 5QZ |
| Myrtle Road | CT19 6EE |
| Pavilion Road | CT19 5RL CT19 5RW |
| Princess Street | CT19 6EB |
| Radnor Park Road | CT19 5BJ CT19 5BS CT19 5BT CT19 5BU |
| Russell Road | CT19 5RJ |
| Shepway Close | CT19 5SJ |
| Ship Street | CT19 5BE |
| Sidney Street | CT19 6HF CT19 6HG CT19 6HQ |
| St Johns Church Road | CT19 5BH CT19 5BQ |
| St Johns Terrace | CT19 5BG |
| Sussex Road | CT19 5AF |
| Walton Road | CT19 5QR CT19 5QS |
| Watkin Road | CT19 5EP CT19 5ER CT19 5ES |
Transport near Folkestone Foord
- FAQ
- Price Paid By Year
- Property Type Price
Frequently asked questions about Folkestone Foord
What is the average price for a property for sale in Folkestone Foord?
The average price for a property for sale in Folkestone Foord is £237,580. This amount is 24% lower than the average price in Folkestone. There are 2,368 property listings for sale in Folkestone Foord.
What streets have the most expensive properties for sale in Folkestone Foord?
The streets with the most expensive properties for sale in Folkestone Foord are St Johns Church Road at an average of £445,833, Bournemouth Road at an average of £377,971 and Boscombe Road at an average of £376,250.
What streets have the most affordable properties for sale in Folkestone Foord?
The streets with the most affordable properties for sale in Folkestone Foord are Edward Road at an average of £142,500, Ash Tree Road at an average of £150,000 and Marshall Street at an average of £166,111.
Which train stations are available in or near Folkestone Foord?
Some of the train stations available in or near Folkestone Foord are Folkestone Central, Folkestone West and Sandling.
Property Price Paid in Folkestone Foord by Year
The average sold property price by year was:
| Year | Average Sold Price | Price Change |
Sold Properties
|
|---|---|---|---|
| 2025 | £235,915 | 1% |
106 Properties |
| 2024 | £233,468 | -4% |
79 Properties |
| 2023 | £243,477 | 3% |
85 Properties |
| 2022 | £235,159 | 10% |
111 Properties |
| 2021 | £211,612 | 12% |
116 Properties |
| 2020 | £186,130 | 2% |
88 Properties |
| 2019 | £181,893 | 0,1% |
97 Properties |
| 2018 | £181,746 | 6% |
134 Properties |
| 2017 | £171,219 | 9% |
105 Properties |
| 2016 | £156,037 | 5% |
113 Properties |
| 2015 | £148,706 | 12% |
114 Properties |
| 2014 | £131,079 | 8% |
121 Properties |
| 2013 | £121,228 | 3% |
76 Properties |
| 2012 | £118,152 | -0,4% |
59 Properties |
| 2011 | £118,618 | -3% |
61 Properties |
| 2010 | £121,627 | -1% |
83 Properties |
| 2009 | £123,073 | -20% |
80 Properties |
| 2008 | £147,665 | 0,4% |
59 Properties |
| 2007 | £147,128 | 14% |
184 Properties |
| 2006 | £126,881 | 7% |
178 Properties |
| 2005 | £118,153 | 4% |
152 Properties |
| 2004 | £113,161 | 17% |
154 Properties |
| 2003 | £93,956 | 20% |
164 Properties |
| 2002 | £75,331 | 19% |
197 Properties |
| 2001 | £61,108 | 14% |
167 Properties |
| 2000 | £52,763 | 11% |
146 Properties |
| 1999 | £46,843 | 10% |
143 Properties |
| 1998 | £41,999 | 4% |
130 Properties |
| 1997 | £40,409 | 10% |
111 Properties |
| 1996 | £36,299 | 7% |
109 Properties |
| 1995 | £33,754 | - |
128 Properties |
Property Price per Property Type in Folkestone Foord
Here you can find historic sold price data in order to help with your property search.
The average Property Paid Price for specific property types in the last three years are:
| Property Type | Average Sold Price | Sold Properties |
|---|---|---|
| Semi Detached House | £343,037.00 | 27 Semi Detached Houses |
| Detached House | £257,625.00 | 4 Detached Houses |
| Terraced House | £232,370.00 | 217 Terraced Houses |
| Flat | £155,901.00 | 22 Flats |

