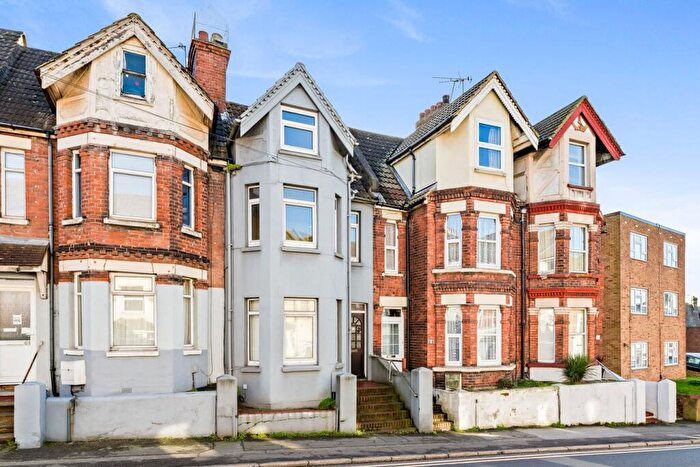
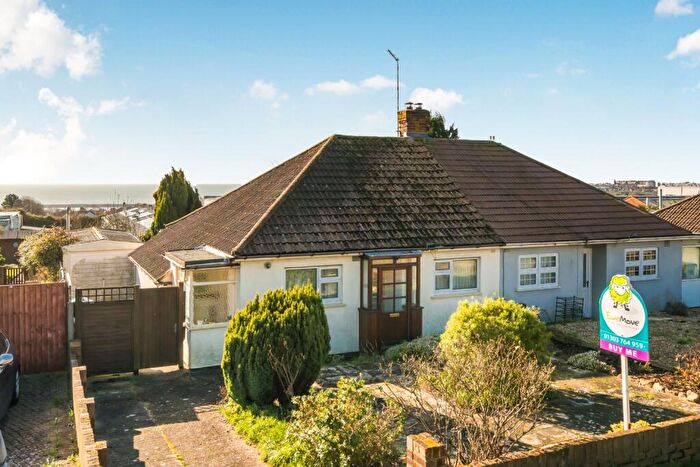
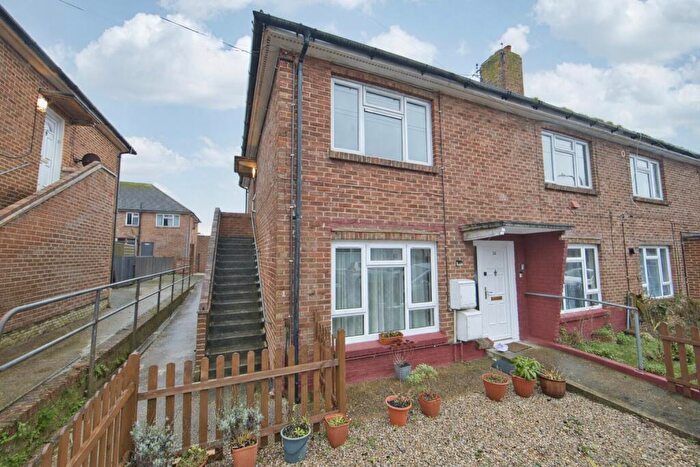
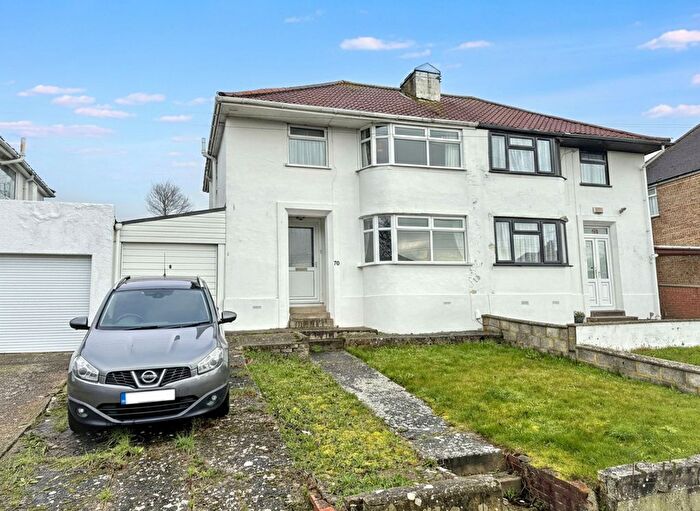
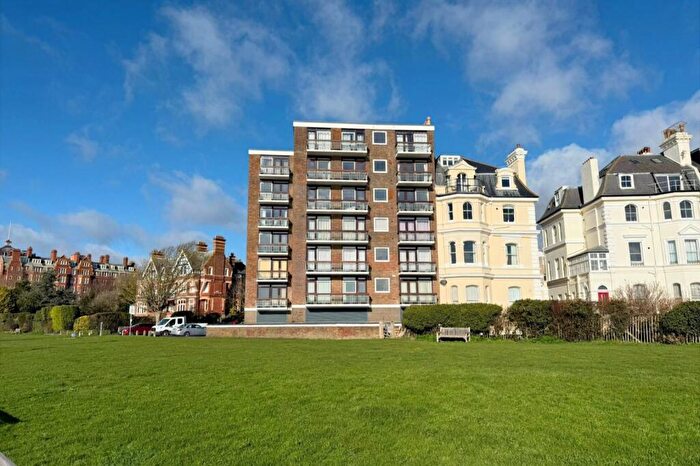
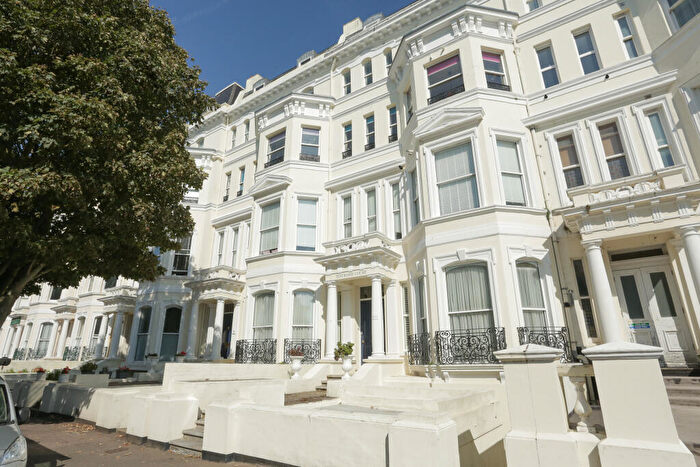
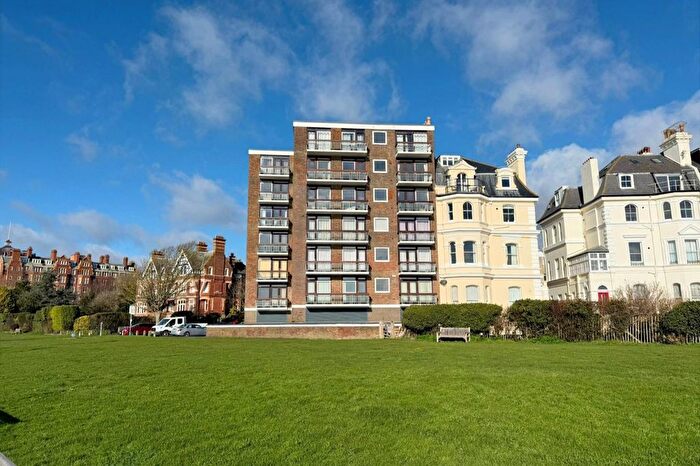
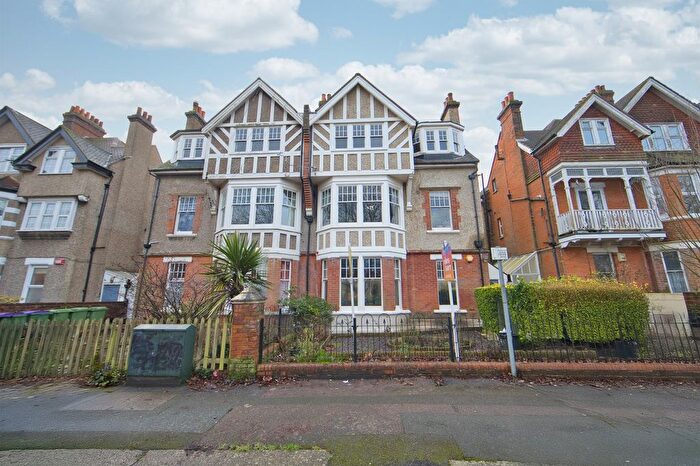
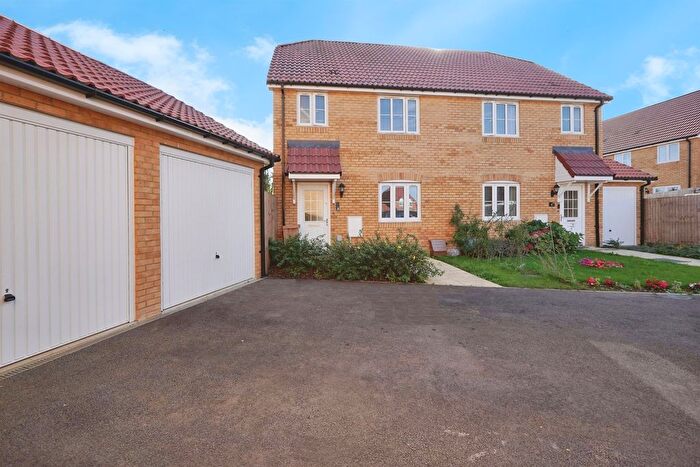
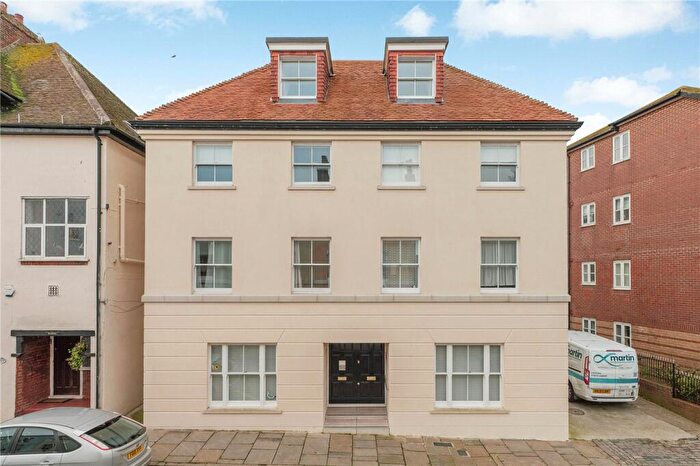
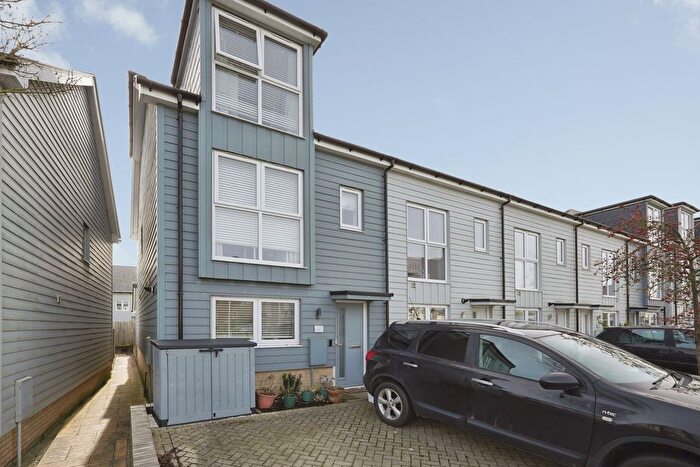
Houses for sale & to rent in Folkestone East, Folkestone
House Prices in Folkestone East
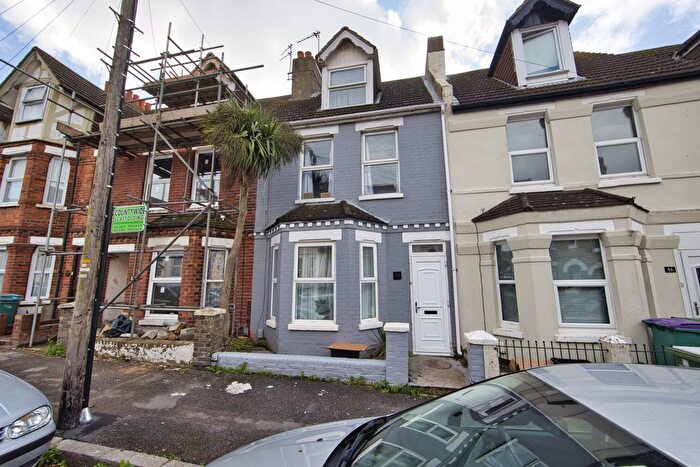
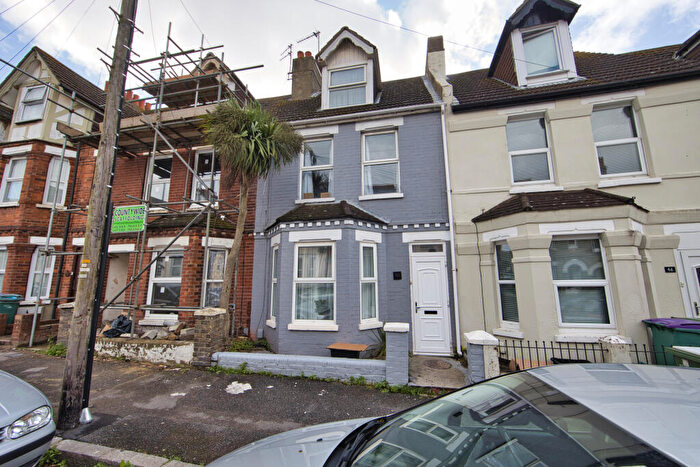
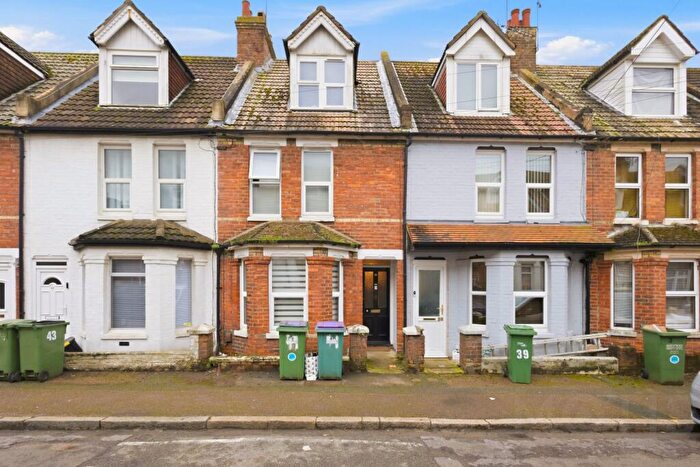
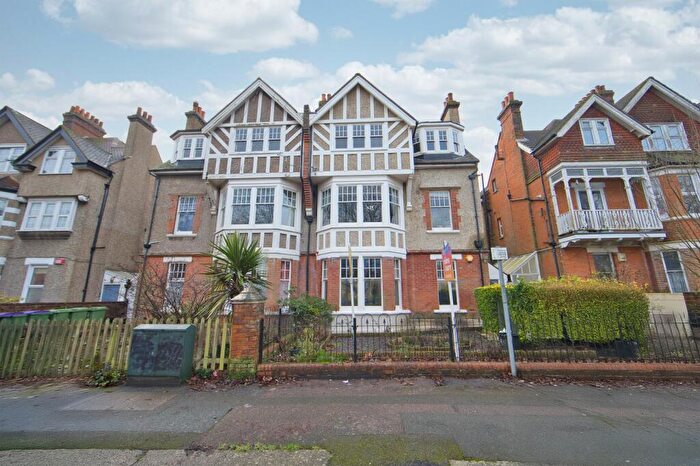
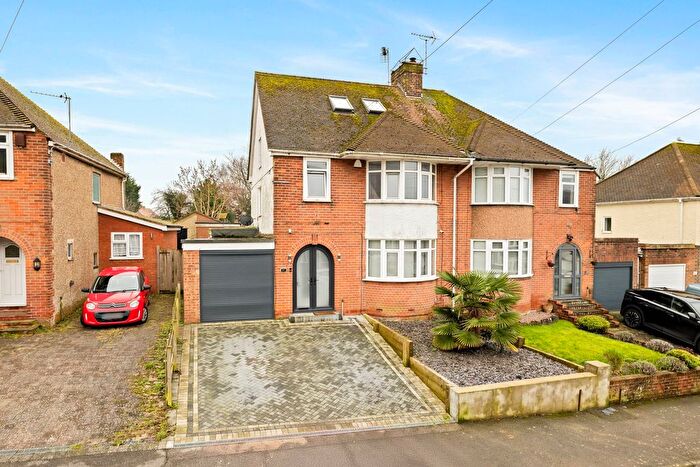
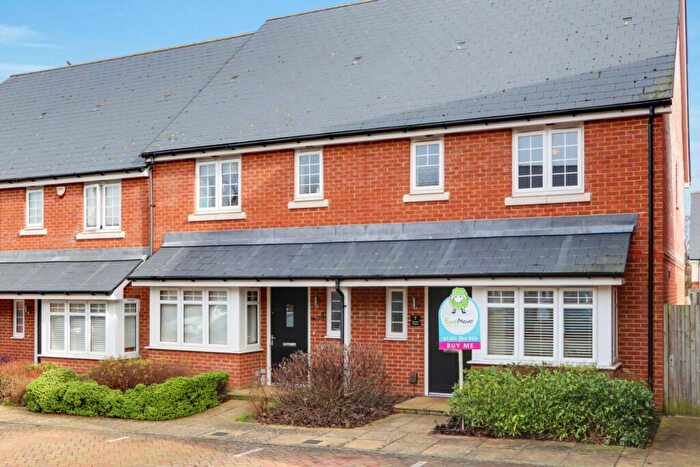
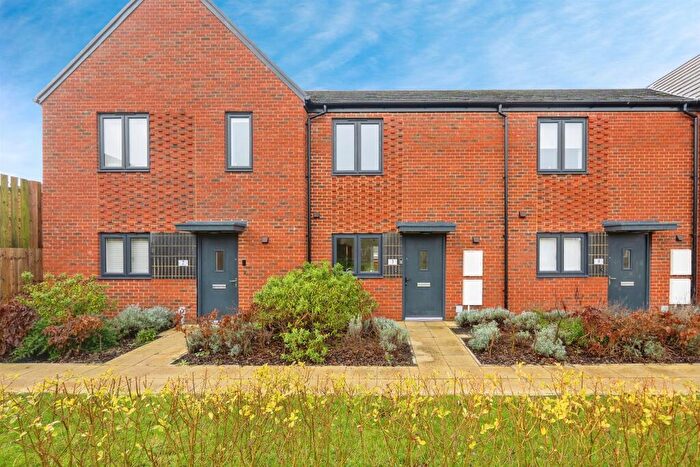
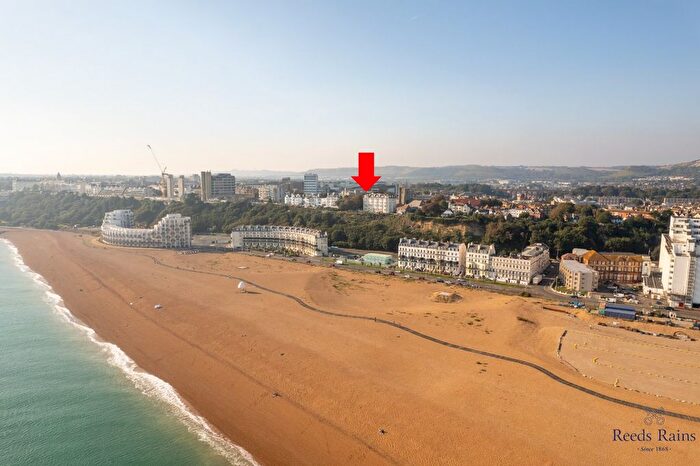
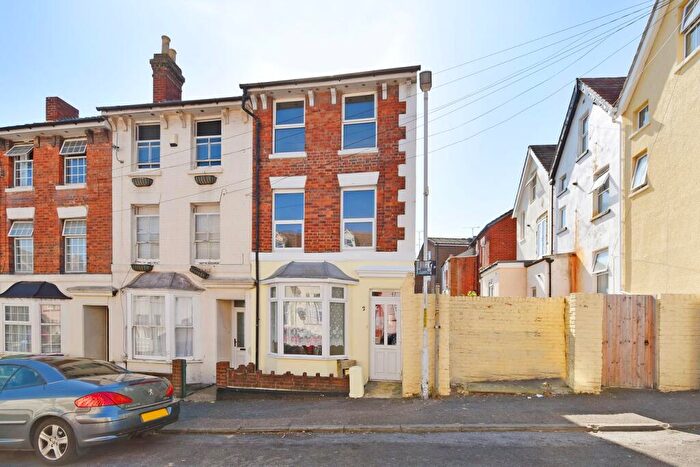
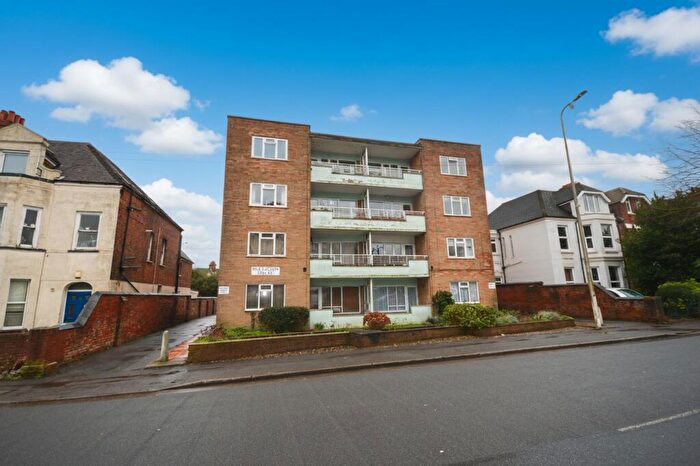
Properties in Folkestone East have an average house price of £284,404.00 and had 134 Property Transactions within the last 3 years¹.
Folkestone East is an area in Folkestone, Kent with 1,780 households², where the most expensive property was sold for £900,000.00.
Properties for sale in Folkestone East
Roads and Postcodes in Folkestone East
Navigate through our locations to find the location of your next house in Folkestone East, Folkestone for sale or to rent.
| Streets | Postcodes |
|---|---|
| Beatty Close | CT19 6HY |
| Beatty Road | CT19 6HU CT19 6HZ |
| Brabner Close | CT19 6LP CT19 6LW |
| Browning Place | CT19 6JP |
| Calgary Crescent | CT19 6JA CT19 6JD |
| Canterbury Road | CT18 7EQ CT19 5PE CT19 5QH CT19 5QJ |
| Churchill Close | CT19 5UP |
| Crete Road East | CT18 7EG CT18 7JH |
| Crete Road West | CT18 7AA |
| Creteway Close | CT19 6LH |
| Dallas Brett Crescent | CT19 6ND CT19 6NE |
| Dover Road | CT19 6NJ CT19 6NS CT19 6NT CT19 6NY CT19 6NZ CT19 6PA |
| Egerton Villas | CT19 6HH |
| Fleming Way | CT19 6JX CT19 6LR |
| George Gurr Crescent | CT19 6LF CT19 6LG CT19 6LQ |
| Hill Road | CT19 6JT CT19 6JU CT19 6LS CT19 6LT CT19 6LU CT19 6LX CT19 6LY CT19 6LZ CT19 6NB |
| Hollands Avenue | CT19 6PN CT19 6PP CT19 6PW |
| Holywell Avenue | CT19 6JY CT19 6JZ CT19 6LB CT19 6LD |
| Ingoldsby Road | CT19 6JJ CT19 6JL |
| Ivy Way | CT19 6HW CT19 6JE CT19 6JF |
| Joyes Close | CT19 6HN |
| Joyes Road | CT19 6HJ CT19 6HL |
| Keyes Place | CT19 6NA |
| Lawrence Court | CT19 6QT CT19 6QU |
| Montgomery Way | CT19 6LL CT19 6LN |
| New Dover Road | CT18 7JJ |
| Old Dover Road | CT18 7HL |
| Page Place | CT19 6HX |
| Park View | CT19 6HR |
| Pilgrim Spring | CT19 6QE CT19 6QF |
| Plimsoll Avenue | CT19 6LJ |
| Spurgen Row | CT19 6QY |
| Stanbury Crescent | CT19 6PB CT19 6PD |
| Stuart Road | CT19 6NL |
| Sugar Loaf Walk | CT19 6LE |
| Swiss Way | CT19 6PJ |
| Tennyson Place | CT19 6JW |
| The Close | CT19 6QB |
| Tyson Road | CT19 6JR CT19 6JS |
| Wallace Mews | CT19 5SP |
| Walton Manor Close | CT19 5QG |
| Wear Bay Road | CT19 6PE CT19 6PL CT19 6PZ |
| Wood Avenue | CT19 6HP CT19 6HT CT19 6JH CT19 6JN |
Transport near Folkestone East
-
Folkestone Central Station
-
Folkestone West Station
-
Sandling Station
-
Kearsney Station
-
Dover Priory Station
-
Westenhanger Station
-
Shepherd's Well Station
-
Snowdown Station
-
Martin Mill Station
-
Aylesham Station
- FAQ
- Price Paid By Year
- Property Type Price
Frequently asked questions about Folkestone East
What is the average price for a property for sale in Folkestone East?
The average price for a property for sale in Folkestone East is £284,404. This amount is 9% lower than the average price in Folkestone. There are 3,474 property listings for sale in Folkestone East.
What streets have the most expensive properties for sale in Folkestone East?
The streets with the most expensive properties for sale in Folkestone East are Swiss Way at an average of £900,000, Old Dover Road at an average of £700,000 and Crete Road West at an average of £599,375.
What streets have the most affordable properties for sale in Folkestone East?
The streets with the most affordable properties for sale in Folkestone East are Lawrence Court at an average of £137,812, Crete Road East at an average of £140,000 and Brabner Close at an average of £142,500.
Which train stations are available in or near Folkestone East?
Some of the train stations available in or near Folkestone East are Folkestone Central, Folkestone West and Sandling.
Property Price Paid in Folkestone East by Year
The average sold property price by year was:
| Year | Average Sold Price | Price Change |
Sold Properties
|
|---|---|---|---|
| 2025 | £313,960 | 9% |
38 Properties |
| 2024 | £286,740 | 11% |
55 Properties |
| 2023 | £253,878 | -9% |
41 Properties |
| 2022 | £276,327 | 6% |
50 Properties |
| 2021 | £260,360 | 8% |
61 Properties |
| 2020 | £238,575 | 12% |
45 Properties |
| 2019 | £209,968 | 11% |
48 Properties |
| 2018 | £186,423 | -20% |
36 Properties |
| 2017 | £224,338 | 22% |
66 Properties |
| 2016 | £175,685 | 6% |
47 Properties |
| 2015 | £165,487 | 9% |
40 Properties |
| 2014 | £150,085 | 1% |
67 Properties |
| 2013 | £148,241 | 7% |
31 Properties |
| 2012 | £137,359 | -1% |
36 Properties |
| 2011 | £138,180 | -27% |
47 Properties |
| 2010 | £175,848 | 23% |
38 Properties |
| 2009 | £136,276 | -18% |
38 Properties |
| 2008 | £161,149 | 1% |
30 Properties |
| 2007 | £159,472 | 7% |
70 Properties |
| 2006 | £148,345 | 15% |
83 Properties |
| 2005 | £126,115 | 6% |
65 Properties |
| 2004 | £118,178 | 3% |
80 Properties |
| 2003 | £115,020 | 19% |
71 Properties |
| 2002 | £93,188 | 6% |
76 Properties |
| 2001 | £87,426 | 19% |
80 Properties |
| 2000 | £70,496 | 25% |
72 Properties |
| 1999 | £52,571 | -5% |
70 Properties |
| 1998 | £55,041 | 10% |
54 Properties |
| 1997 | £49,293 | 6% |
68 Properties |
| 1996 | £46,424 | 5% |
46 Properties |
| 1995 | £44,061 | - |
47 Properties |
Property Price per Property Type in Folkestone East
Here you can find historic sold price data in order to help with your property search.
The average Property Paid Price for specific property types in the last three years are:
| Property Type | Average Sold Price | Sold Properties |
|---|---|---|
| Semi Detached House | £295,989.00 | 49 Semi Detached Houses |
| Detached House | £518,305.00 | 18 Detached Houses |
| Terraced House | £250,420.00 | 41 Terraced Houses |
| Flat | £154,230.00 | 26 Flats |

