
Houses for sale in DA12 2NE, Forge Lane, Chalk, Gravesend
House Prices in DA12 2NE, Forge Lane, Chalk
Properties in DA12 2NE have no sales history available within the last 3 years. DA12 2NE is a postcode in Forge Lane located in Chalk, an area in Gravesend, Kent, with 2 households².
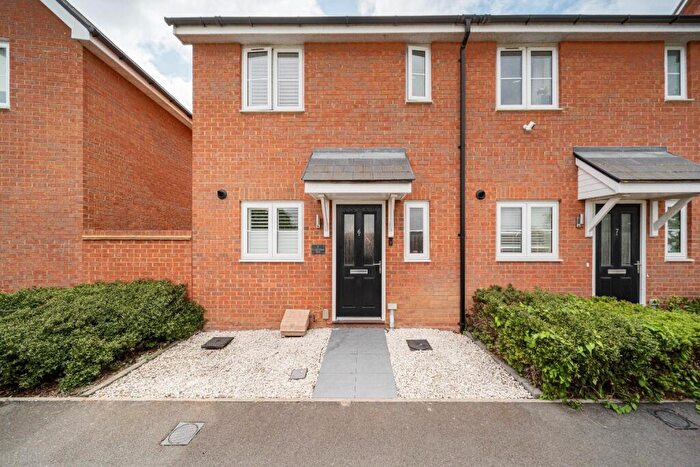
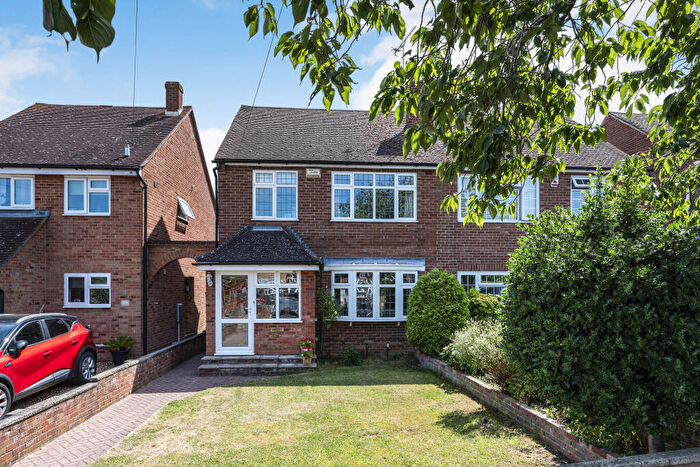
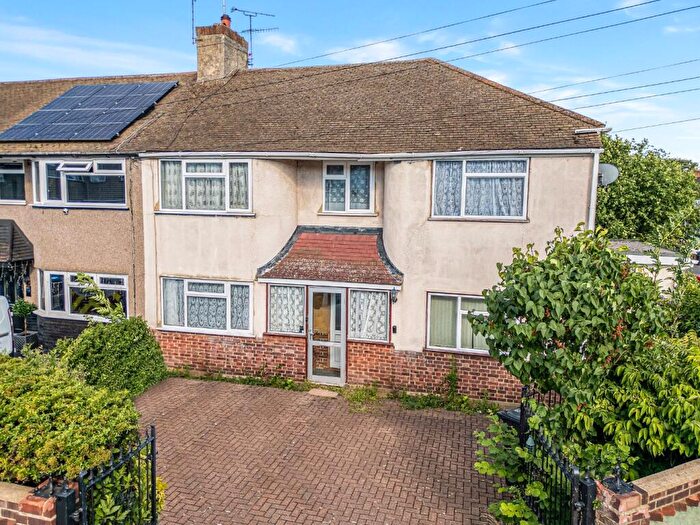
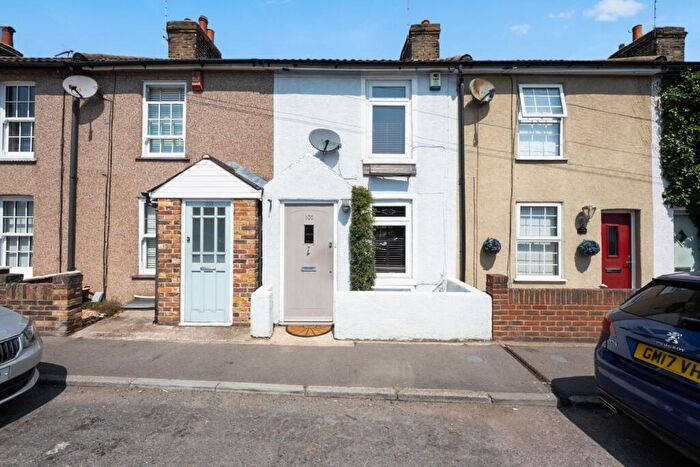
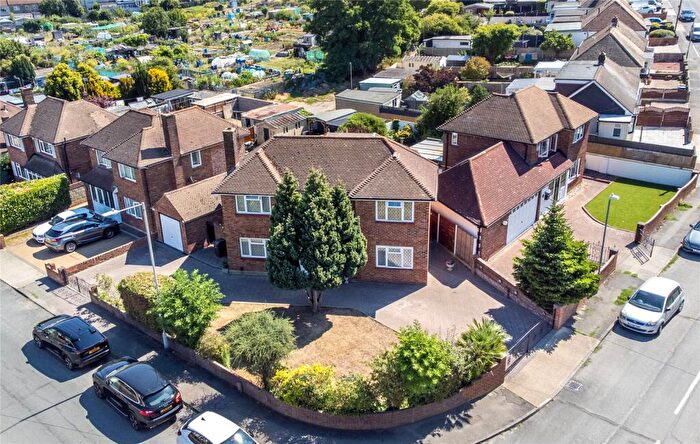
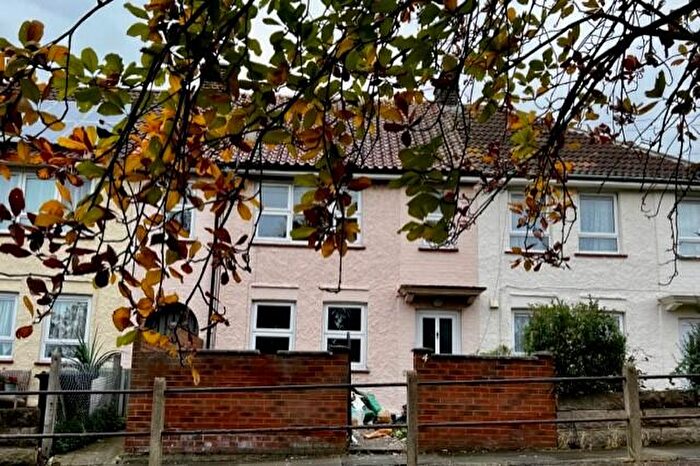
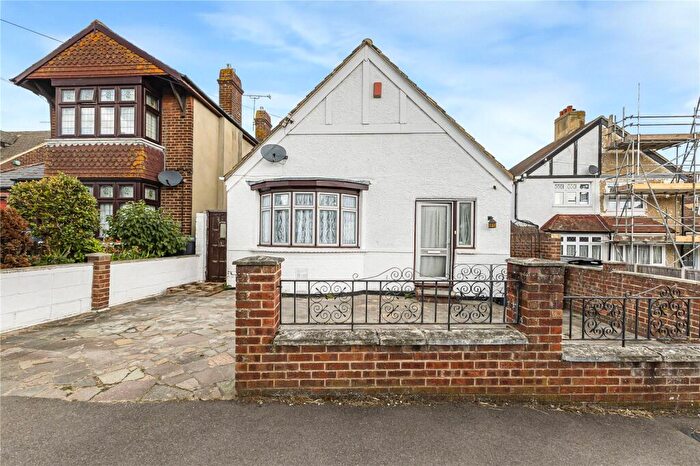
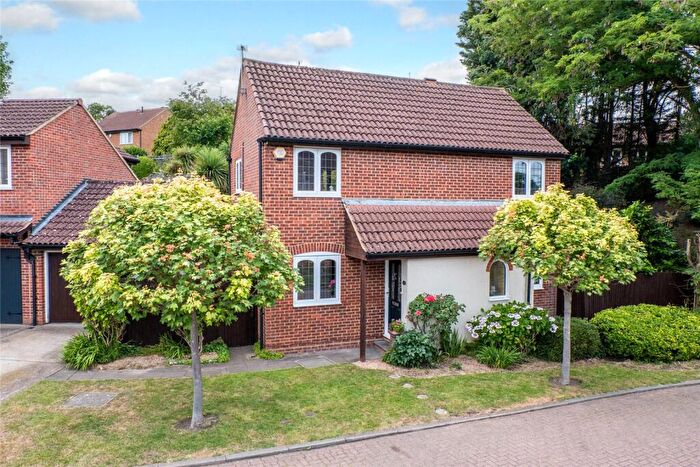
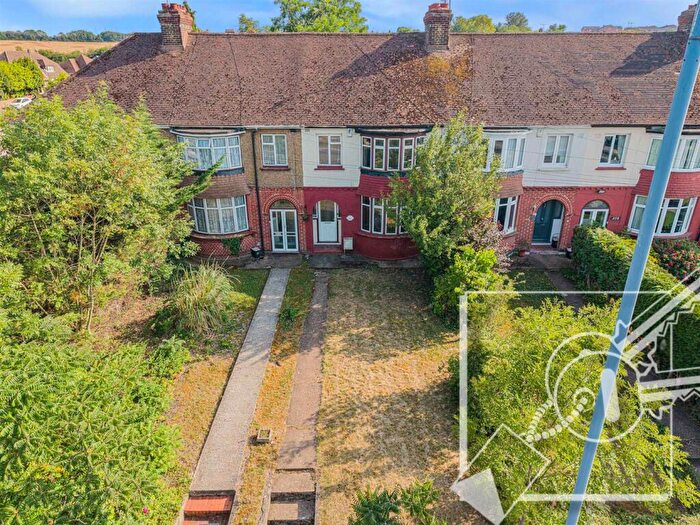
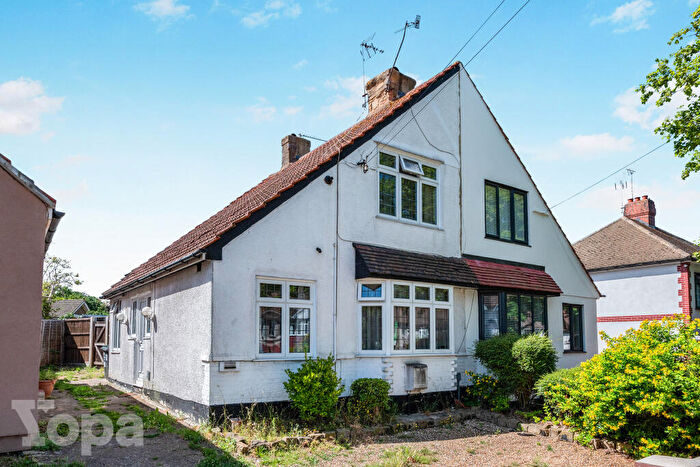
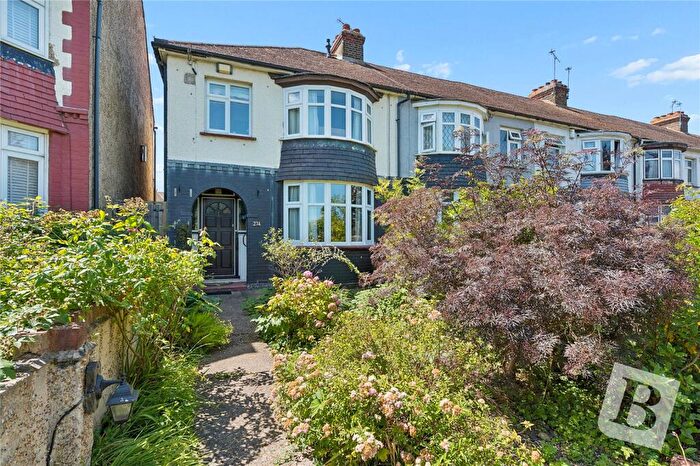
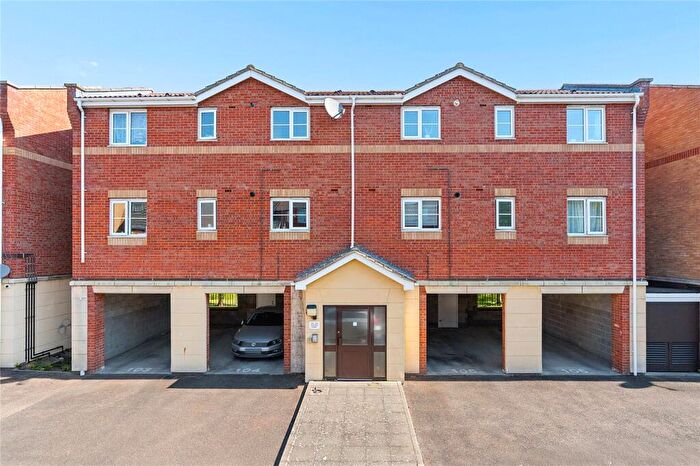
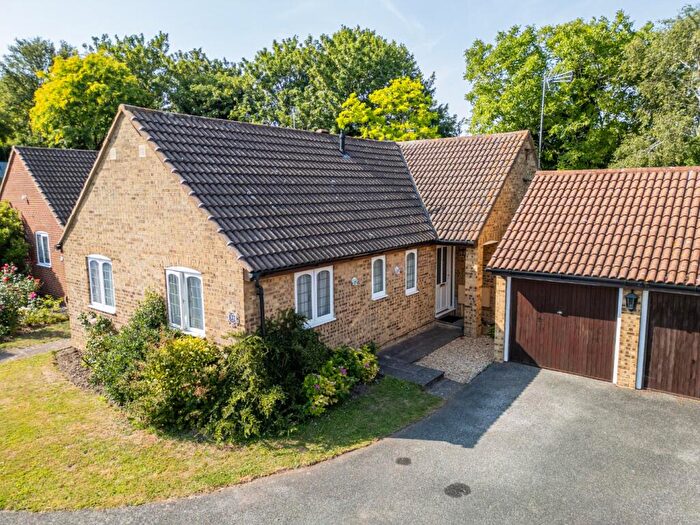
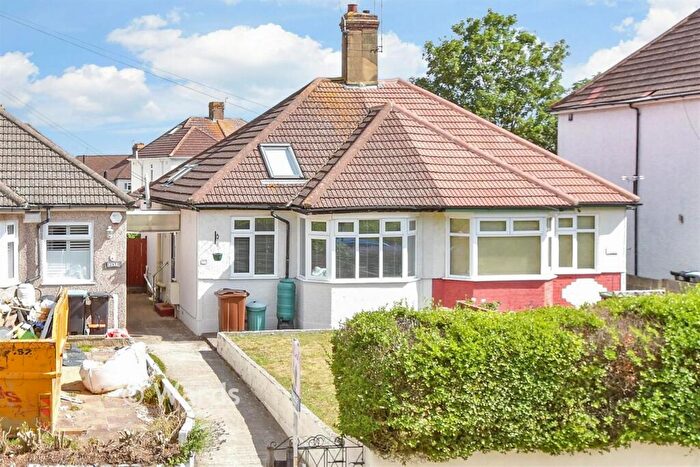
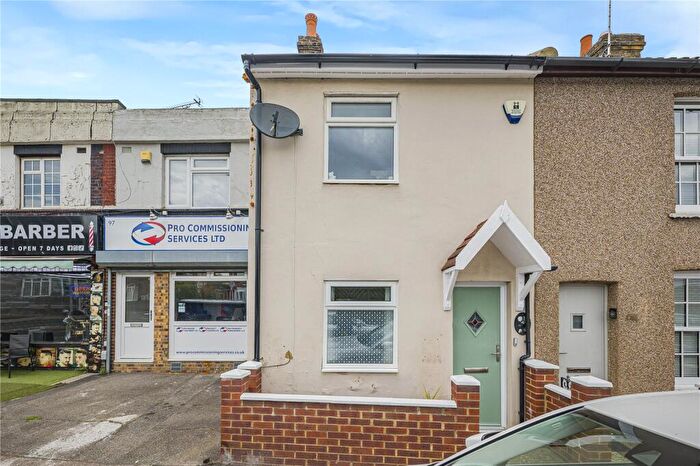
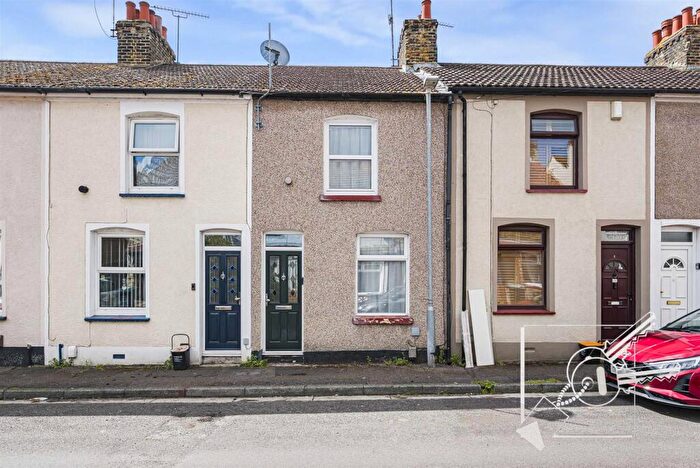
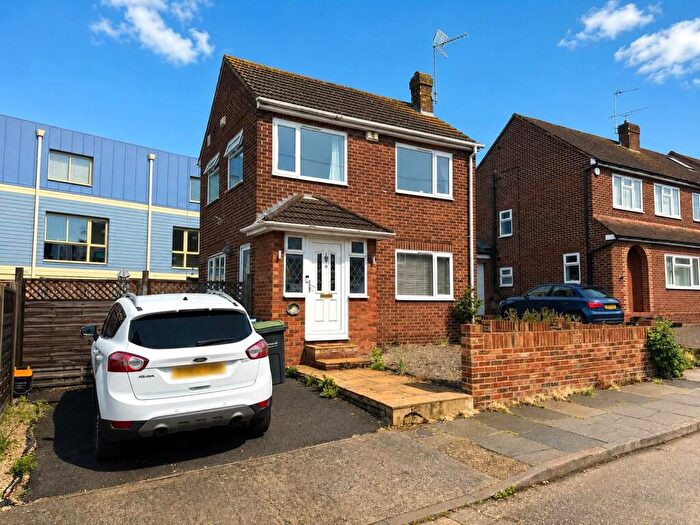
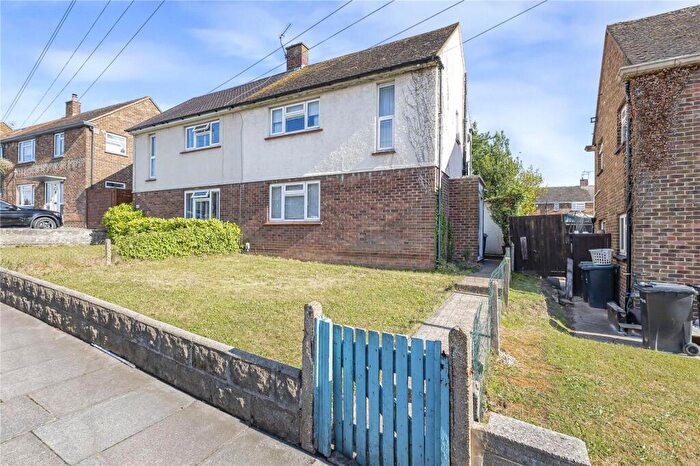
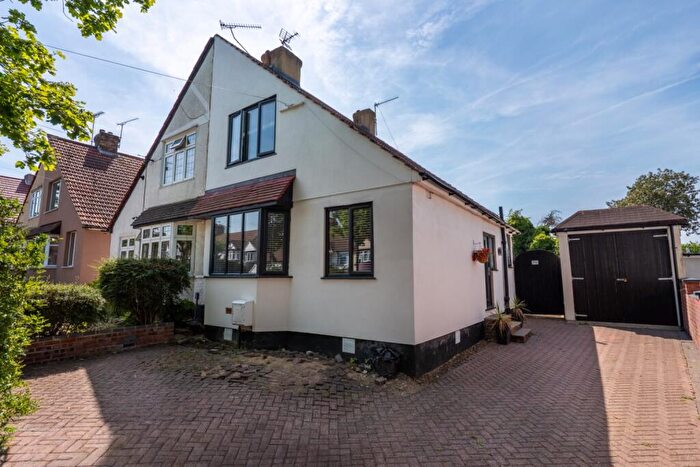
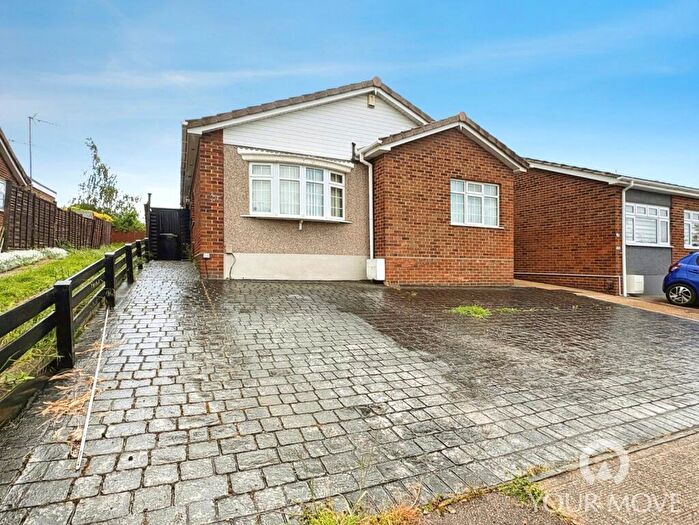
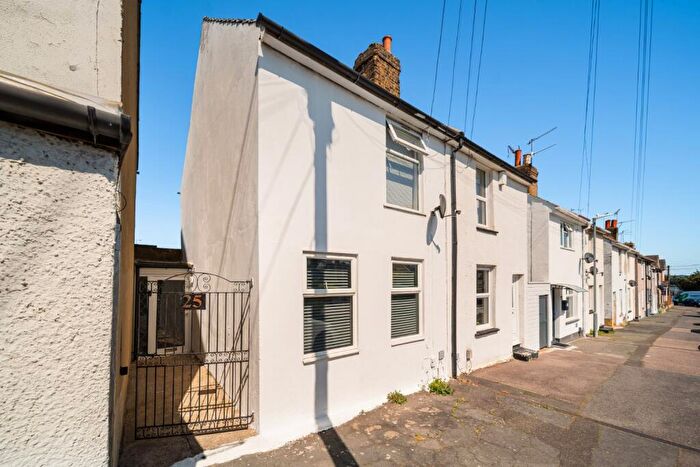
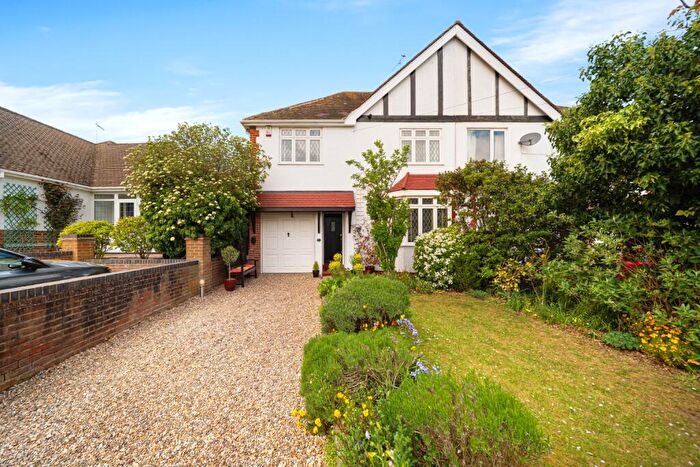
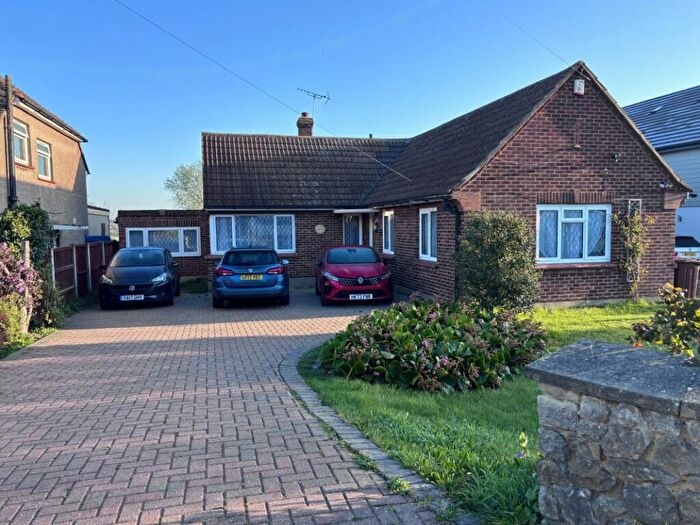
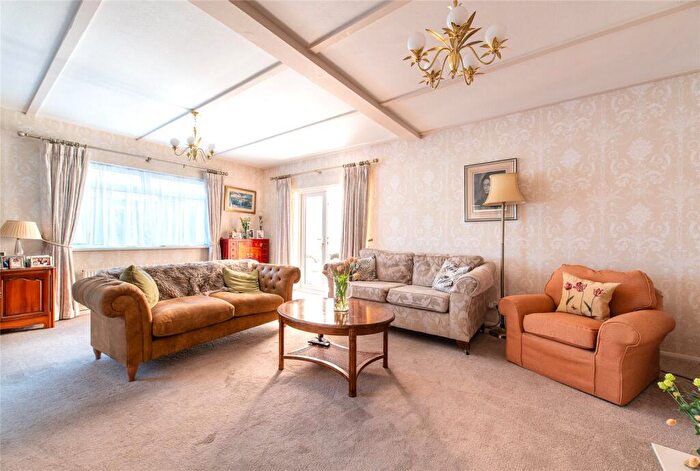
Properties for sale near DA12 2NE, Forge Lane
![]()
If you are looking to sell your house, let it out, or receive a property valuation, an expert can help you.
Click the button below to get started.
Price Paid in Forge Lane, DA12 2NE, Chalk
THE FORGE Forge Lane, DA12 2NE, Chalk Gravesend
Property THE FORGE has been sold 2 times. The last time it was sold was in 07/04/2022 and the sold price was £565,000.00.
This detached house, sold as a freehold on 07/04/2022, is a 128 sqm detached house with an EPC rating of E.
| Date | Price | Property Type | Tenure | Classification |
|---|---|---|---|---|
| 07/04/2022 | £565,000.00 | Detached House | freehold | Established Building |
| 26/03/1999 | £156,000.00 | Detached House | freehold | Established Building |
1A Forge Lane, DA12 2NE, Chalk Gravesend
Property 1A has been sold 2 times. The last time it was sold was in 30/08/2016 and the sold price was £477,500.00.
This detached house, sold as a freehold on 30/08/2016, is a 158 sqm detached house with an EPC rating of C.
| Date | Price | Property Type | Tenure | Classification |
|---|---|---|---|---|
| 30/08/2016 | £477,500.00 | Detached House | freehold | Established Building |
| 31/05/2002 | £230,000.00 | Detached House | freehold | Established Building |
Postcodes in Forge Lane, Chalk
Navigate through other locations in Forge Lane, Chalk, Gravesend to see more property listings for sale or to rent.
Property price trends in DA12 2NE, Forge Lane
According to the latest Land Registry data, the average home in DA12 2NE, Forge Lane sold for £565,000 in 2022. That figure comes from 4 sales logged over the past 23 years.
Looking back five years, average prices are up about 18.3% since 2016, a gain of around £87,500 in cash terms.
Property Price Paid in DA12 2NE, Forge Lane by Year
The average sold property price by year was:
| Year | Average Sold Price | Price Change |
Sold Properties
|
|---|---|---|---|
| 2022 | £565,000 | 15% |
1 Property |
| 2016 | £477,500 | 52% |
1 Property |
| 2002 | £230,000 | 32% |
1 Property |
| 1999 | £156,000 | - |
1 Property |
