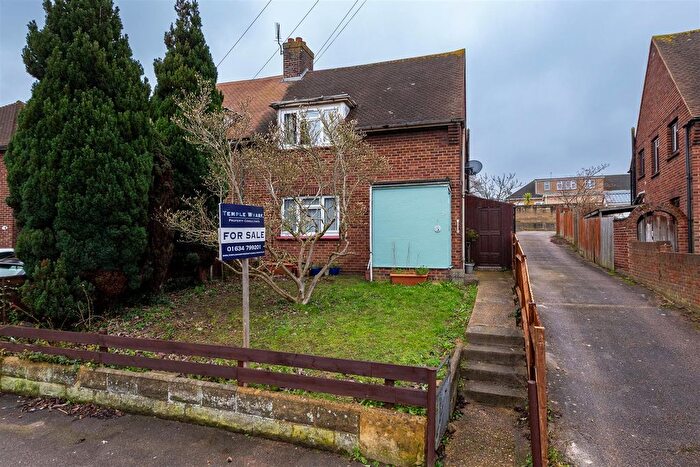
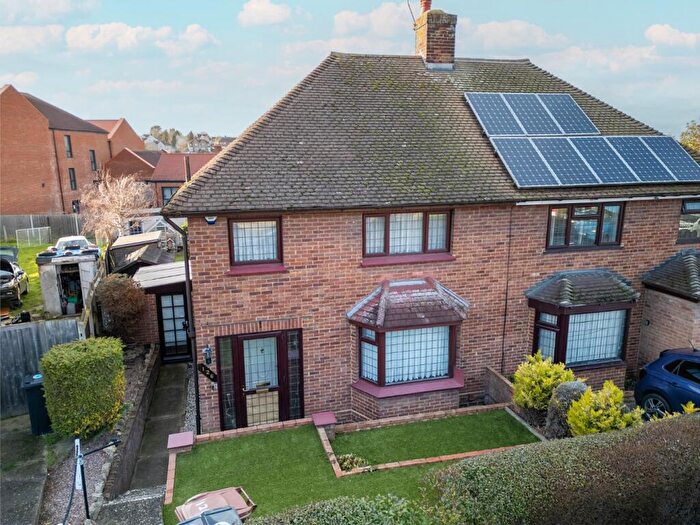
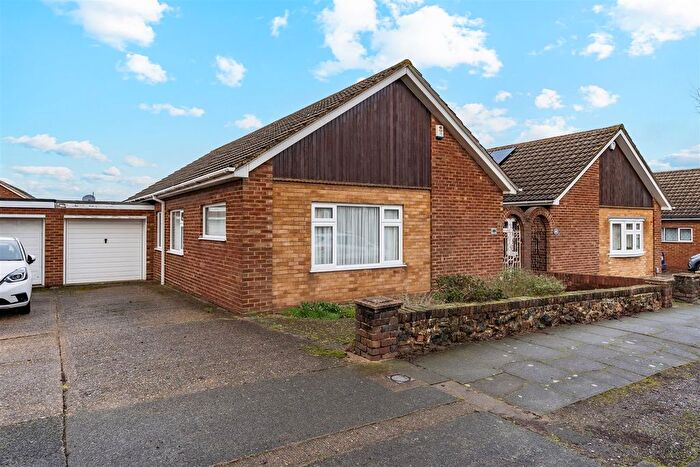
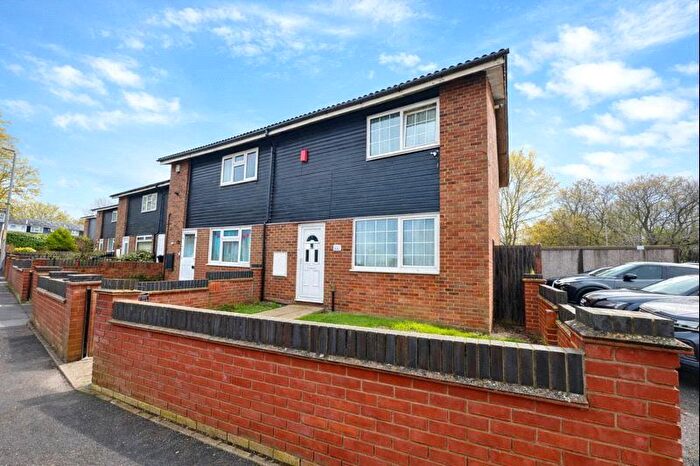
Houses for sale & to rent in Riverview, Gravesend
House Prices in Riverview
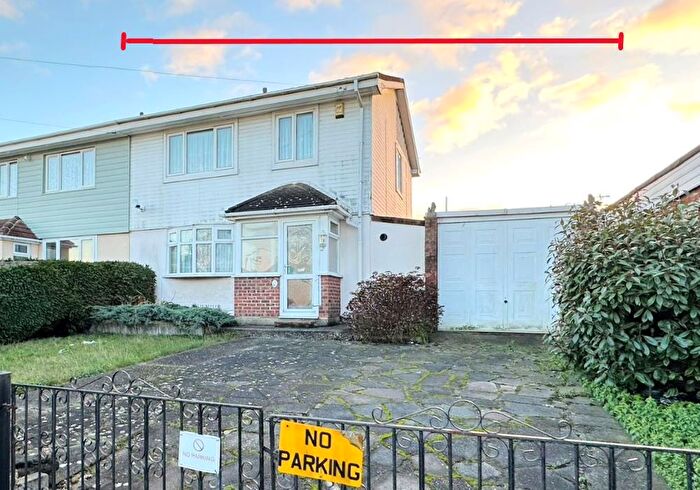
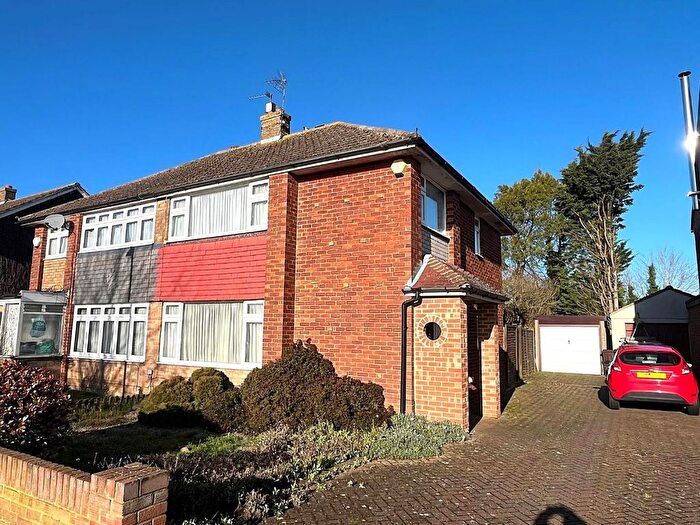
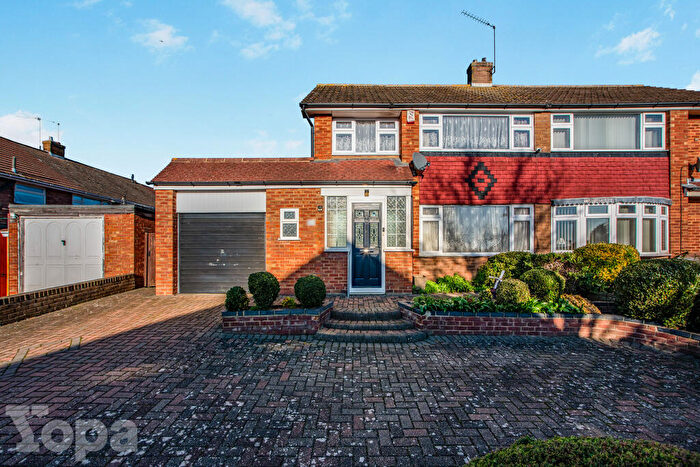
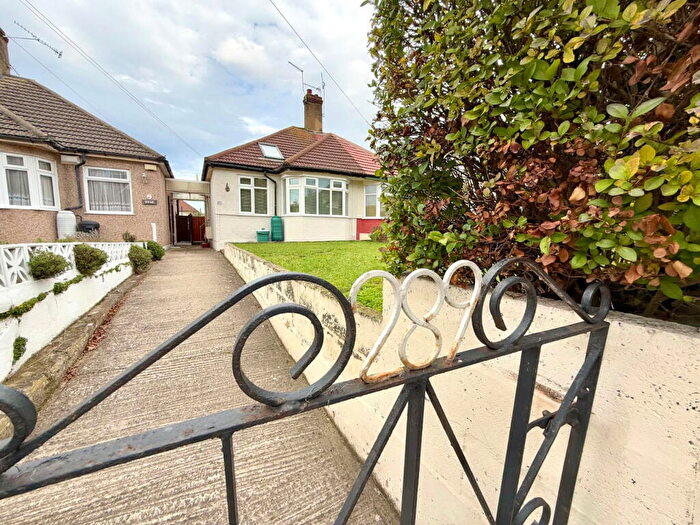
Properties in Riverview have an average house price of £381,605.00 and had 147 Property Transactions within the last 3 years¹.
Riverview is an area in Gravesend, Kent with 1,656 households², where the most expensive property was sold for £578,000.00.
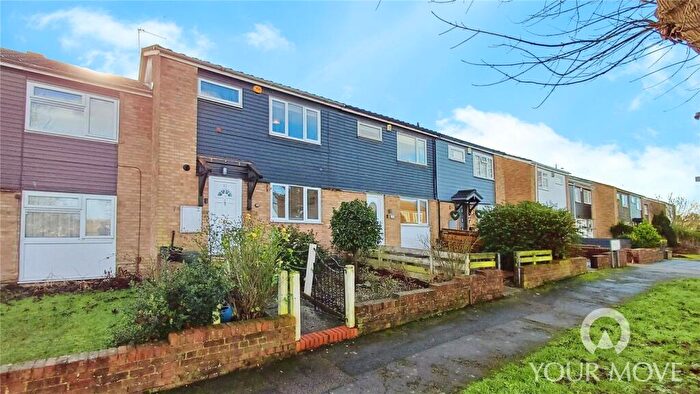
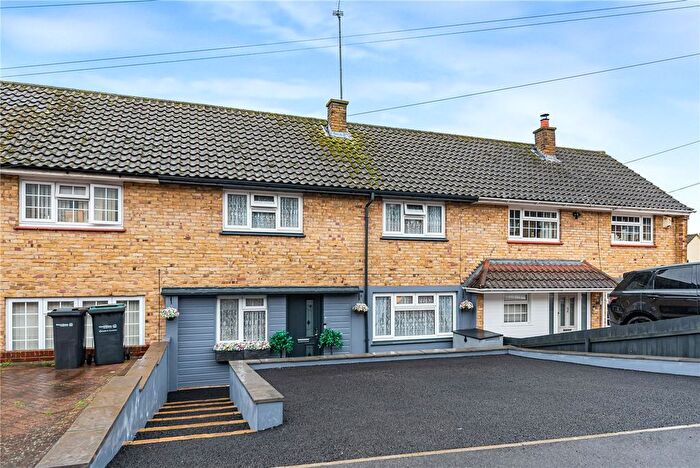
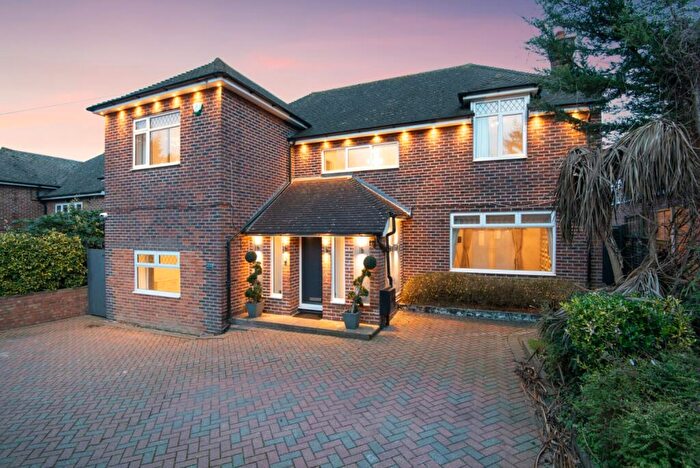
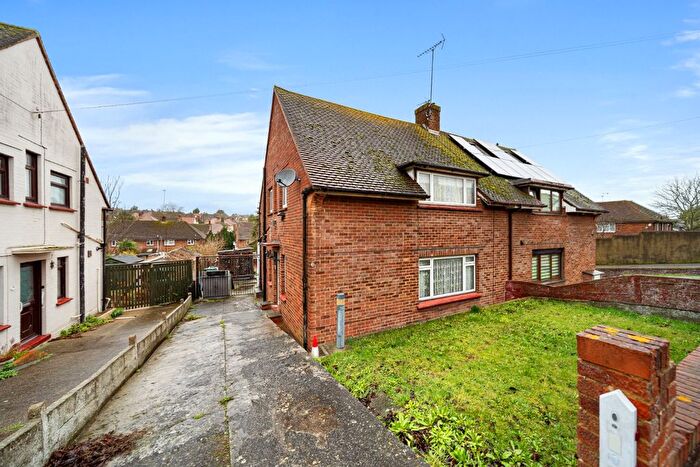
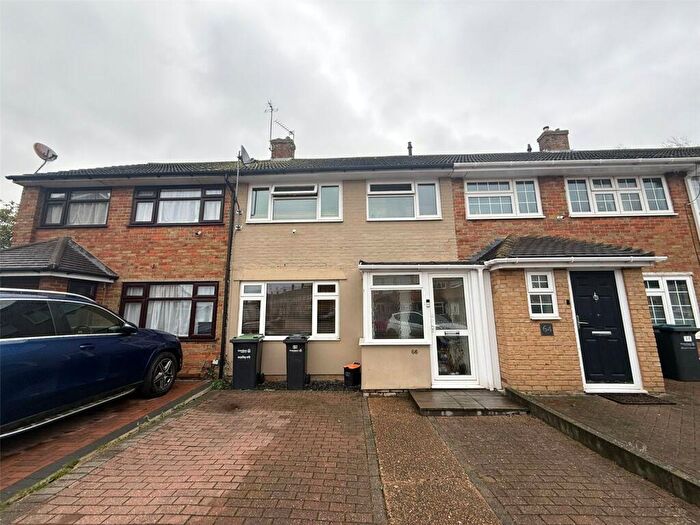
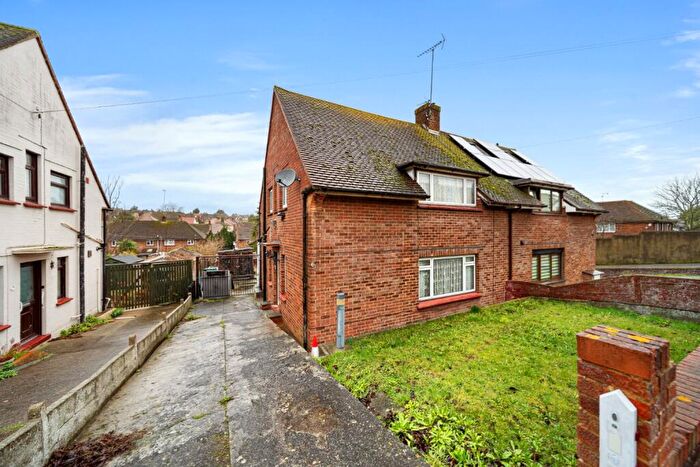
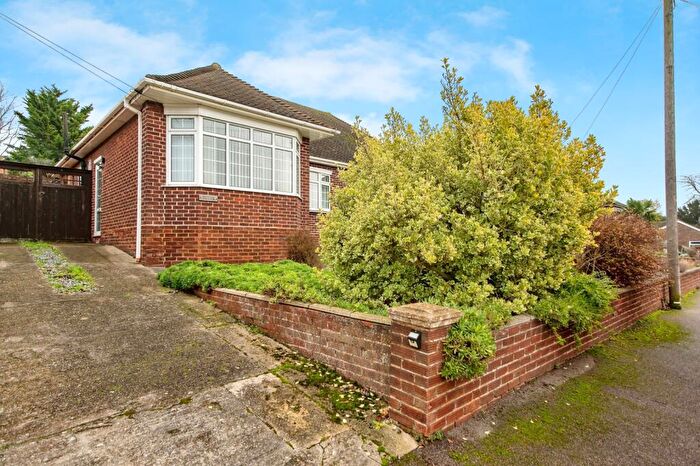
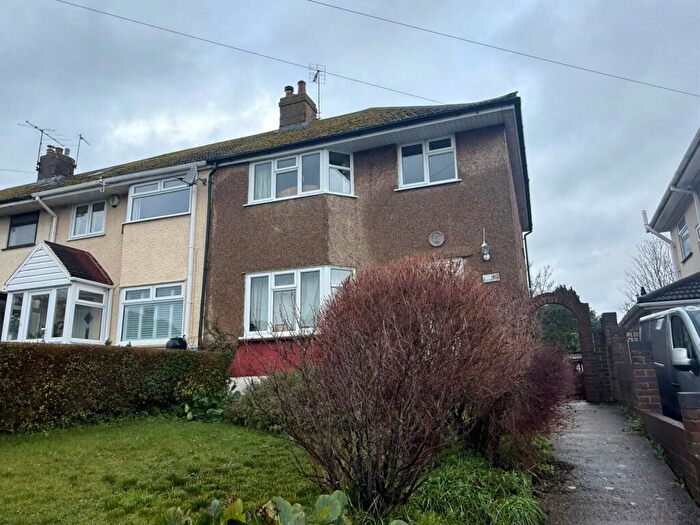
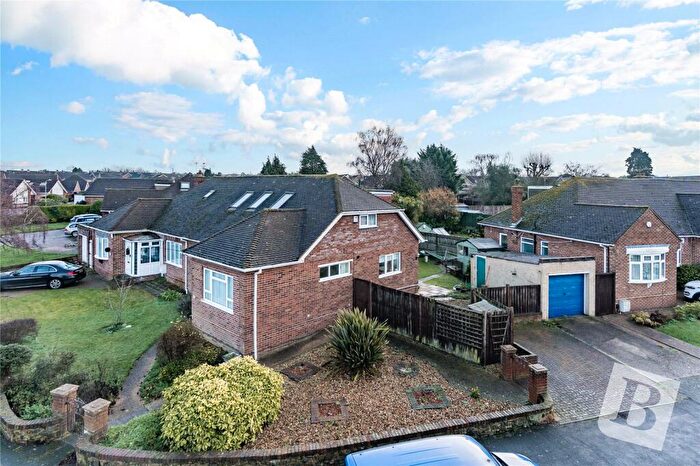
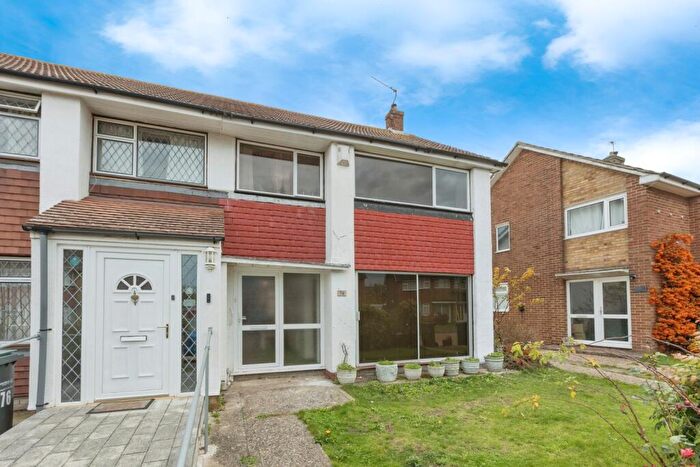
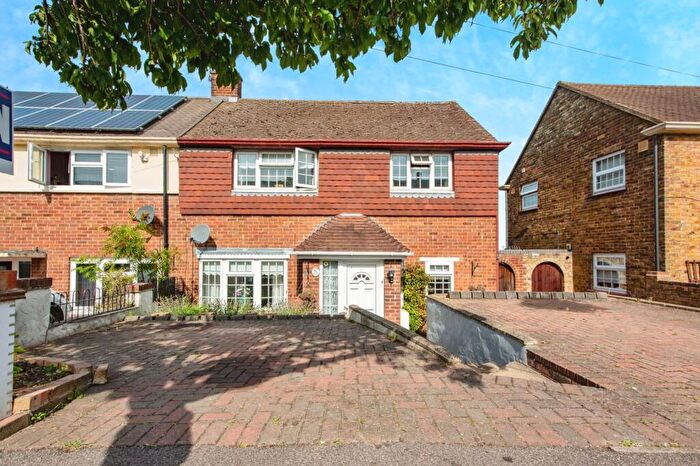
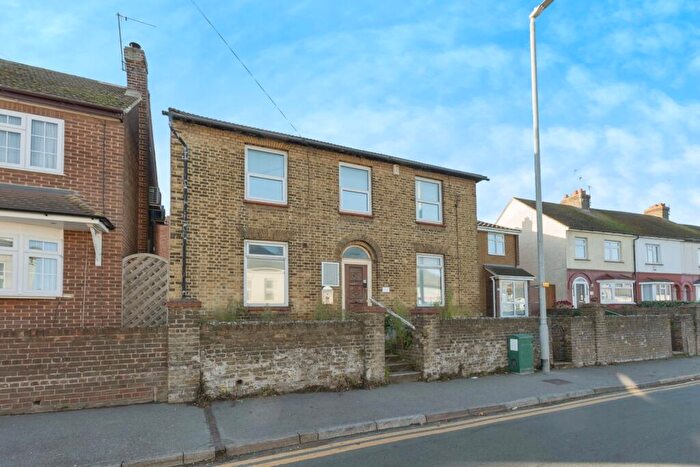
Properties for sale in Riverview
Roads and Postcodes in Riverview
Navigate through our locations to find the location of your next house in Riverview, Gravesend for sale or to rent.
| Streets | Postcodes |
|---|---|
| Ariel Close | DA12 4ND |
| Astra Drive | DA12 4PY DA12 4QE |
| Bonaventure Court | DA12 4SA |
| Britannia Drive | DA12 4RP DA12 4RR |
| Caliph Close | DA12 4NP |
| Cambria Crescent | DA12 4NH DA12 4NJ DA12 4NY DA12 4NZ |
| Challenge Close | DA12 4RT |
| Cimba Wood | DA12 4SD |
| Cirrus Crescent | DA12 4QR DA12 4QS DA12 4QT |
| Clipper Crescent | DA12 4NN DA12 4NW |
| Frobisher Way | DA12 4QY DA12 4QZ DA12 4RA |
| Gateway Parade | DA12 4RU |
| Hopewell Drive | DA12 4PX |
| Imperial Drive | DA12 4LL DA12 4LN DA12 4LR DA12 4LW |
| Kelso Drive | DA12 4NR |
| Latona Drive | DA12 4RS |
| Leander Drive | DA12 4NE DA12 4NF DA12 4NQ |
| Marling Way | DA12 4RE DA12 4RF DA12 4RG DA12 4RQ |
| Mermerus Gardens | DA12 4NB |
| Salcote Road | DA12 4RB |
| Sapho Park | DA12 4NA |
| Sara Park | DA12 4SB |
| Sirdar Strand | DA12 4LP |
| St Francis Avenue | DA12 4SN DA12 4SW DA12 4SZ |
| Stornaway Strand | DA12 4NL |
| Tamesis Strand | DA12 4QU |
| The Alma | DA12 4NG |
| Thelma Close | DA12 4LJ |
| Thong Lane | DA12 4LF DA12 4LG DA12 4LQ DA12 4LT |
| Torrens Walk | DA12 4QX |
| Tower Close | DA12 4QP |
| Vanessa Walk | DA12 4PL |
| Verona Gardens | DA12 4NT |
| Vigilant Way | DA12 4PH DA12 4PJ DA12 4PN DA12 4PP DA12 4PW |
| Way Volante | DA12 4SQ DA12 4SG |
| Whinfell Way | DA12 4RX DA12 4RY DA12 4RZ DA12 4SE DA12 4SF |
| Windhover Way | DA12 4NS |
Transport near Riverview
- FAQ
- Price Paid By Year
- Property Type Price
Frequently asked questions about Riverview
What is the average price for a property for sale in Riverview?
The average price for a property for sale in Riverview is £381,605. This amount is 4% higher than the average price in Gravesend. There are 921 property listings for sale in Riverview.
What streets have the most expensive properties for sale in Riverview?
The streets with the most expensive properties for sale in Riverview are Ariel Close at an average of £578,000, Stornaway Strand at an average of £550,000 and Sapho Park at an average of £510,000.
What streets have the most affordable properties for sale in Riverview?
The streets with the most affordable properties for sale in Riverview are Gateway Parade at an average of £230,000, Tamesis Strand at an average of £292,500 and Tower Close at an average of £306,800.
Which train stations are available in or near Riverview?
Some of the train stations available in or near Riverview are Gravesend, Sole Street and Meopham.
Property Price Paid in Riverview by Year
The average sold property price by year was:
| Year | Average Sold Price | Price Change |
Sold Properties
|
|---|---|---|---|
| 2025 | £390,297 | 2% |
47 Properties |
| 2024 | £384,020 | 3% |
48 Properties |
| 2023 | £371,520 | -3% |
52 Properties |
| 2022 | £383,948 | 11% |
56 Properties |
| 2021 | £343,362 | 12% |
74 Properties |
| 2020 | £303,308 | -8% |
47 Properties |
| 2019 | £326,553 | 2% |
51 Properties |
| 2018 | £319,166 | -1% |
45 Properties |
| 2017 | £323,490 | 5% |
50 Properties |
| 2016 | £306,380 | 16% |
52 Properties |
| 2015 | £256,466 | 7% |
49 Properties |
| 2014 | £239,166 | 13% |
56 Properties |
| 2013 | £208,253 | -1% |
49 Properties |
| 2012 | £210,255 | 11% |
43 Properties |
| 2011 | £186,927 | -6% |
52 Properties |
| 2010 | £198,062 | 8% |
40 Properties |
| 2009 | £182,403 | -12% |
39 Properties |
| 2008 | £203,541 | -4% |
48 Properties |
| 2007 | £211,536 | 10% |
65 Properties |
| 2006 | £191,286 | 2% |
81 Properties |
| 2005 | £187,496 | 6% |
44 Properties |
| 2004 | £176,825 | 5% |
76 Properties |
| 2003 | £167,482 | 20% |
60 Properties |
| 2002 | £134,131 | 17% |
89 Properties |
| 2001 | £111,798 | 13% |
66 Properties |
| 2000 | £97,587 | 9% |
39 Properties |
| 1999 | £89,128 | 4% |
44 Properties |
| 1998 | £85,676 | 14% |
62 Properties |
| 1997 | £73,749 | 11% |
67 Properties |
| 1996 | £65,809 | -3% |
71 Properties |
| 1995 | £68,099 | - |
50 Properties |
Property Price per Property Type in Riverview
Here you can find historic sold price data in order to help with your property search.
The average Property Paid Price for specific property types in the last three years are:
| Property Type | Average Sold Price | Sold Properties |
|---|---|---|
| Semi Detached House | £396,714.00 | 117 Semi Detached Houses |
| Detached House | £443,500.00 | 2 Detached Houses |
| Terraced House | £328,660.00 | 25 Terraced Houses |
| Flat | £192,333.00 | 3 Flats |

