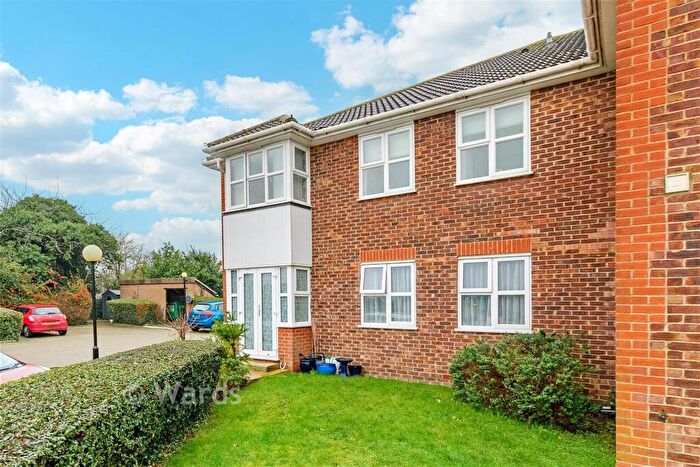
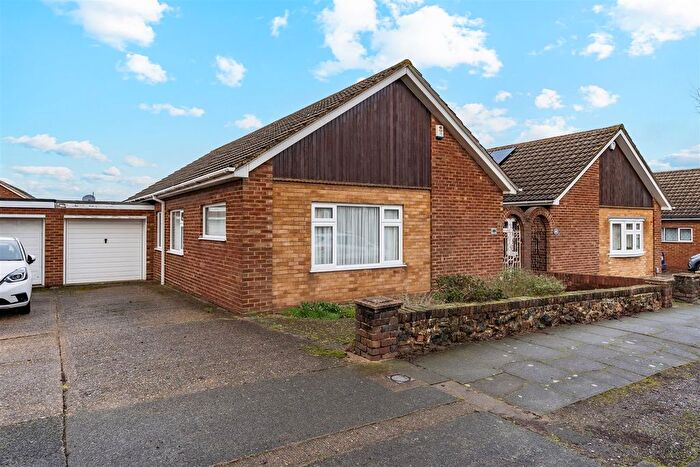
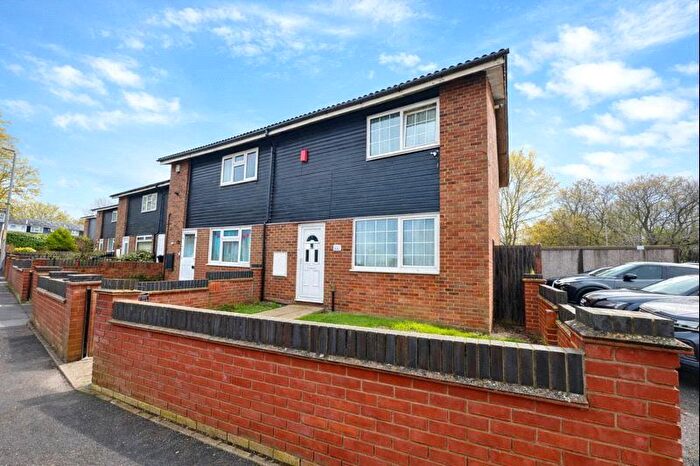
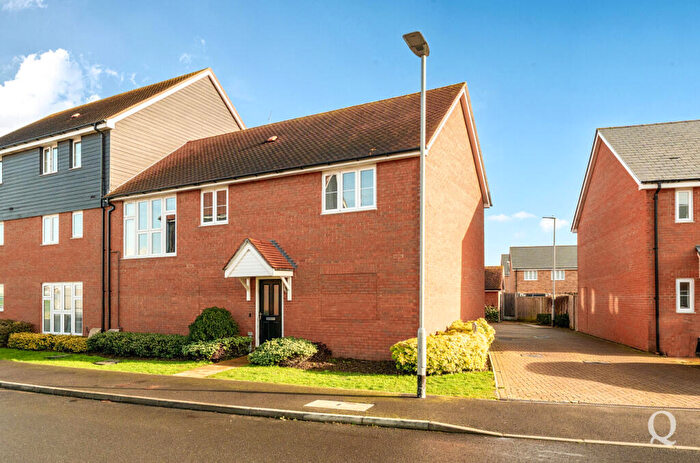
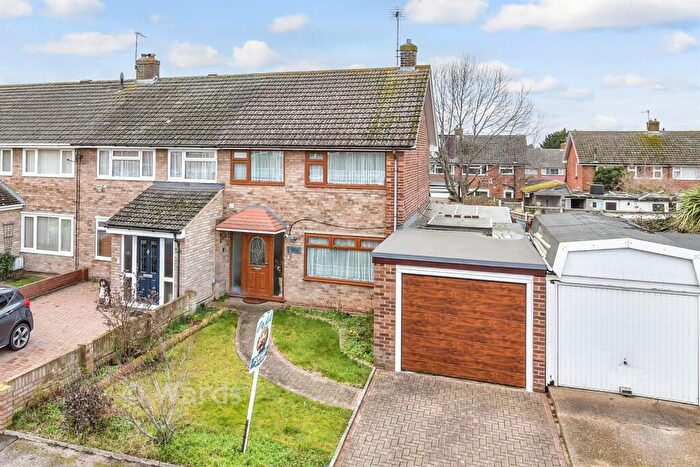
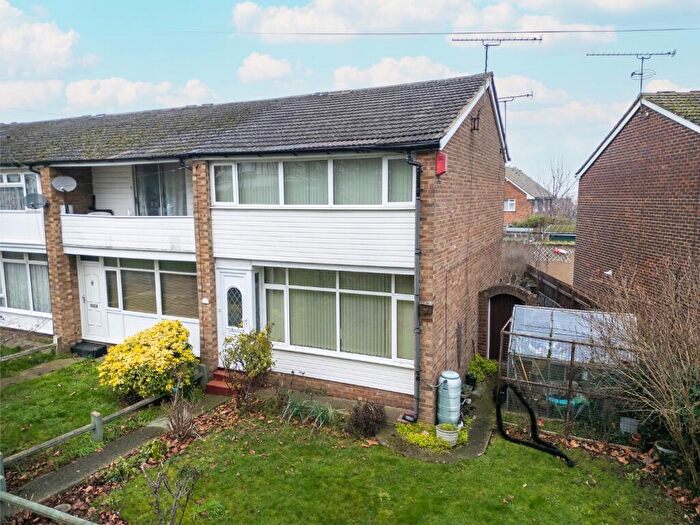
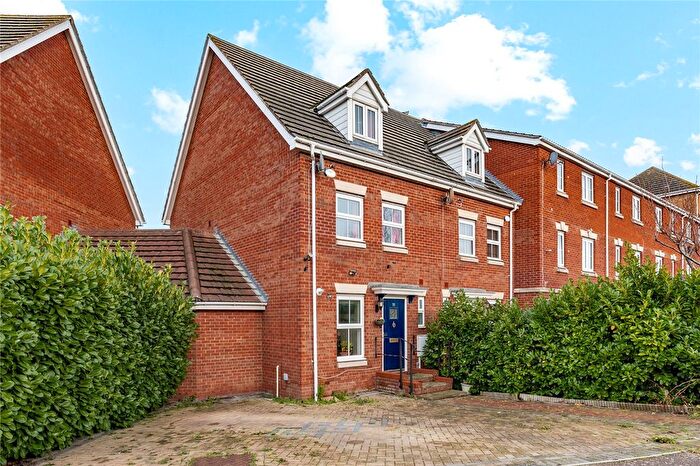
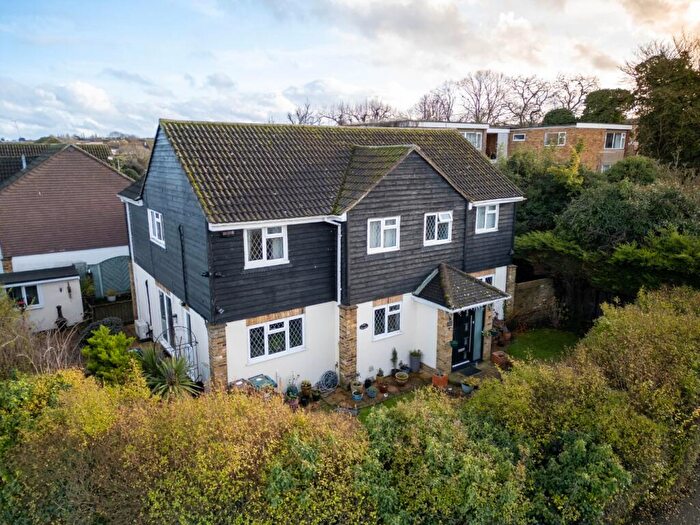
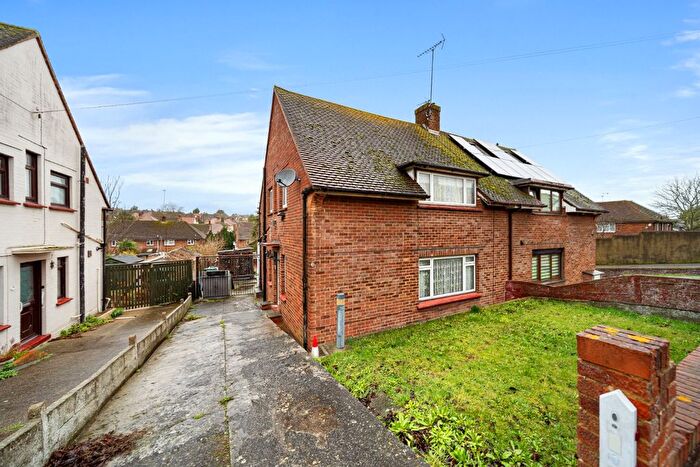
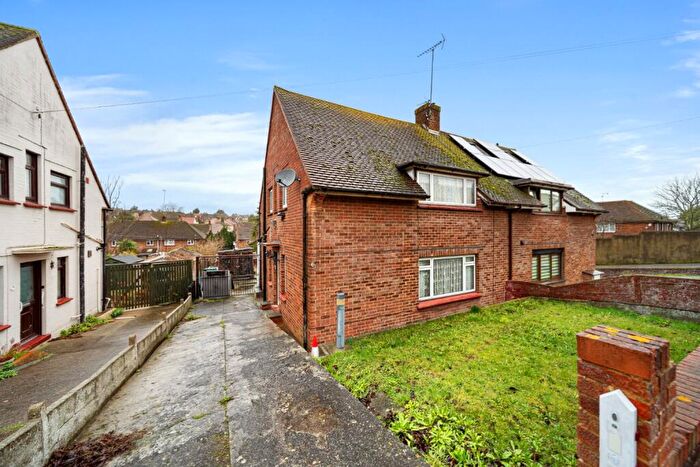
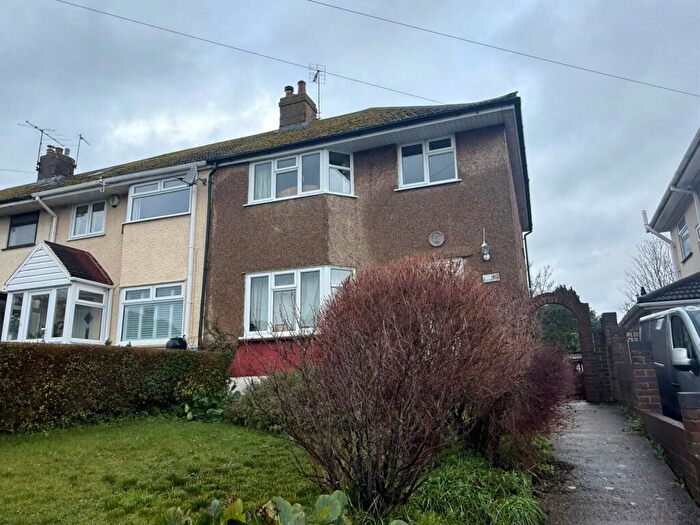
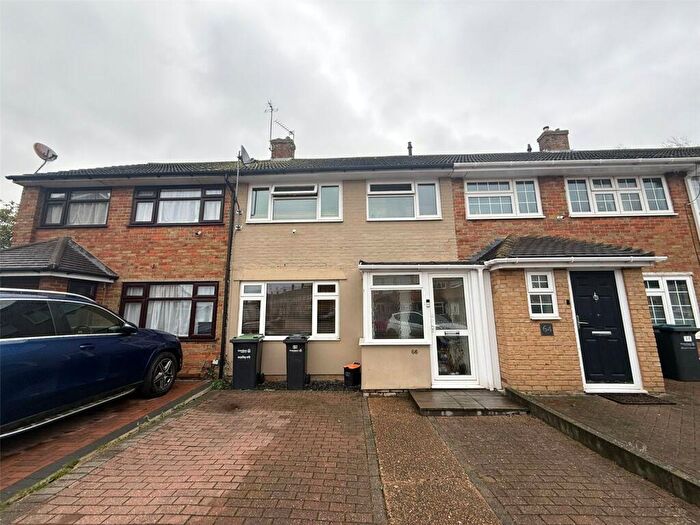
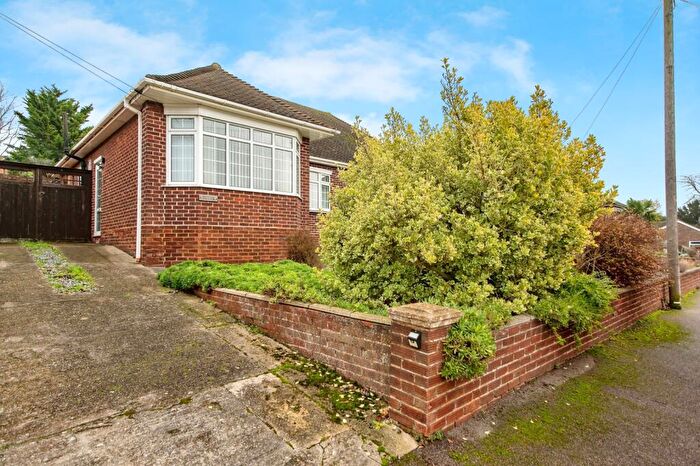
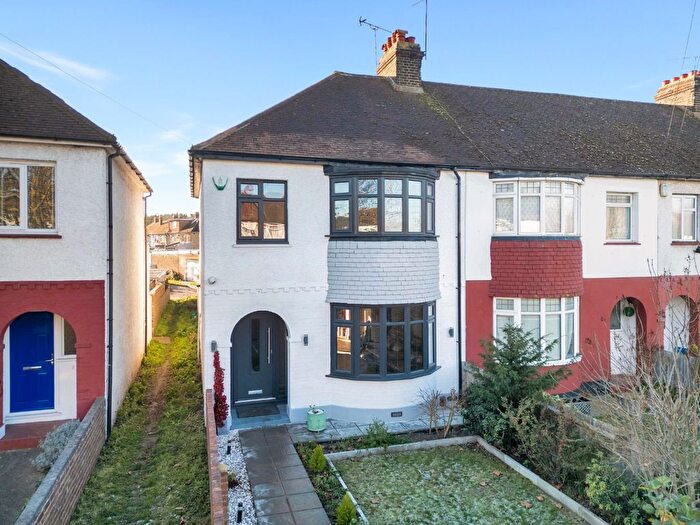
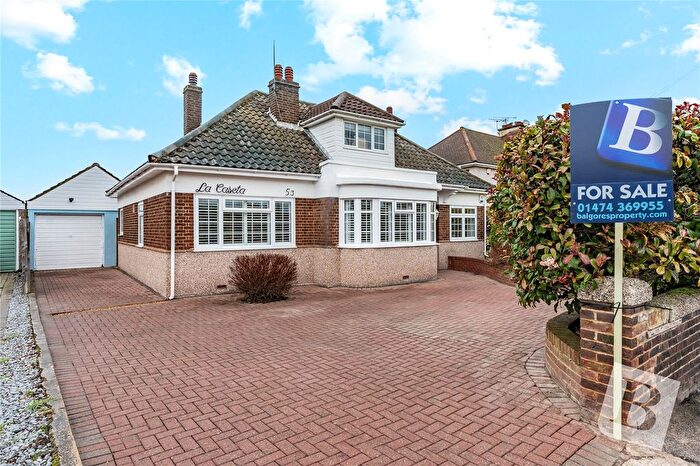
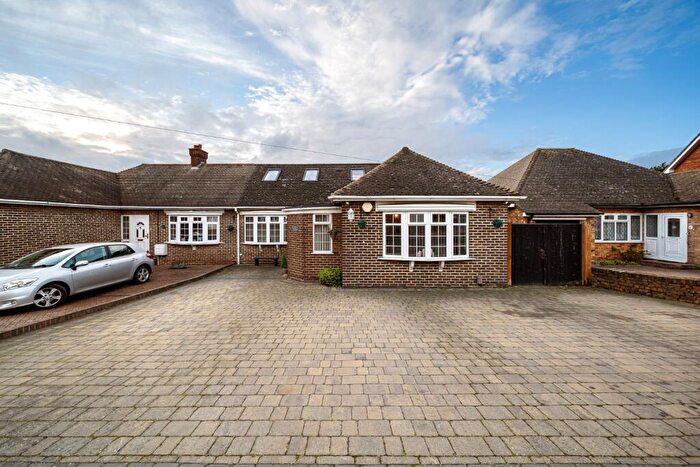
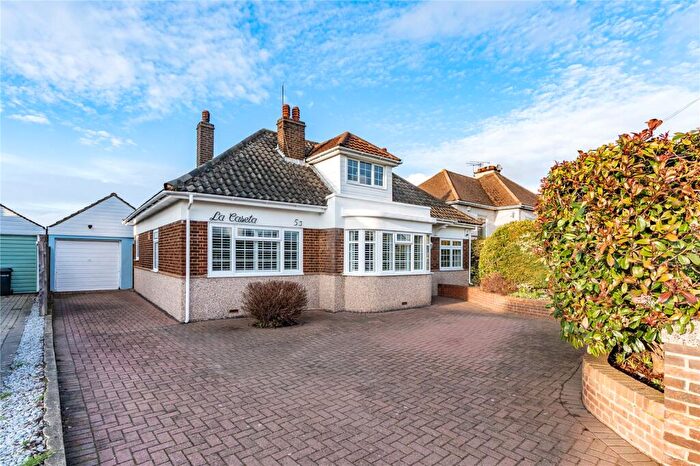
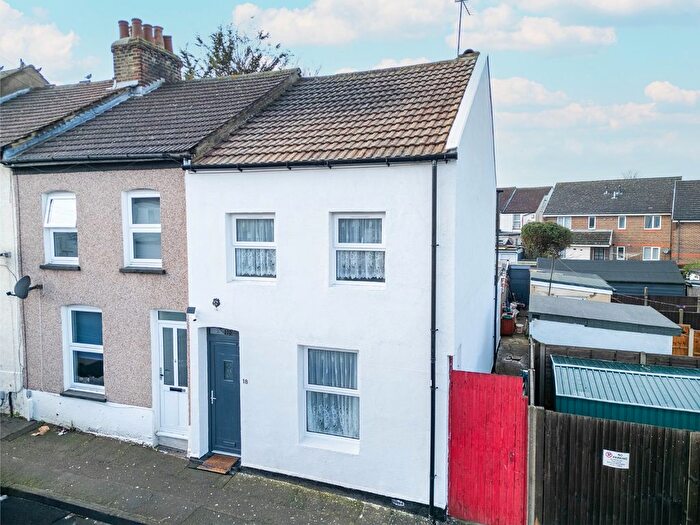
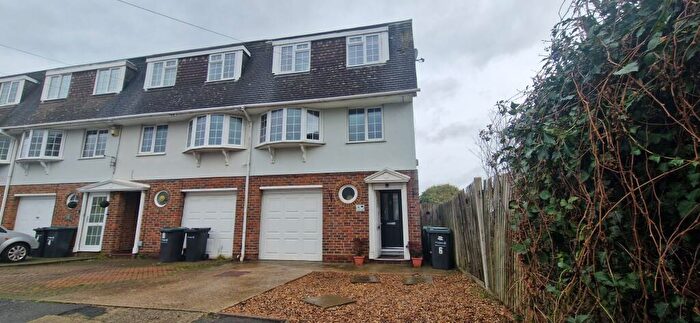
Houses for sale & to rent in Westcourt, Gravesend
House Prices in Westcourt
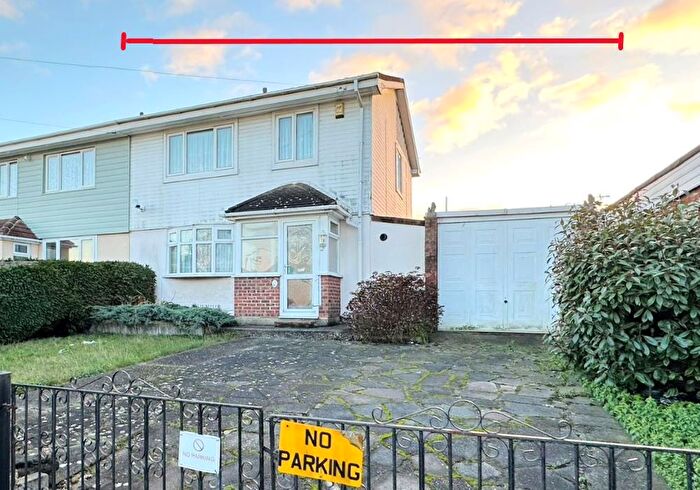
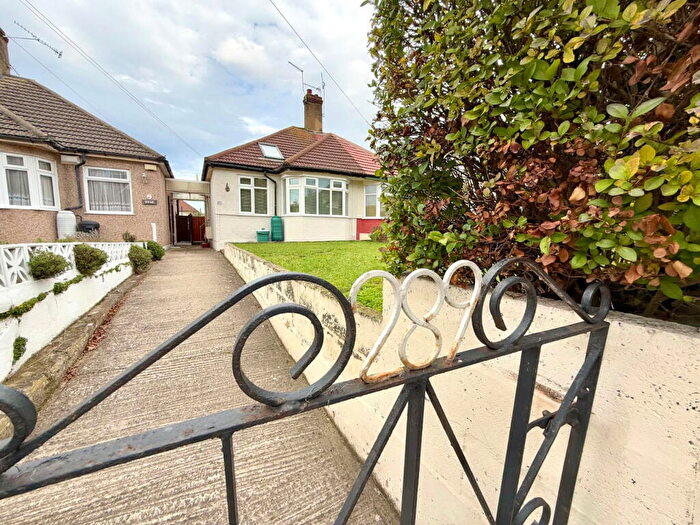
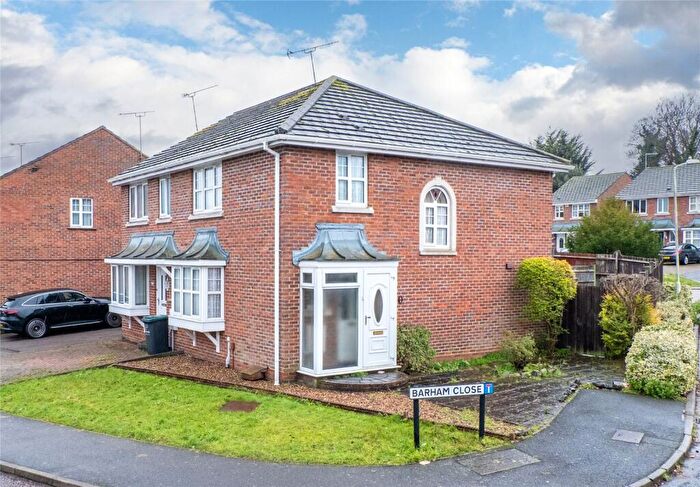
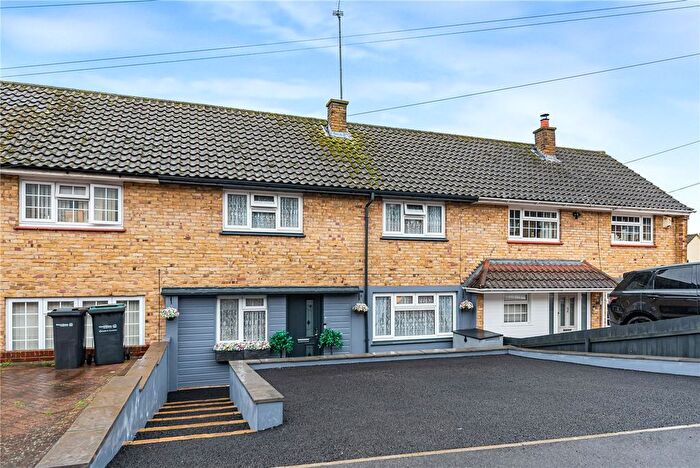
Properties in Westcourt have an average house price of £343,741.00 and had 155 Property Transactions within the last 3 years¹.
Westcourt is an area in Gravesend, Kent with 2,659 households², where the most expensive property was sold for £630,000.00.
Properties for sale in Westcourt
Roads and Postcodes in Westcourt
Navigate through our locations to find the location of your next house in Westcourt, Gravesend for sale or to rent.
Transport near Westcourt
-
Gravesend Station
-
Tilbury Town Station
-
Sole Street Station
-
Higham Station
-
Meopham Station
-
Northfleet Station
-
Ebbsfleet International Station
-
Swanscombe Station
-
East Tilbury Station
-
Longfield Station
- FAQ
- Price Paid By Year
- Property Type Price
Frequently asked questions about Westcourt
What is the average price for a property for sale in Westcourt?
The average price for a property for sale in Westcourt is £343,741. This amount is 6% lower than the average price in Gravesend. There are 1,294 property listings for sale in Westcourt.
What streets have the most expensive properties for sale in Westcourt?
The streets with the most expensive properties for sale in Westcourt are St Francis Avenue at an average of £476,750, Forge Lane at an average of £435,000 and Thong Lane at an average of £434,722.
What streets have the most affordable properties for sale in Westcourt?
The streets with the most affordable properties for sale in Westcourt are St Patricks Gardens at an average of £180,000, Bourne Road at an average of £191,760 and St Benedicts Avenue at an average of £205,000.
Which train stations are available in or near Westcourt?
Some of the train stations available in or near Westcourt are Gravesend, Tilbury Town and Sole Street.
Property Price Paid in Westcourt by Year
The average sold property price by year was:
| Year | Average Sold Price | Price Change |
Sold Properties
|
|---|---|---|---|
| 2025 | £354,580 | 4% |
45 Properties |
| 2024 | £340,258 | 1% |
59 Properties |
| 2023 | £338,206 | -4% |
51 Properties |
| 2022 | £351,468 | 11% |
55 Properties |
| 2021 | £311,822 | 4% |
82 Properties |
| 2020 | £300,694 | 6% |
45 Properties |
| 2019 | £283,739 | -1% |
67 Properties |
| 2018 | £285,523 | 6% |
52 Properties |
| 2017 | £268,039 | -1% |
69 Properties |
| 2016 | £270,358 | 17% |
78 Properties |
| 2015 | £224,706 | 14% |
83 Properties |
| 2014 | £194,340 | 13% |
87 Properties |
| 2013 | £169,329 | -9% |
60 Properties |
| 2012 | £184,587 | 12% |
57 Properties |
| 2011 | £161,919 | 9% |
52 Properties |
| 2010 | £148,130 | -10% |
48 Properties |
| 2009 | £162,489 | -12% |
51 Properties |
| 2008 | £182,677 | 3% |
55 Properties |
| 2007 | £176,587 | 9% |
105 Properties |
| 2006 | £161,072 | 3% |
108 Properties |
| 2005 | £156,203 | -1% |
76 Properties |
| 2004 | £158,469 | 12% |
96 Properties |
| 2003 | £139,320 | 17% |
90 Properties |
| 2002 | £116,227 | 14% |
118 Properties |
| 2001 | £100,348 | 18% |
60 Properties |
| 2000 | £82,352 | 11% |
81 Properties |
| 1999 | £73,684 | 11% |
70 Properties |
| 1998 | £65,719 | 2% |
62 Properties |
| 1997 | £64,360 | 10% |
73 Properties |
| 1996 | £58,043 | -0,2% |
68 Properties |
| 1995 | £58,151 | - |
68 Properties |
Property Price per Property Type in Westcourt
Here you can find historic sold price data in order to help with your property search.
The average Property Paid Price for specific property types in the last three years are:
| Property Type | Average Sold Price | Sold Properties |
|---|---|---|
| Semi Detached House | £366,445.00 | 68 Semi Detached Houses |
| Detached House | £457,142.00 | 7 Detached Houses |
| Terraced House | £325,495.00 | 74 Terraced Houses |
| Flat | £179,166.00 | 6 Flats |

