
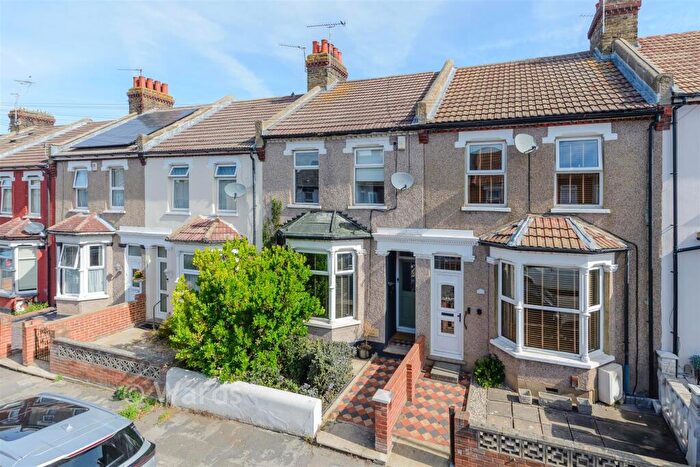
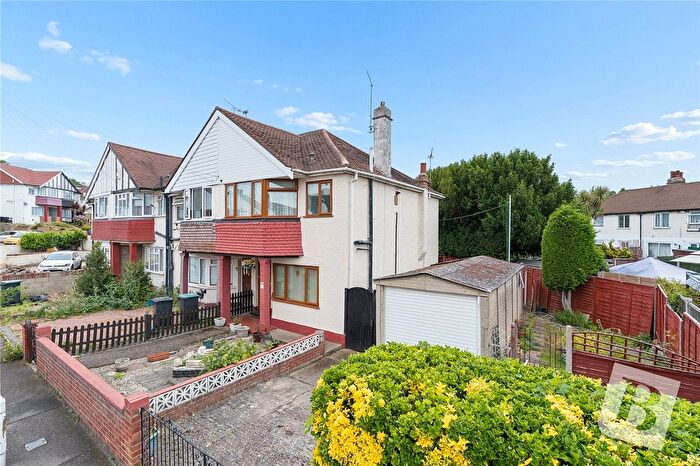
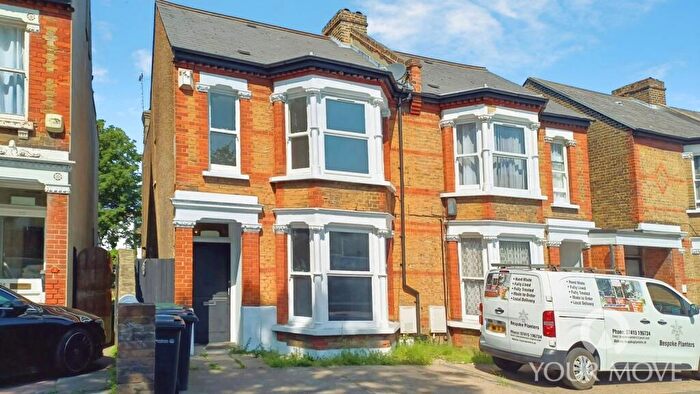
Houses for sale in Pelham, Gravesend
House Prices in Pelham
Properties in Pelham have an average house price of £261k and had 281 Property Transactions within the last 3 years¹.
Pelham is an area in Gravesend, Kent with 3,310 households², where the most expensive property was sold for £904k.
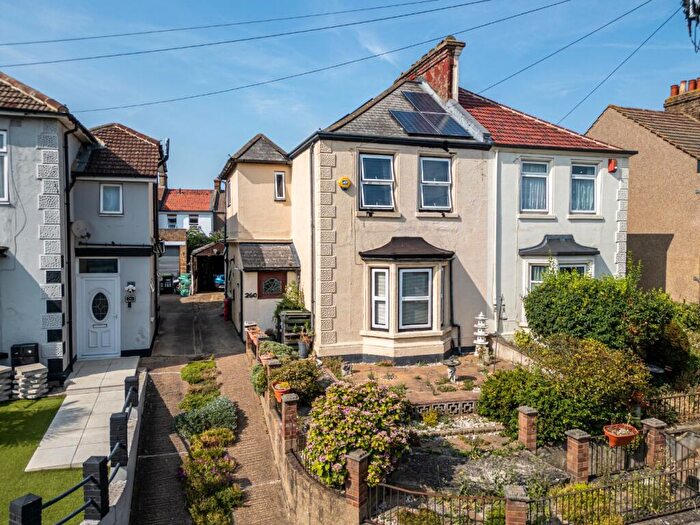
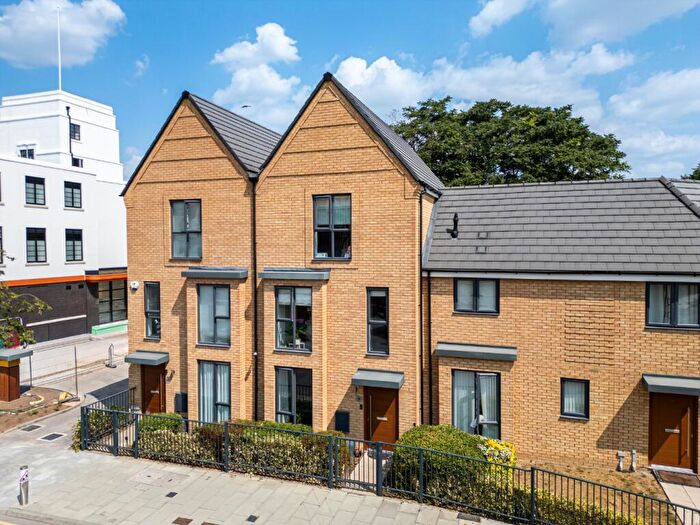
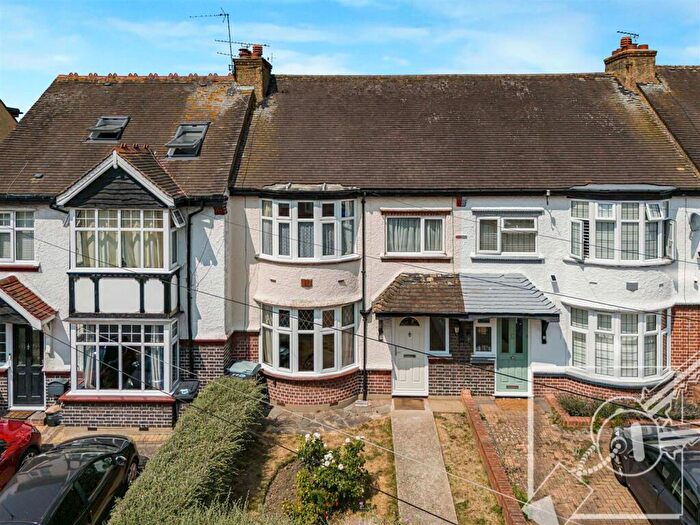
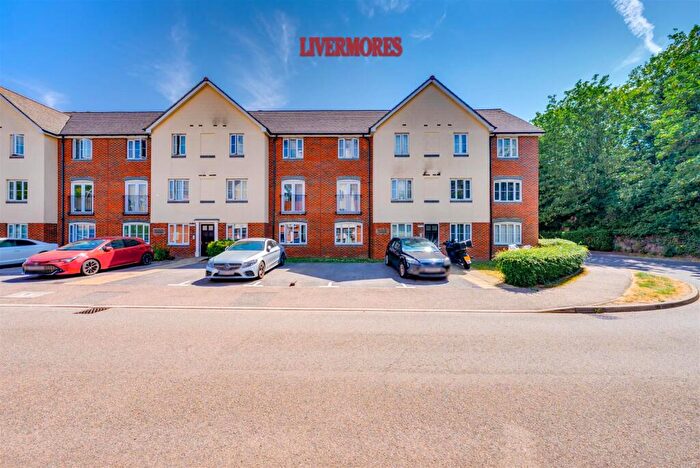
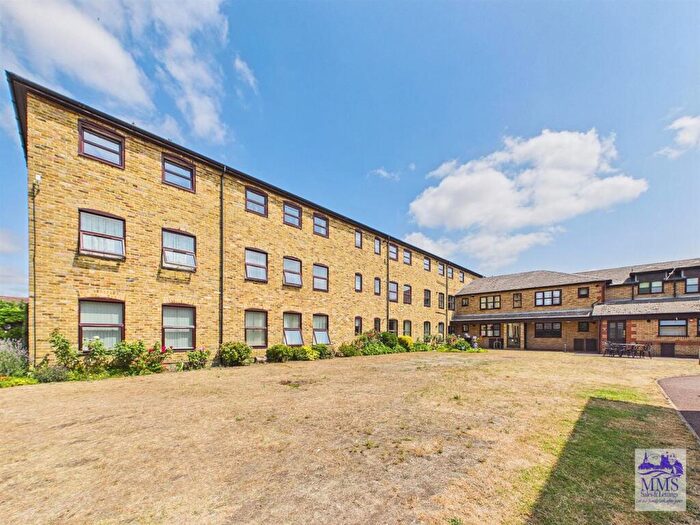
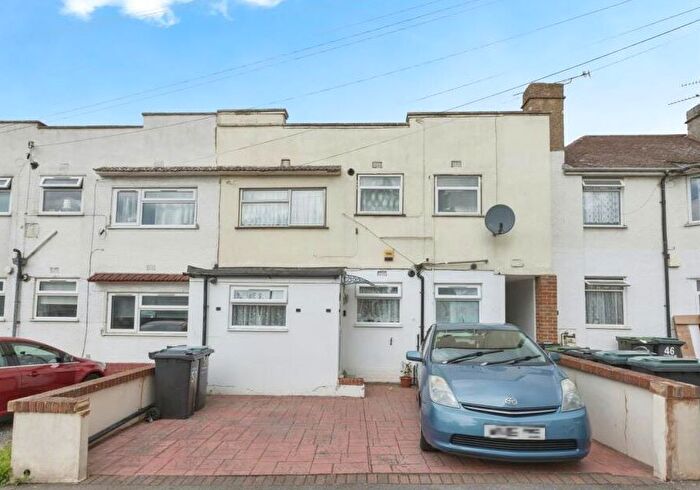
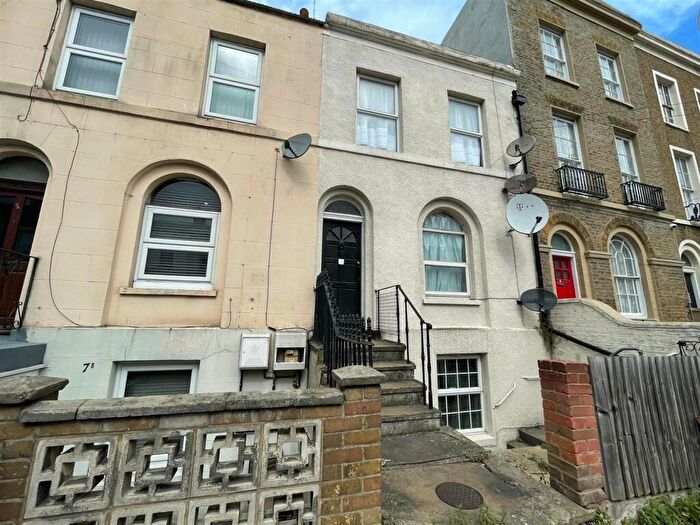
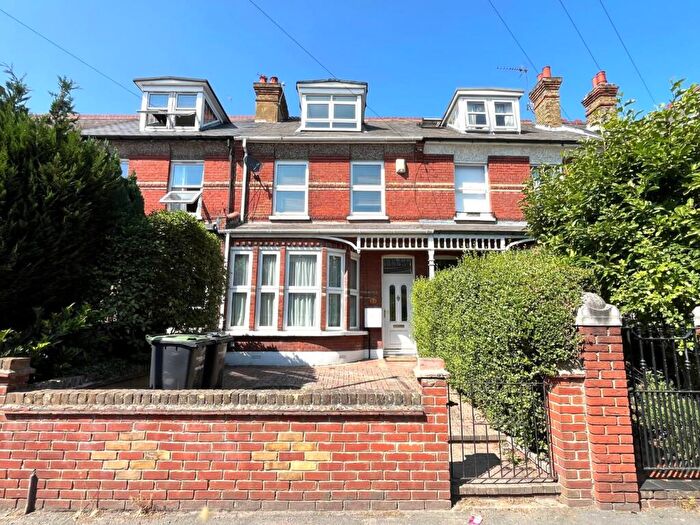
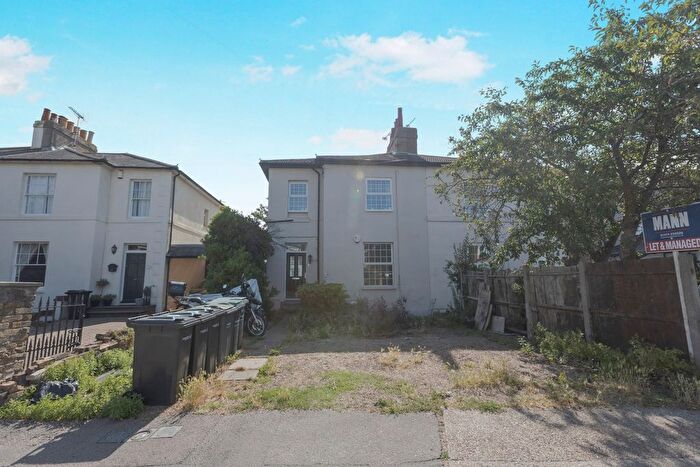
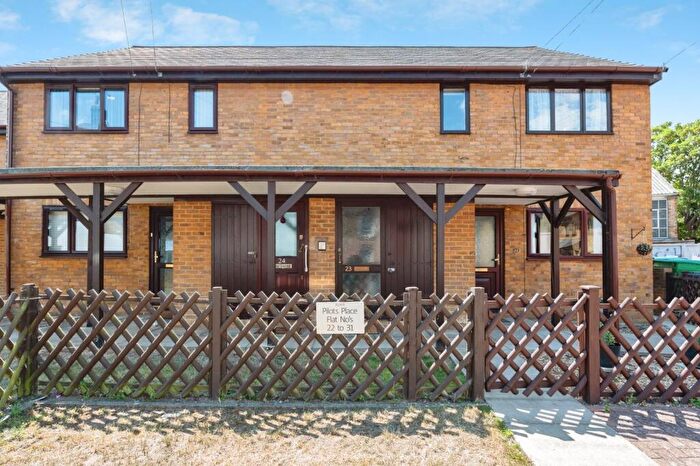
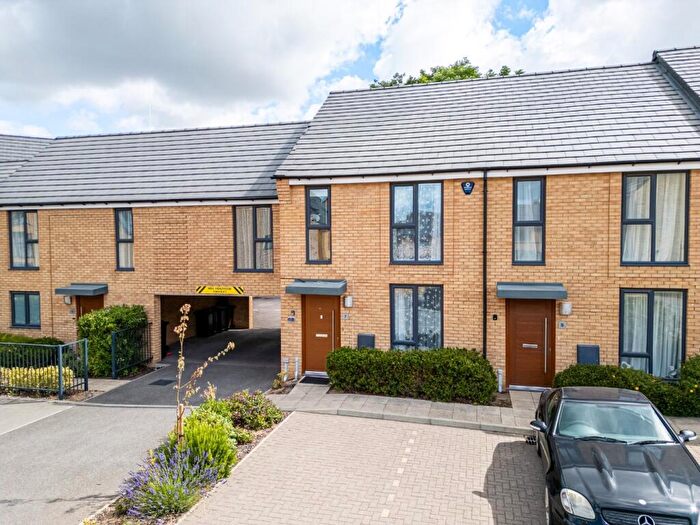
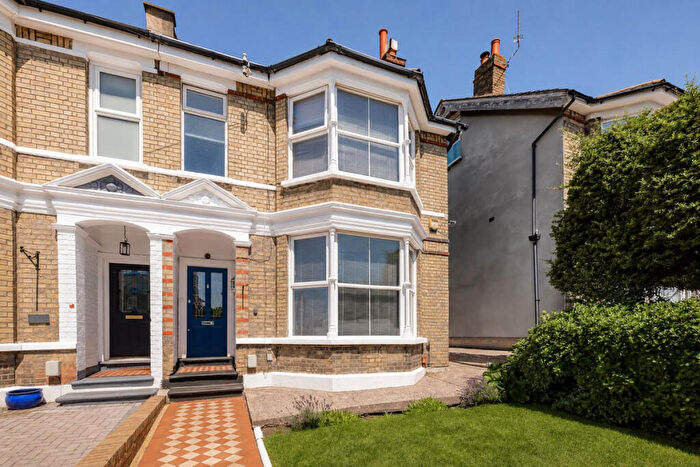
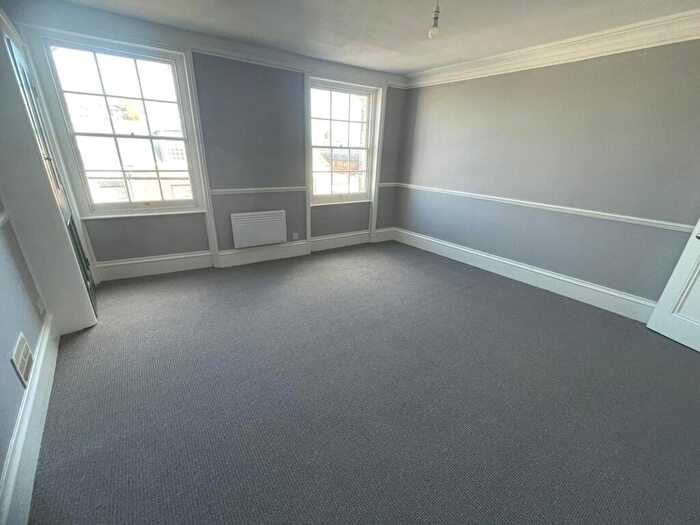
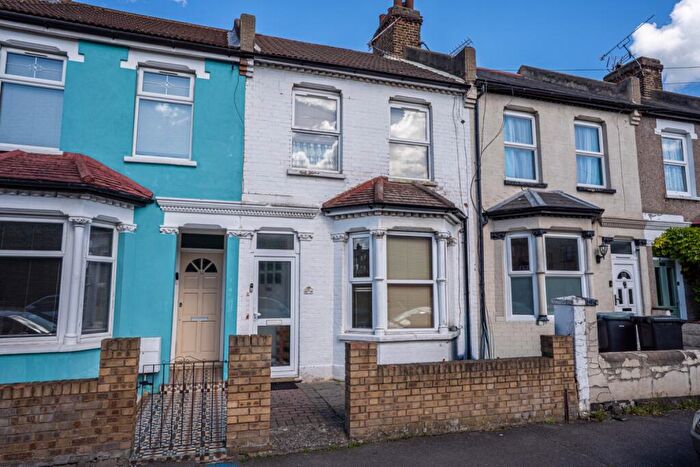
Properties for sale in Pelham
![]()
If you are looking to sell your house, let it out, or receive a property valuation, an expert can help you.
Click the button below to get started.


Roads and Postcodes in Pelham
Navigate through our locations to find the location of your next house in Pelham, Gravesend for sale or to rent.
Property price trends in Pelham
According to the latest Land Registry data, the average home in Pelham sold for £263,944 in 2026. That figure comes from 4,306 sales logged over the past 31 years.
Prices have softened over the last three years. Compared with 2023, when the typical sale came in around £270,314, that's a fall of roughly 2.4%.
Looking back five years, average prices are down about 1.2% since 2021, a drop of around £3,073 in cash terms.
Zoom out to the past decade for the fuller picture. Back in 2016, homes here averaged £227,990, so the typical sold price has climbed about 15.8% since then, roughly 1.5% a year. Stretch the view to fifteen years and that annual pace edges up closer to 2.3%.
Frequently asked questions about Pelham
What is the average price for a property for sale in Pelham?
The average price for a property for sale in Pelham is £261,492. This amount is 29% lower than the average price in Gravesend. There are 2,160 property listings for sale in Pelham.
What streets have the most expensive properties for sale in Pelham?
The streets with the most expensive properties for sale in Pelham are Lennox Road at an average of £545,000, Essex Road at an average of £537,437 and The Avenue at an average of £503,583.
What streets have the most affordable properties for sale in Pelham?
The streets with the most affordable properties for sale in Pelham are Clifton Road at an average of £131,107, Overcliffe at an average of £150,750 and West Street at an average of £150,954.
Which train stations are available in or near Pelham?
Some of the train stations available in or near Pelham are Gravesend, Tilbury Town and Northfleet.
Property Price Paid in Pelham by Year
The average sold property price by year was:
| Year | Average Sold Price | Price Change |
Sold Properties
|
|---|---|---|---|
| 2026 | £263,944 | 2% |
9 Properties |
| 2025 | £257,555 | 1% |
81 Properties |
| 2024 | £253,788 | -7% |
84 Properties |
| 2023 | £270,314 | -4% |
107 Properties |
| 2022 | £281,530 | 5% |
129 Properties |
| 2021 | £267,017 | 5% |
133 Properties |
| 2020 | £253,553 | 6% |
93 Properties |
| 2019 | £237,235 | 1% |
100 Properties |
| 2018 | £235,716 | -3% |
111 Properties |
| 2017 | £243,819 | 6% |
135 Properties |
Property Price per Property Type in Pelham
Here you can find historic sold price data in order to help with your property search.
The average Property Paid Price for specific property types in the last three years are:
| Property Type | Average Sold Price | Sold Properties |
|---|---|---|
| Flat | £162,914.00 | 155 Flats |
| Semi Detached House | £456,016.00 | 30 Semi Detached Houses |
| Detached House | £577,406.00 | 16 Detached Houses |
| Terraced House | £316,357.00 | 80 Terraced Houses |
