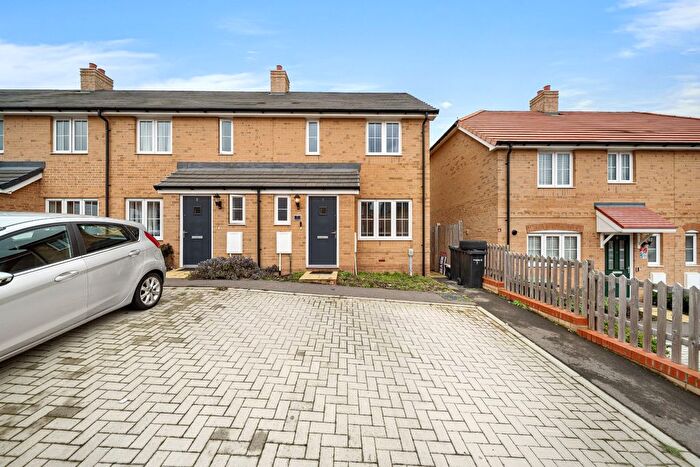
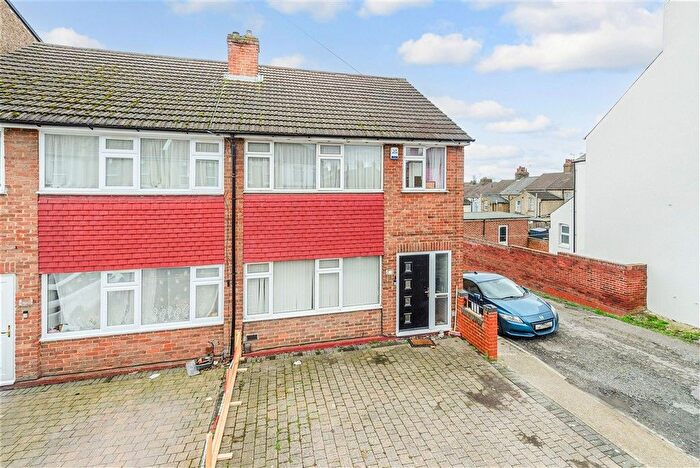
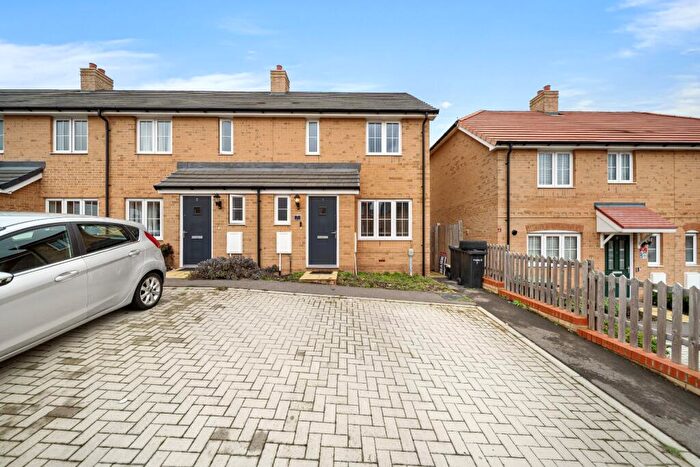
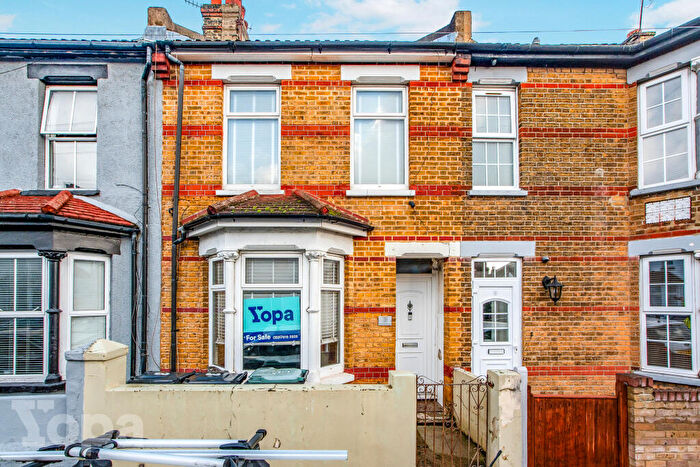
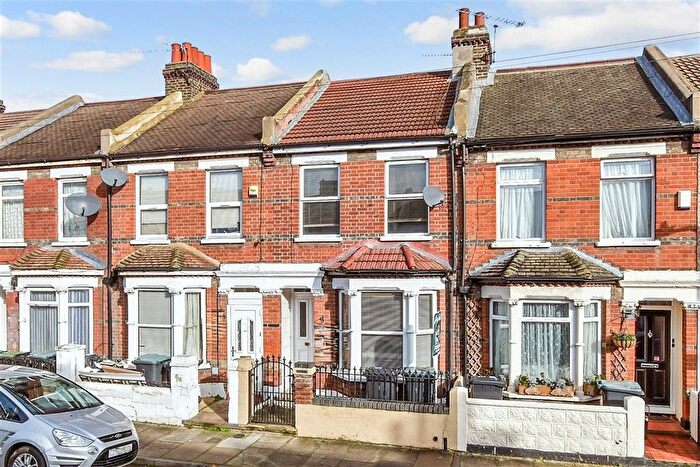
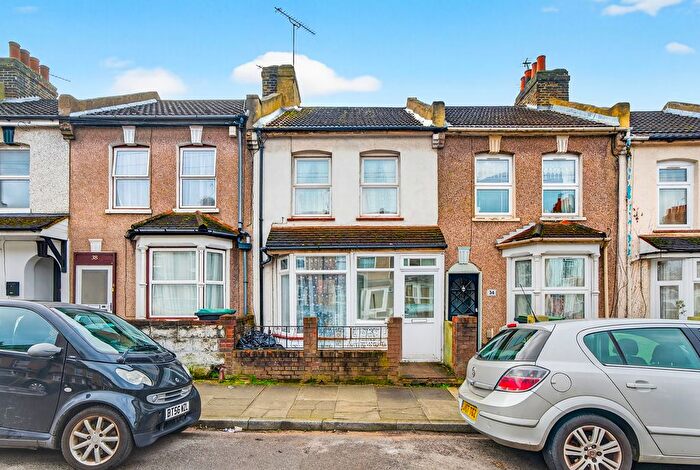
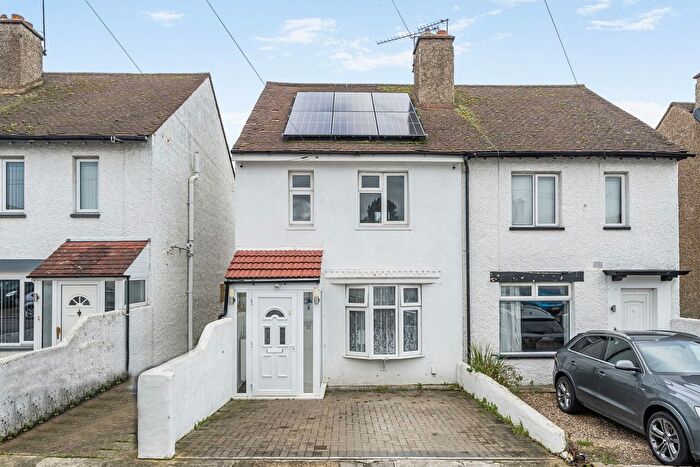
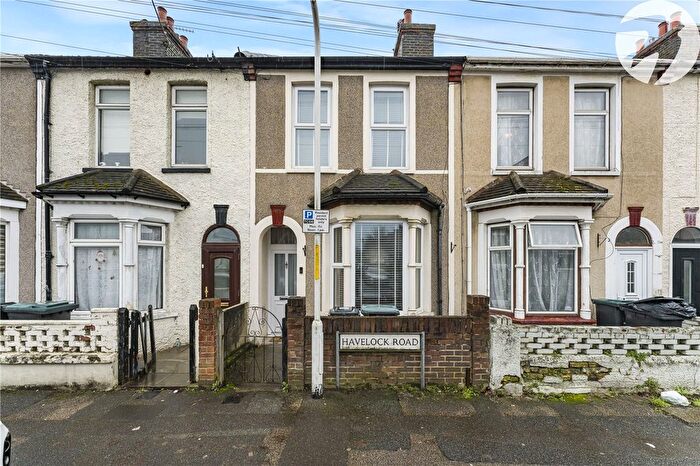
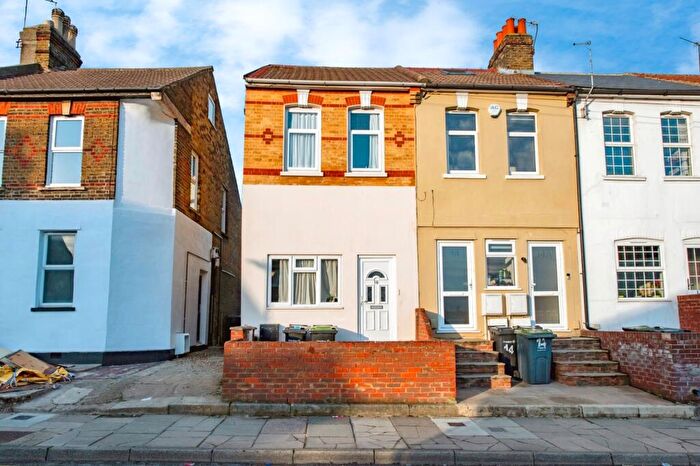
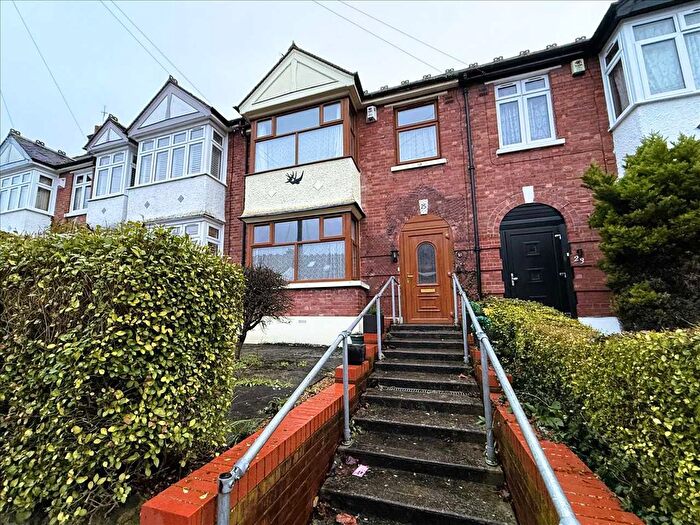
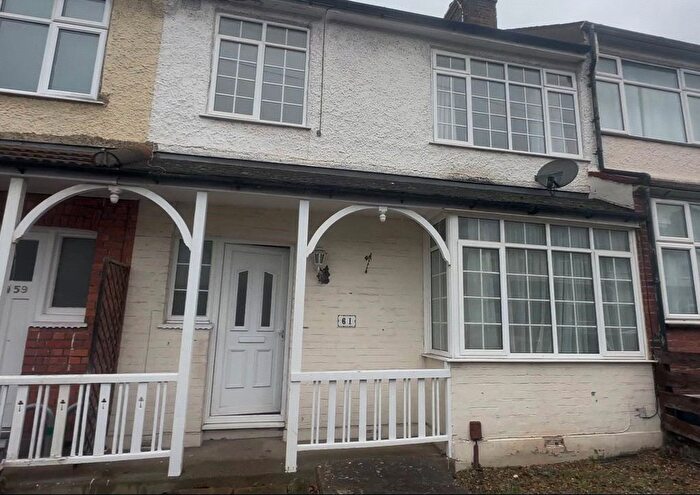
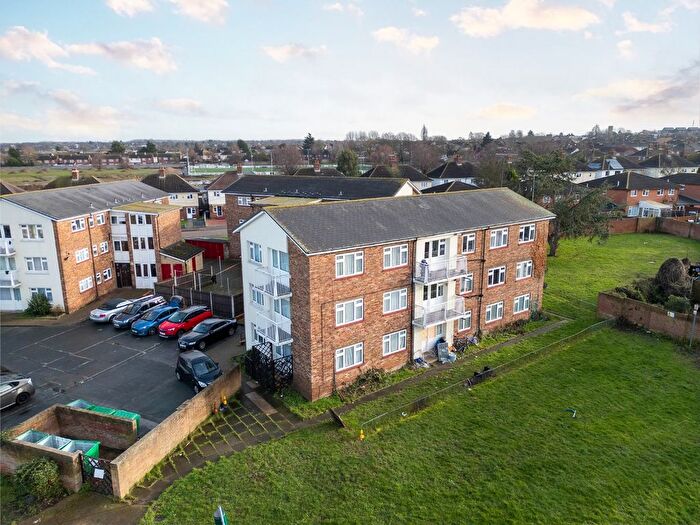
Houses for sale & to rent in Coldharbour, Gravesend
House Prices in Coldharbour
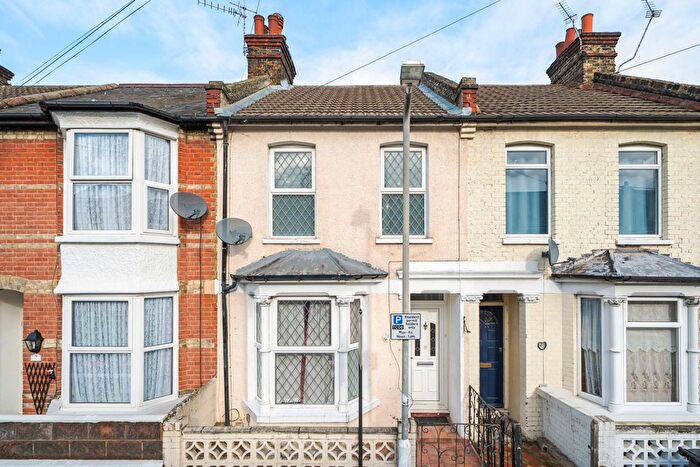
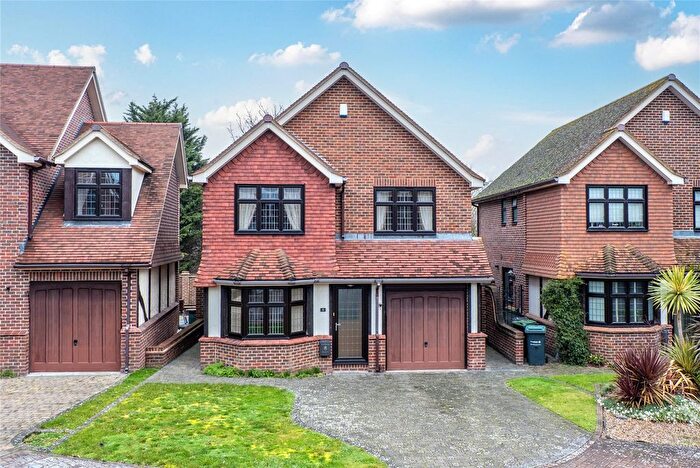
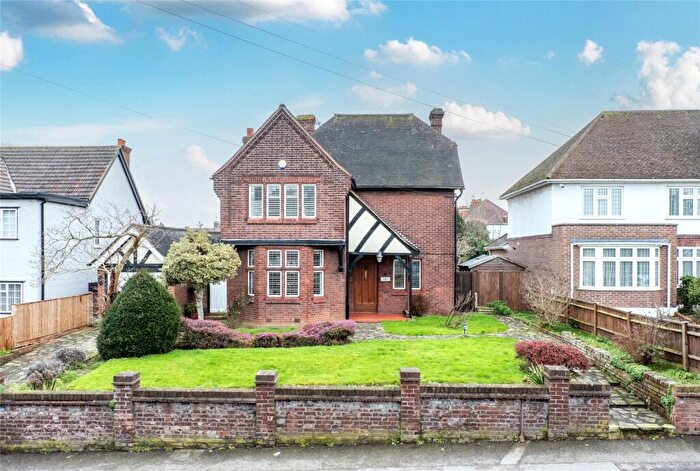
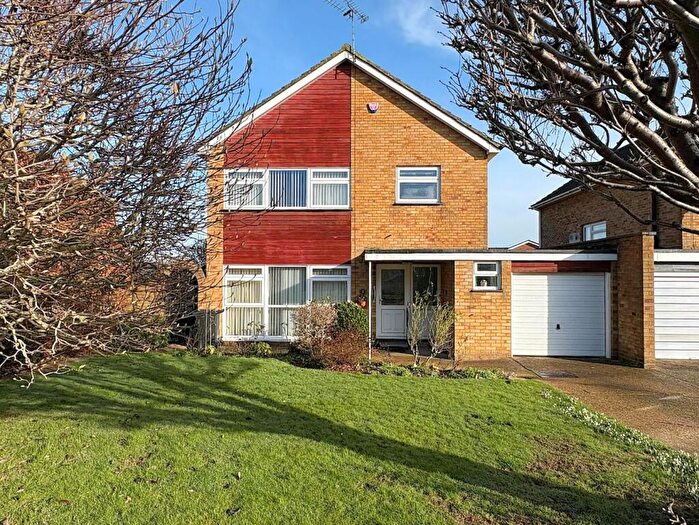
Properties in Coldharbour have an average house price of £316,173.00 and had 119 Property Transactions within the last 3 years¹.
Coldharbour is an area in Gravesend, Kent with 1,928 households², where the most expensive property was sold for £664,000.00.
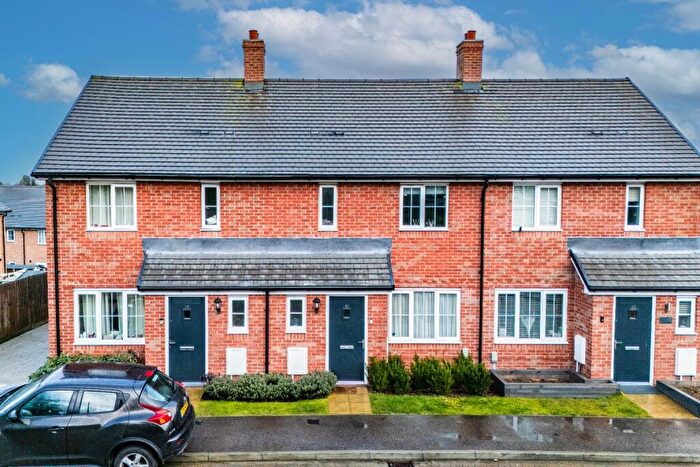
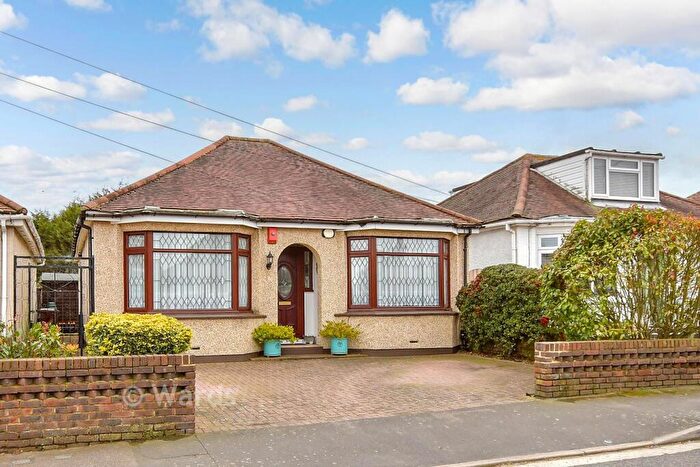
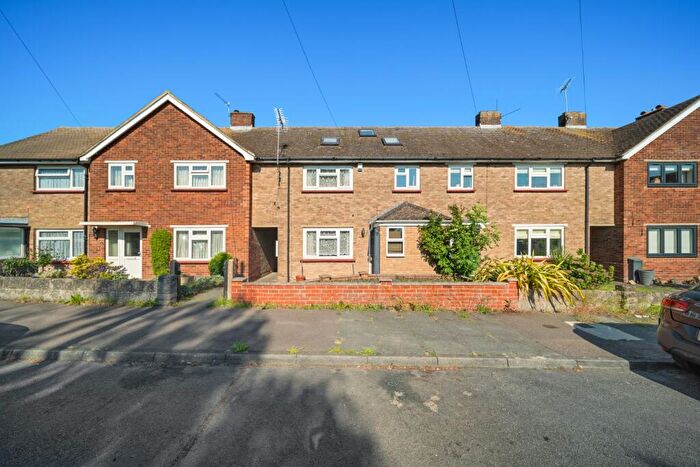
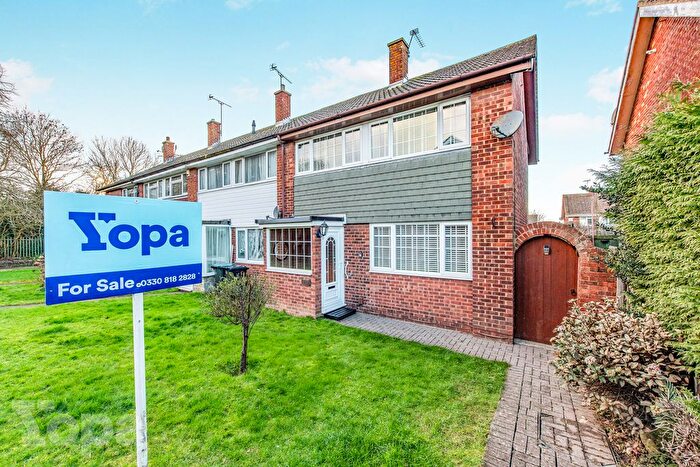
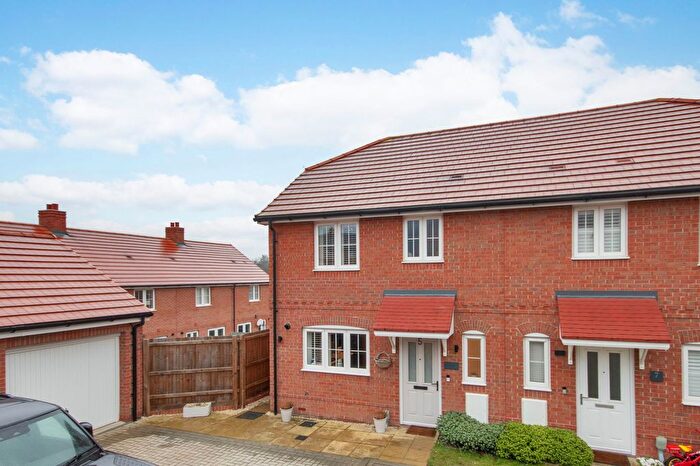
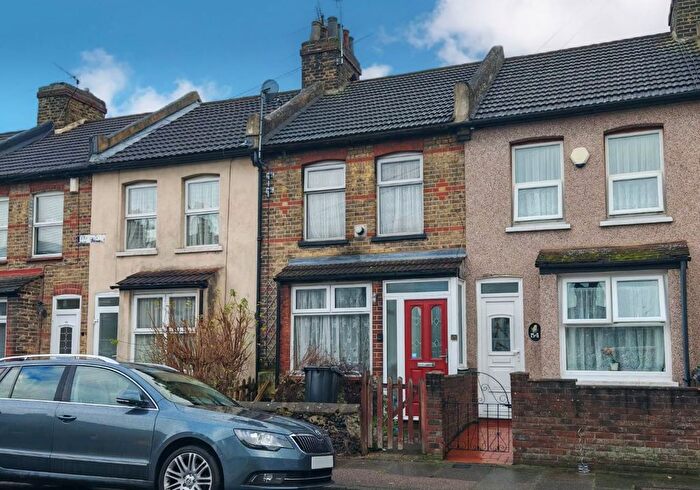
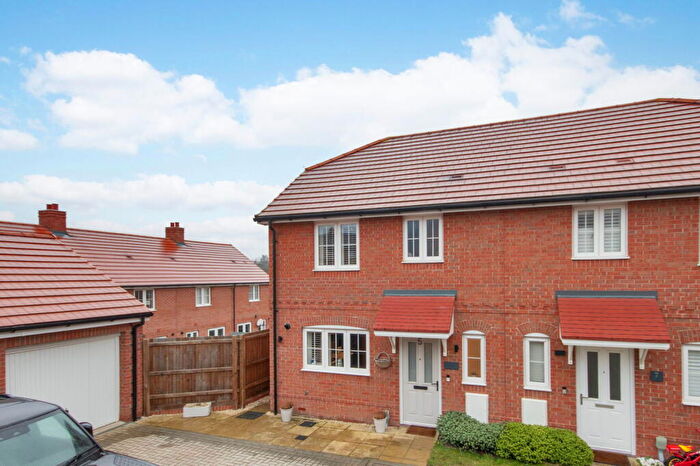
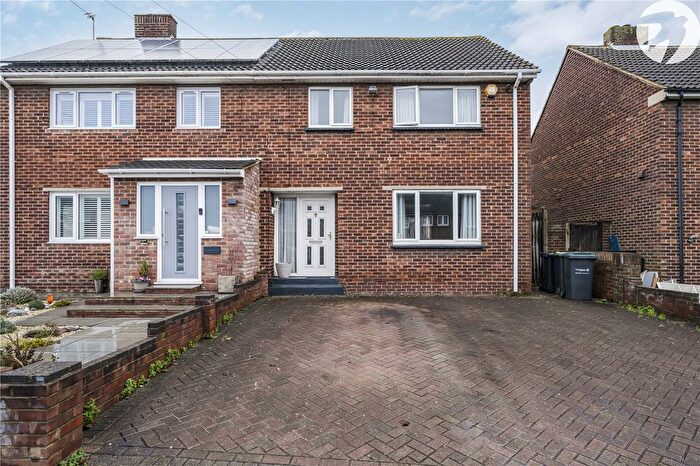
Properties for sale in Coldharbour
Roads and Postcodes in Coldharbour
Navigate through our locations to find the location of your next house in Coldharbour, Gravesend for sale or to rent.
| Streets | Postcodes |
|---|---|
| Alders Court | DA11 7FB |
| Alfred Place | DA11 7AU |
| Austin Road | DA11 7BP |
| Barnfield | DA11 7ND |
| Beatrice Gardens | DA11 7AP |
| Bedford Road | DA11 7BL |
| Boucher Drive | DA11 7JA |
| Bucks Cross Road | DA11 7EL DA11 7ES |
| Carters Row | DA11 7BD |
| Cobham Terrace | DA11 7AN |
| Coldharbour Road | DA11 8AE DA11 8AF DA11 7HQ DA11 8NT |
| Coopers Road | DA11 7AH DA11 7AS DA11 7BA DA11 7DD |
| Cygnet Gardens | DA11 7DN DA11 7DW |
| Dashwood Road | DA11 7LY DA11 7DA |
| Earl Road | DA11 7AF |
| Farlow Close | DA11 7JD |
| Farmcroft | DA11 7LT |
| Field Court | DA11 7AB |
| Garden Row | DA11 7JP |
| Gilbert Row | DA11 7ET |
| Gill Crescent | DA11 7JJ |
| Greenhill Road | DA11 7EY DA11 7EZ |
| Grieves Road | DA11 7JG DA11 7JQ |
| Harden Road | DA11 7DL DA11 7DP DA11 7DS DA11 7HE DA11 7HF DA11 7DR DA11 7DU |
| Hardy Avenue | DA11 7EN DA11 7EW |
| Hartshill Road | DA11 7DY DA11 7DX DA11 7DZ |
| Haynes Road | DA11 7HL DA11 7HN DA11 7HY DA11 7HZ DA11 7JR |
| Henry Gardens | DA11 7DB |
| Jenkins Close | DA11 7HA |
| Lanes Avenue | DA11 7HR DA11 7HS |
| Lawrance Square | DA11 7HW |
| Marks Square | DA11 7HT DA11 7HU |
| Milroy Avenue | DA11 7AY DA11 7AZ |
| Napier Road | DA11 7BY DA11 7BZ DA11 7BX |
| Nelson Road | DA11 7ED DA11 7EE DA11 7EF |
| New House Lane | DA11 7HJ DA11 7JL DA11 7JN DA11 7JW DA11 7HH |
| Newmans Road | DA11 7AX |
| Newton Abbot Road | DA11 7DT |
| Packham Road | DA11 7HX DA11 7JE DA11 7JF DA11 7JH |
| Pelham Road South | DA11 8QT |
| Perry Street | DA11 8RA DA11 8RB DA11 8RD |
| Salisbury Road | DA11 7DE |
| Seymour Road | DA11 7BN DA11 7BW |
| Snelling Avenue | DA11 7EA DA11 7EG DA11 7EH DA11 7EP DA11 7EQ DA11 7ER |
| St Clements Close | DA11 7RU |
| St Margarets Road | DA11 7AJ |
| St Thomas Road | DA11 7AL |
| Stanley Road | DA11 7AR |
| Struttons Avenue | DA11 7EJ |
| Sunning Hill | DA11 8AH |
| The Crescent | DA11 7EB |
| The Downage | DA11 7NB |
| Westcott Avenue | DA11 7HP |
| White Avenue | DA11 7JB |
| Wycliffe Row | DA11 7BH DA11 7BE |
Transport near Coldharbour
-
Gravesend Station
-
Ebbsfleet International Station
-
Northfleet Station
-
Tilbury Town Station
-
Swanscombe Station
-
Meopham Station
- FAQ
- Price Paid By Year
- Property Type Price
Frequently asked questions about Coldharbour
What is the average price for a property for sale in Coldharbour?
The average price for a property for sale in Coldharbour is £316,173. This amount is 14% lower than the average price in Gravesend. There are 1,772 property listings for sale in Coldharbour.
What streets have the most expensive properties for sale in Coldharbour?
The streets with the most expensive properties for sale in Coldharbour are Coldharbour Road at an average of £477,500, Sunning Hill at an average of £412,500 and Packham Road at an average of £386,500.
What streets have the most affordable properties for sale in Coldharbour?
The streets with the most affordable properties for sale in Coldharbour are Dashwood Road at an average of £137,666, Garden Row at an average of £170,000 and St Margarets Road at an average of £207,500.
Which train stations are available in or near Coldharbour?
Some of the train stations available in or near Coldharbour are Gravesend, Ebbsfleet International and Northfleet.
Property Price Paid in Coldharbour by Year
The average sold property price by year was:
| Year | Average Sold Price | Price Change |
Sold Properties
|
|---|---|---|---|
| 2025 | £322,932 | 6% |
37 Properties |
| 2024 | £304,134 | -6% |
41 Properties |
| 2023 | £322,112 | 3% |
41 Properties |
| 2022 | £311,922 | 5% |
46 Properties |
| 2021 | £295,697 | 13% |
69 Properties |
| 2020 | £257,690 | -4% |
35 Properties |
| 2019 | £269,240 | 2% |
52 Properties |
| 2018 | £264,623 | 3% |
42 Properties |
| 2017 | £256,920 | 11% |
47 Properties |
| 2016 | £228,328 | 2% |
38 Properties |
| 2015 | £223,267 | 25% |
63 Properties |
| 2014 | £168,060 | 5% |
48 Properties |
| 2013 | £158,973 | -1% |
43 Properties |
| 2012 | £160,287 | 2% |
54 Properties |
| 2011 | £156,530 | -11% |
33 Properties |
| 2010 | £174,470 | 23% |
35 Properties |
| 2009 | £134,651 | -24% |
33 Properties |
| 2008 | £167,377 | 3% |
54 Properties |
| 2007 | £162,599 | 2% |
72 Properties |
| 2006 | £158,817 | 13% |
73 Properties |
| 2005 | £137,508 | -2% |
74 Properties |
| 2004 | £140,925 | 6% |
92 Properties |
| 2003 | £132,019 | 25% |
64 Properties |
| 2002 | £98,506 | 8% |
92 Properties |
| 2001 | £90,381 | 22% |
85 Properties |
| 2000 | £70,393 | 6% |
49 Properties |
| 1999 | £66,316 | 15% |
53 Properties |
| 1998 | £56,095 | -8% |
76 Properties |
| 1997 | £60,834 | 17% |
52 Properties |
| 1996 | £50,408 | 3% |
41 Properties |
| 1995 | £48,647 | - |
46 Properties |
Property Price per Property Type in Coldharbour
Here you can find historic sold price data in order to help with your property search.
The average Property Paid Price for specific property types in the last three years are:
| Property Type | Average Sold Price | Sold Properties |
|---|---|---|
| Semi Detached House | £353,000.00 | 41 Semi Detached Houses |
| Detached House | £468,000.00 | 4 Detached Houses |
| Terraced House | £303,790.00 | 64 Terraced Houses |
| Flat | £183,699.00 | 10 Flats |

