
Houses for sale in Northfleet South, Gravesend
House Prices in Northfleet South
Properties in Northfleet South have an average house price of £312k and had 278 Property Transactions within the last 3 years¹.
Northfleet South is an area in Gravesend, Kent with 3,344 households², where the most expensive property was sold for £675k.
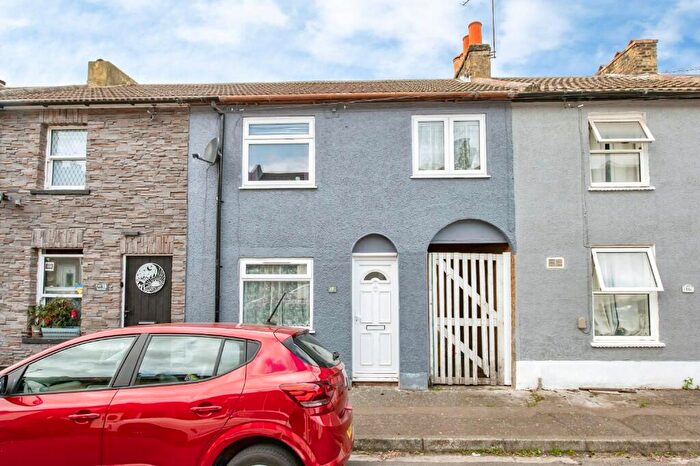
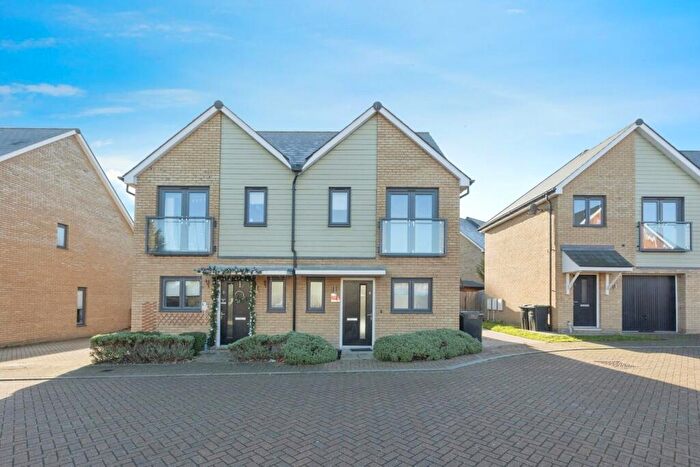
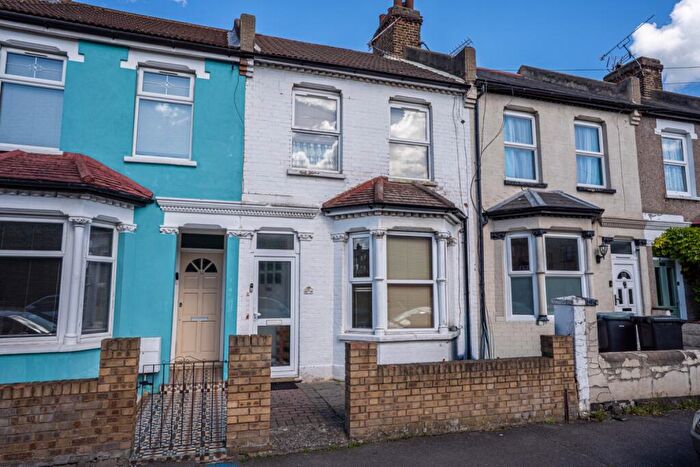
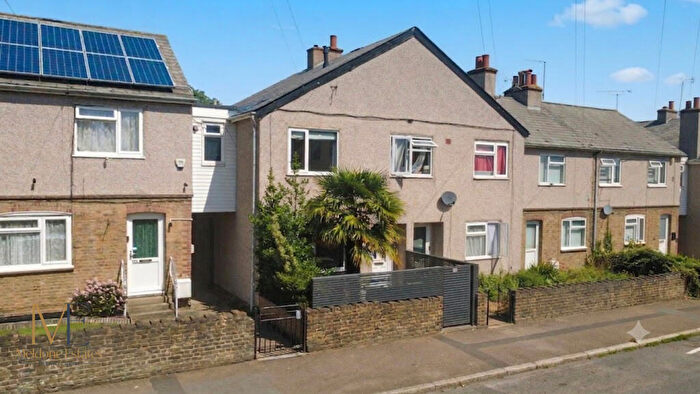
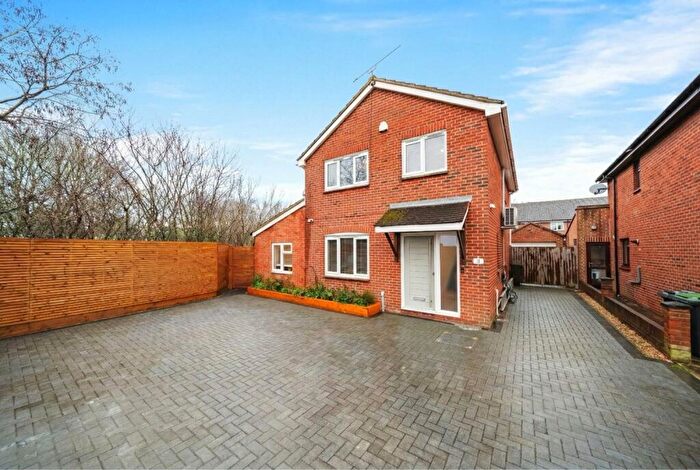
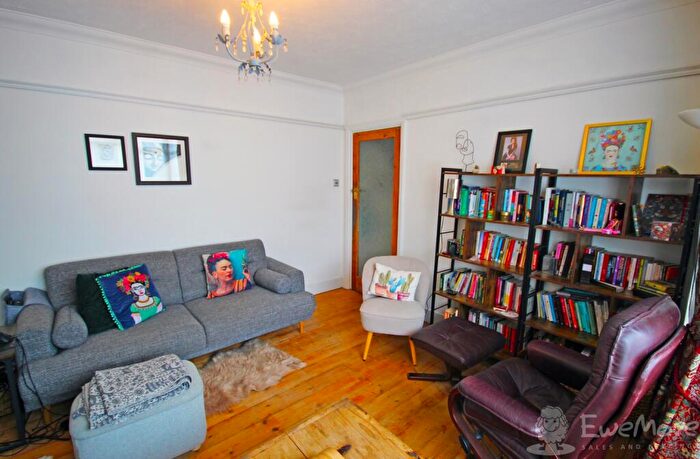
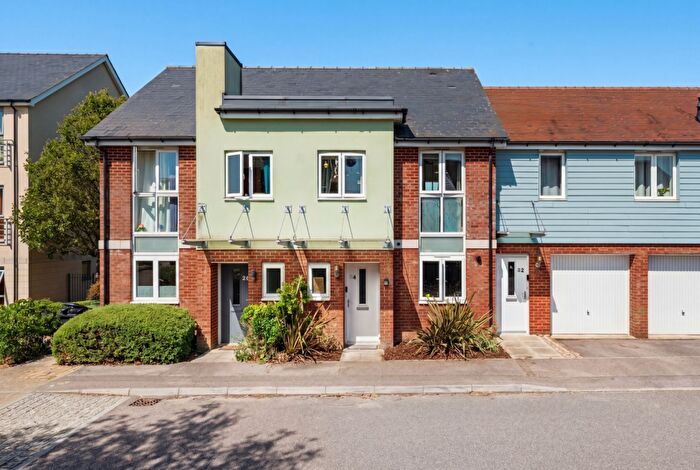
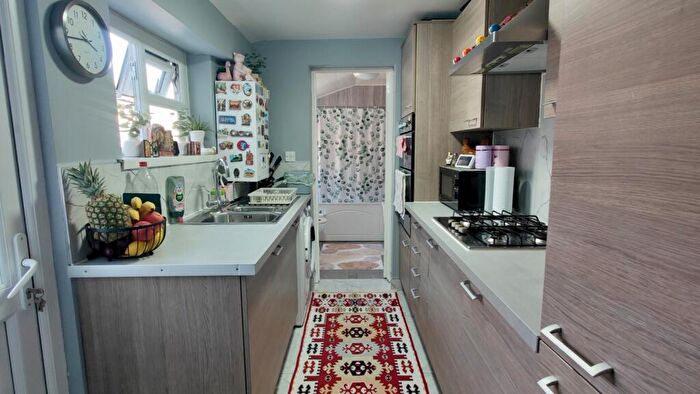
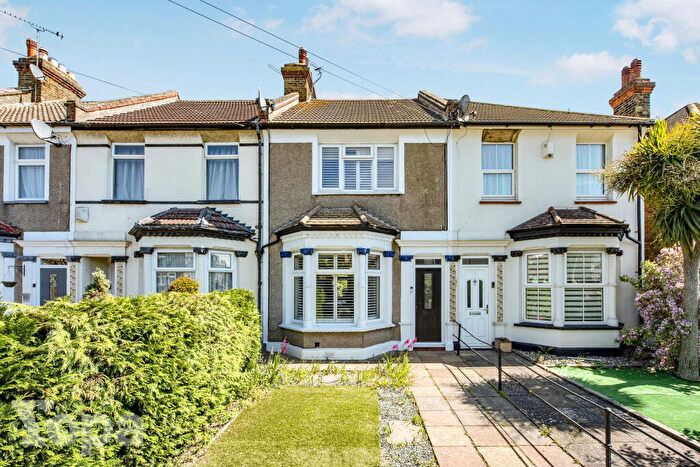
Properties for sale in Northfleet South
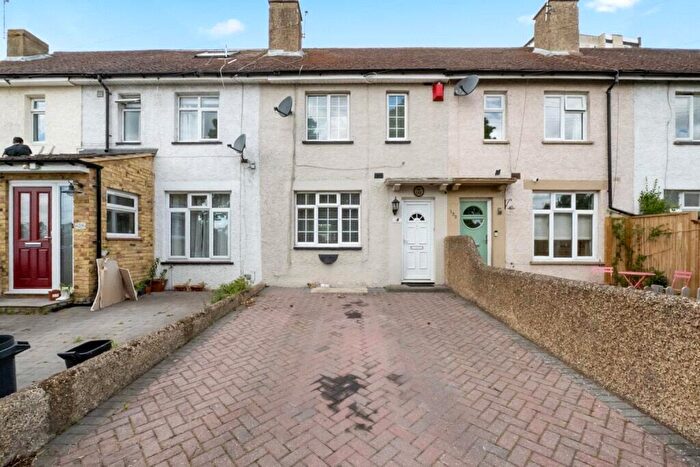
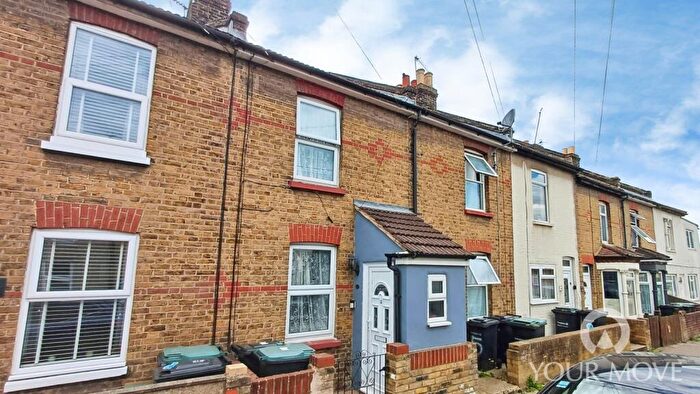
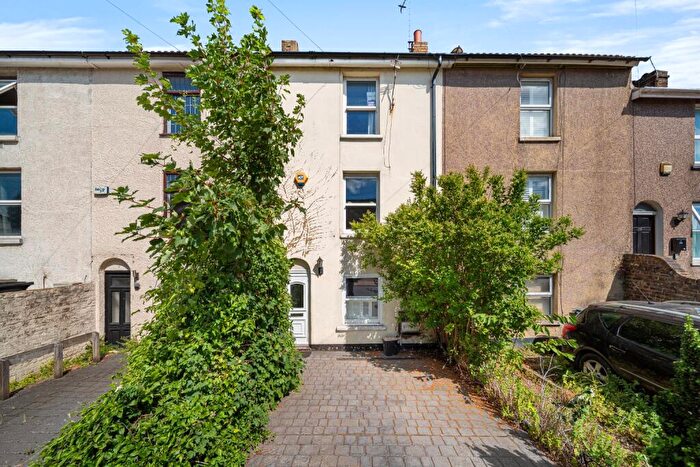
![]()
If you are looking to sell your house, let it out, or receive a property valuation, an expert can help you.
Click the button below to get started.
Roads and Postcodes in Northfleet South
Navigate through our locations to find the location of your next house in Northfleet South, Gravesend for sale or to rent.
| Streets | Postcodes |
|---|---|
| All Saints Road | DA11 8RN DA11 8RW |
| Amsterdam Way | DA11 8GZ |
| Avignon Drive | DA11 8GT |
| Bonham Way | DA11 8FB |
| Brook Road | DA11 8RG DA11 8RQ |
| Camden Close | DA11 8EB |
| Campbell Road | DA11 0JY DA11 0JZ |
| Caxton Park | DA11 8GA |
| Cecil Road | DA11 7BT DA11 7DG DA11 7DQ |
| Chilvers Way | DA11 8GE |
| Churchill Road | DA11 7AG DA11 7AQ |
| Colby Mews | DA11 8FA |
| Colyer Road | DA11 8BG DA11 8AS DA11 8AT DA11 8AY DA11 8AZ DA11 8BA |
| Conrad Mews | DA11 8FW |
| Coulton Avenue | DA11 8DY DA11 8DZ |
| Darwin Rise | DA11 8FJ |
| Davis Avenue | DA11 8DR |
| Detling Road | DA11 8DH |
| Dover Road East | DA11 0RA DA11 0RB DA11 0RD DA11 0RG DA11 0RH DA11 0RQ |
| Earl Road | DA11 7AE |
| Falcon Mews | DA11 8BW |
| Fielden Terrace | DA11 8FN |
| First Avenue | DA11 8DJ |
| Five Ash Road | DA11 0RF |
| Fiveash Road | DA11 0RE |
| Fleet Terrace | DA11 8HR |
| Fleming Court | DA11 8FE |
| Foxwood Grove | DA11 8RT |
| Glebe Road | DA11 8RP |
| Gouge Avenue | DA11 8DP |
| Granville Road | DA11 0JS DA11 0JT DA11 0JU |
| Gwynn Road | DA11 8AP DA11 8AR |
| Haldane Gardens | DA11 8EA |
| Hall Road | DA11 8AJ DA11 8AL DA11 8AN DA11 8AW |
| Havelock Road | DA11 0JG DA11 0JL DA11 0JQ |
| Hindmarsh Crescent | DA11 8FD |
| Holden Place | DA11 8FU |
| Lansdown Place | DA11 8QX |
| Lille Mews | DA11 8GY |
| Lister Drive | DA11 8FF |
| Marlowe Close | DA11 8FX |
| May Avenue | DA11 8RH |
| May Avenue Industrial Estate | DA11 8RU |
| Mayfield Road | DA11 0JP DA11 0JR |
| Mitchell Avenue | DA11 8AU DA11 8AX |
| Northcote Road | DA11 7BS |
| Old Perry Street | DA11 8BT DA11 8BU |
| Old Road West | DA11 0LS DA11 0LT DA11 0LU DA11 0LY |
| Orchard Road | DA11 8HU |
| Paris Drive | DA11 8GU |
| Park Avenue | DA11 8DG DA11 8DL DA11 8DN DA11 8DQ DA11 8DS DA11 8DW |
| Parkside Walk | DA11 8GJ |
| Pelham Road South | DA11 8QN DA11 8QP DA11 8QR DA11 8QS DA11 8QW |
| Penney Grove | DA11 8FY |
| Pepperhill Lane | DA11 8HX |
| Perry Street | DA11 8QU DA11 8RE DA11 8RF |
| Pitcher Court | DA11 8GD |
| Postgate Way | DA11 8GL |
| Preston Road | DA11 8DE DA11 8DF |
| Quarry Close | DA11 0GA |
| Rosebank Gardens | DA11 8RZ |
| Rosebery Court | DA11 7AT |
| Salisbury Road | DA11 7DF |
| Sassoon Mews | DA11 8FZ |
| Somerset Court | DA11 8GF |
| Springhead Enterprise Park | DA11 8HB DA11 8HD DA11 8HH DA11 8HJ DA11 8HL DA11 8HN |
| Springhead Parkway | DA11 8AD DA11 8BF DA11 8BY DA11 8JJ |
| Springhead Road | DA11 8HS DA11 8HT DA11 8HW DA11 8JG |
| Springvale Court | DA11 8JA |
| Stanbrook Road | DA11 0JN DA11 0JW |
| Thackeray Drive | DA11 8FS DA11 8FT |
| Thames Way | DA11 8BD |
| Third Avenue | DA11 8RX |
| Tourtel Yard | DA11 8FP |
| Tudor Close | DA11 8DT |
| Tyler Close | DA11 8FH |
| Vale Road | DA11 8BP DA11 8BS DA11 8BX DA11 8BZ DA11 8DA DA11 8DB DA11 8DD |
| Victoria Road | DA11 8RJ DA11 8RL DA11 8RS DA11 8RY |
| Waterdales | DA11 8HY DA11 8HZ DA11 8JE DA11 8JF DA11 8JN DA11 8JW |
| Wellesley Corner | DA11 8FL |
| Wells Court | DA11 8FG |
| Whitworth Close | DA11 8GN |
| Wingfield Bank | DA11 8JH |
| DA11 8GQ |
Property price trends in Northfleet South
According to the latest Land Registry data, the average home in Northfleet South sold for £294,841 in 2026. That figure comes from 4,012 sales logged over the past 31 years.
Prices have softened over the last three years. Compared with 2023, when the typical sale came in around £305,904, that's a fall of roughly 3.6%.
Looking back five years, average prices are down about 7.2% since 2021, a drop of around £22,925 in cash terms.
Zoom out to the past decade for the fuller picture. Back in 2016, homes here averaged £252,313, so the typical sold price has climbed about 16.9% since then, roughly 1.6% a year. Stretch the view to fifteen years and that annual pace edges up closer to 3.4%.
Frequently asked questions about Northfleet South
What is the average price for a property for sale in Northfleet South?
The average price for a property for sale in Northfleet South is £312,426. This amount is 15% lower than the average price in Gravesend. There are 2,353 property listings for sale in Northfleet South.
What streets have the most expensive properties for sale in Northfleet South?
The streets with the most expensive properties for sale in Northfleet South are Conrad Mews at an average of £590,000, Darwin Rise at an average of £467,500 and Lille Mews at an average of £435,000.
What streets have the most affordable properties for sale in Northfleet South?
The streets with the most affordable properties for sale in Northfleet South are Dover Road East at an average of £230,071, Orchard Road at an average of £238,333 and Somerset Court at an average of £238,666.
Which train stations are available in or near Northfleet South?
Some of the train stations available in or near Northfleet South are Ebbsfleet International, Northfleet and Gravesend.
Property Price Paid in Northfleet South by Year
The average sold property price by year was:
| Year | Average Sold Price | Price Change |
Sold Properties
|
|---|---|---|---|
| 2026 | £294,841 | -8% |
6 Properties |
| 2025 | £318,986 | 2% |
89 Properties |
| 2024 | £312,915 | 2% |
102 Properties |
| 2023 | £305,904 | -13% |
81 Properties |
| 2022 | £344,385 | 8% |
136 Properties |
| 2021 | £317,766 | 8% |
176 Properties |
| 2020 | £290,905 | -1% |
92 Properties |
| 2019 | £295,130 | -4% |
169 Properties |
| 2018 | £306,480 | 6% |
233 Properties |
| 2017 | £288,988 | 13% |
174 Properties |
Property Price per Property Type in Northfleet South
Here you can find historic sold price data in order to help with your property search.
The average Property Paid Price for specific property types in the last three years are:
| Property Type | Average Sold Price | Sold Properties |
|---|---|---|
| Semi Detached House | £353,477.00 | 83 Semi Detached Houses |
| Detached House | £393,902.00 | 7 Detached Houses |
| Terraced House | £322,102.00 | 136 Terraced Houses |
| Flat | £210,627.00 | 52 Flats |
