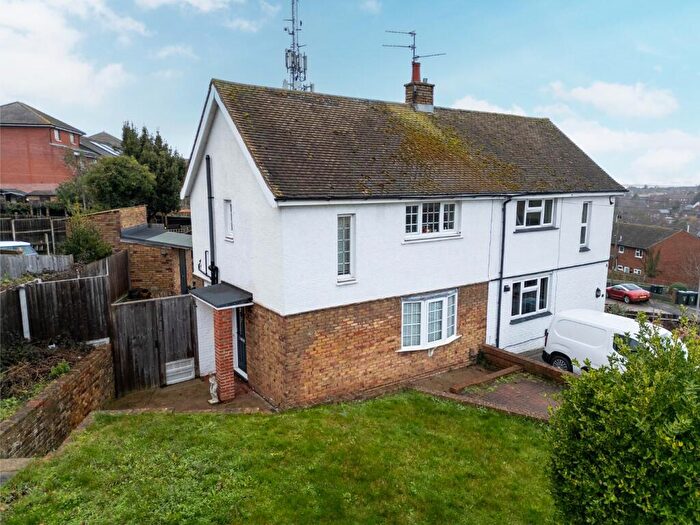
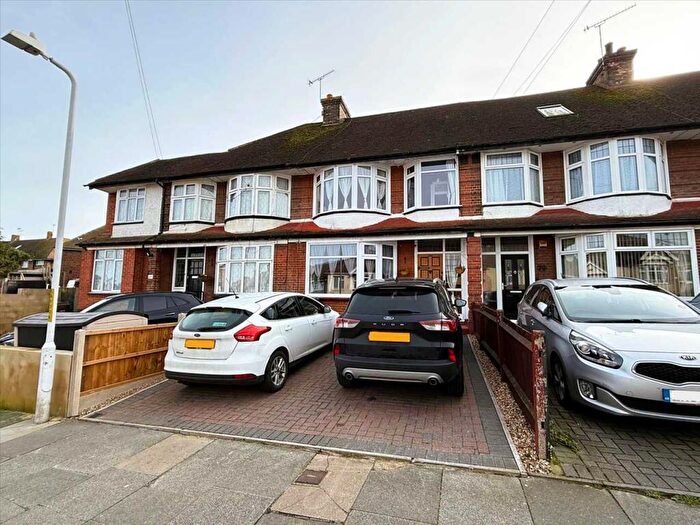
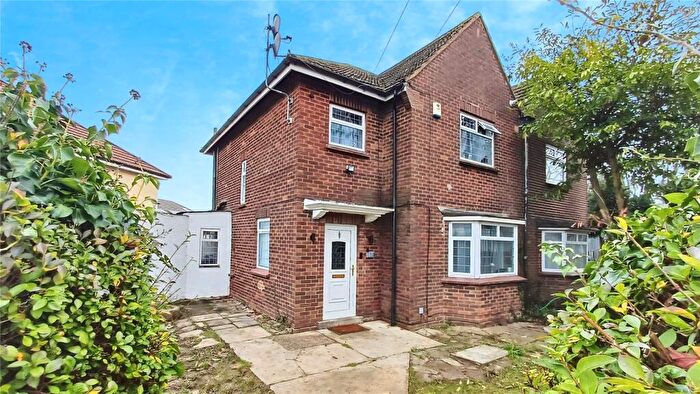
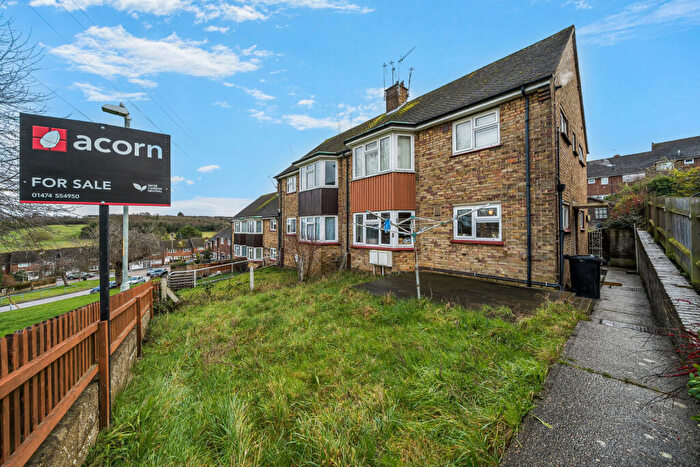
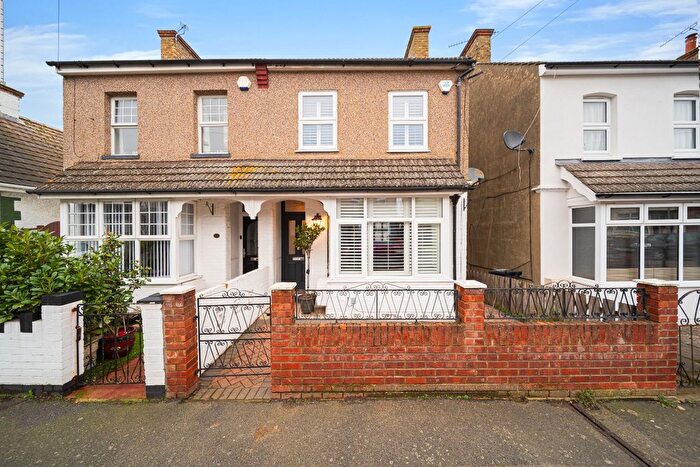
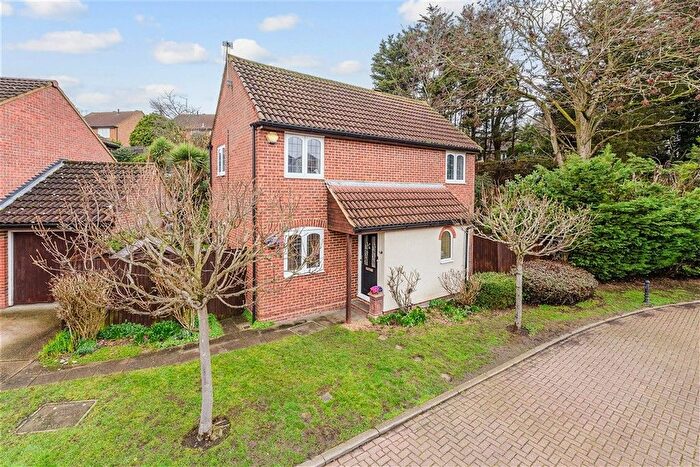
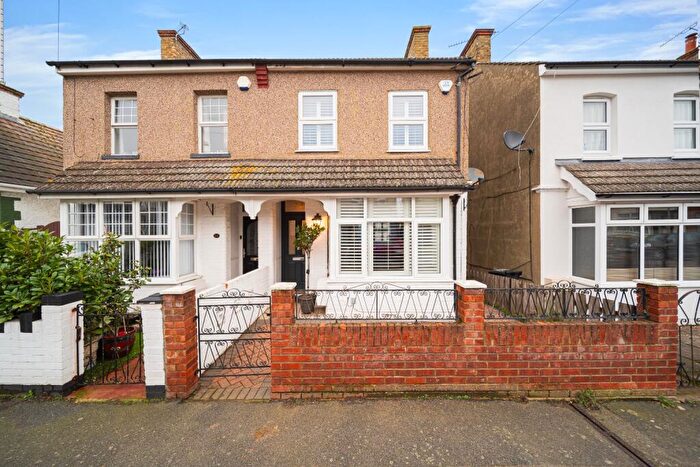
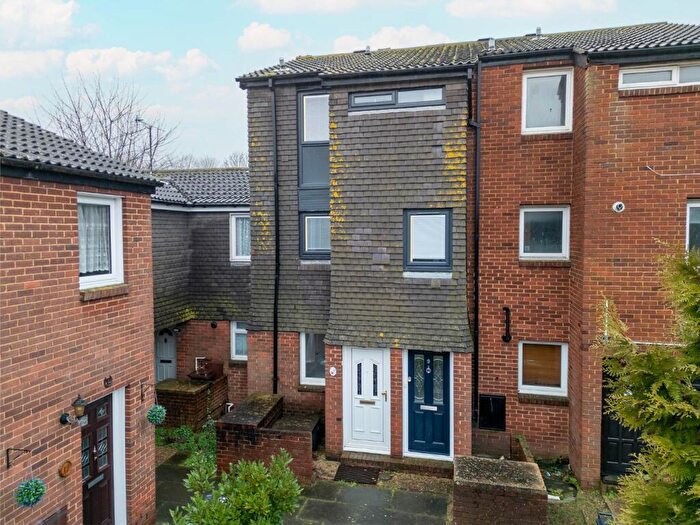
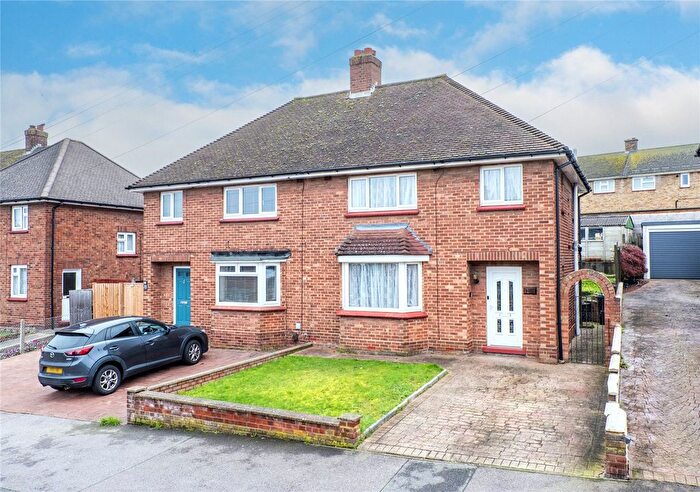
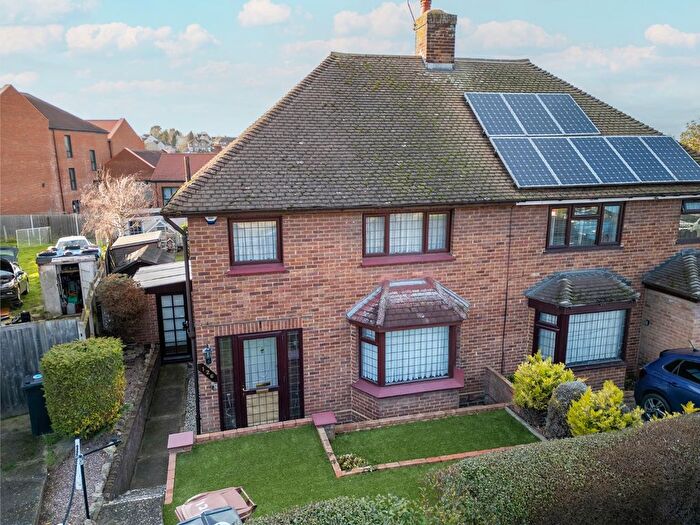
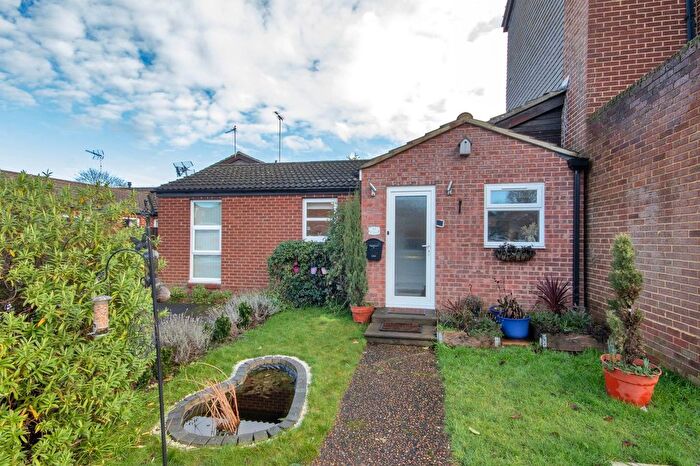
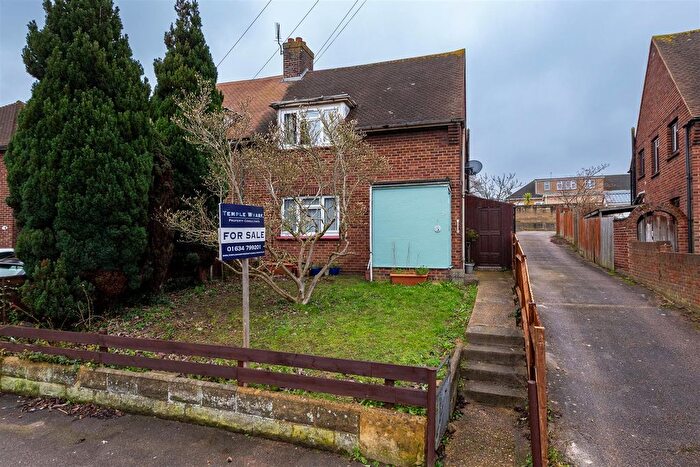
Houses for sale & to rent in Singlewell, Gravesend
House Prices in Singlewell
Properties in Singlewell have an average house price of £320,160.00 and had 244 Property Transactions within the last 3 years¹.
Singlewell is an area in Gravesend, Kent with 2,883 households², where the most expensive property was sold for £1,160,000.00.
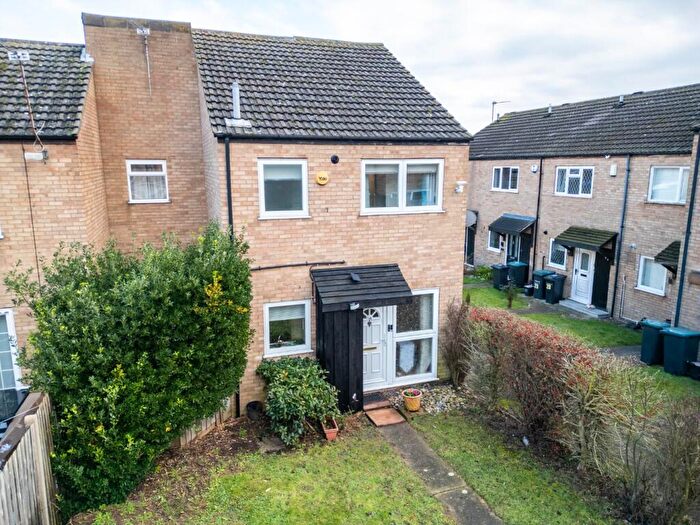
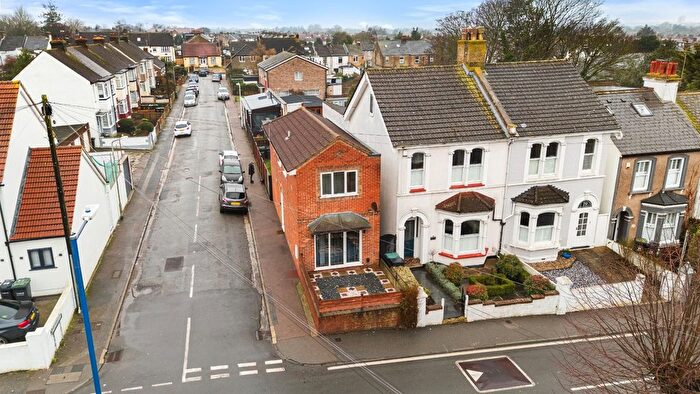
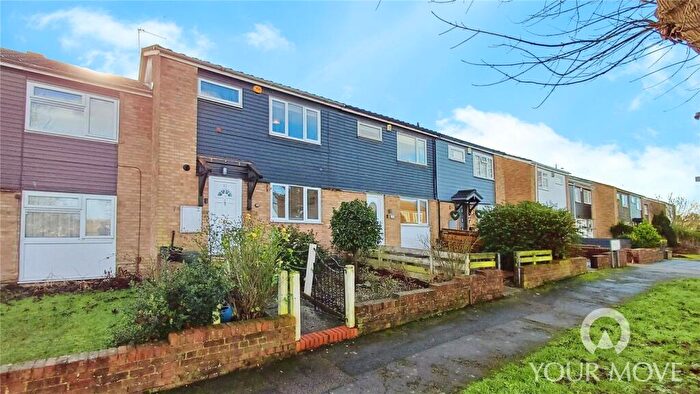
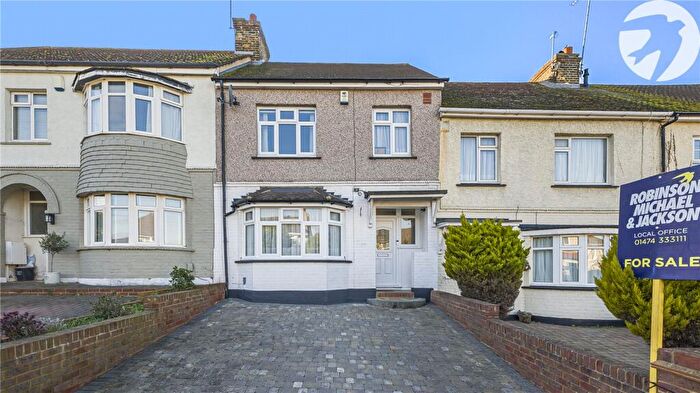
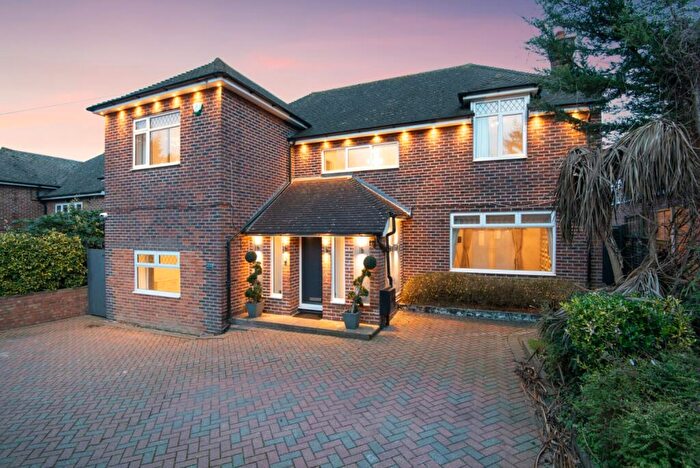
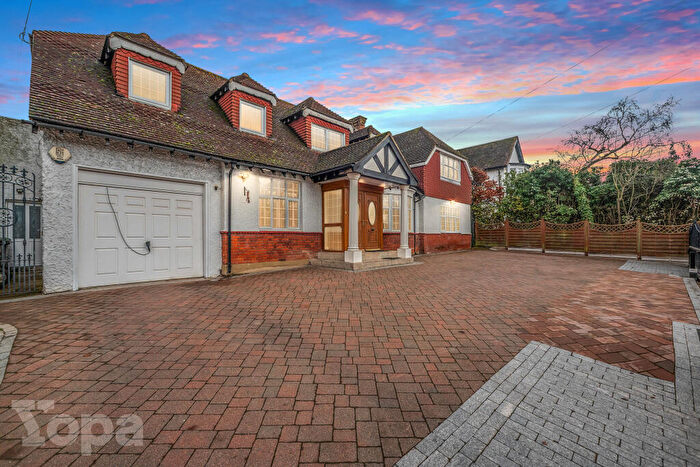
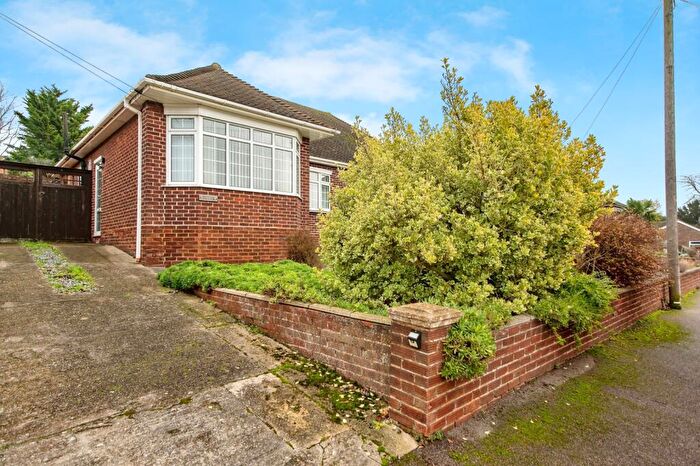
Properties for sale in Singlewell
Roads and Postcodes in Singlewell
Navigate through our locations to find the location of your next house in Singlewell, Gravesend for sale or to rent.
| Streets | Postcodes |
|---|---|
| Abbots Field | DA12 5JA |
| Apsledene | DA12 5ED DA12 5EE DA12 5EF |
| Ash Road | DA12 5LN DA12 5LW |
| Baffin Road | DA12 5BS |
| Beckett Mews | DA12 5NT |
| Bramble Mews | DA12 5NS |
| Burton Road | DA12 5BT |
| Cedar Avenue | DA12 5JS DA12 5JT |
| Central Avenue | DA12 5BH |
| Chichester Rise | DA12 5DR |
| Christianfields Avenue | DA12 5NE DA12 5NF DA12 5NJ DA12 5NN DA12 5NW |
| Cobsdene | DA12 5JB |
| Codrington Crescent | DA12 5DD |
| Codrington Gardens | DA12 5DB |
| Dobson Road | DA12 5TE DA12 5TF |
| Drake Mews | DA12 5AU |
| Dunkirk Close | DA12 5ND |
| Ferguson Avenue | DA12 5LX |
| Franklin Road | DA12 5SX DA12 5TB |
| Gloucester Road | DA12 5JY DA12 5JZ |
| Hawkins Avenue | DA12 5BY DA12 5DU DA12 5NB DA12 5NH |
| Hever Court Road | DA12 5UQ |
| Hevercourt Cottages | DA12 5UG |
| Hudson Close | DA12 5FB |
| Ifield Way | DA12 5TX DA12 5UA DA12 5UJ DA12 5BP |
| Jellicoe Avenue | DA12 5HU |
| Kilndown | DA12 5JG |
| Kings Drive | DA12 5BG |
| Kitchener Avenue | DA12 5HZ DA12 5JE DA12 5JF |
| Lander Close | DA12 5BA |
| Livingstone Gardens | DA12 5DL |
| Livingstone Road | DA12 5DN DA12 5DP DA12 5DW DA12 5DY DA12 5DZ |
| Mackenzie Way | DA12 5TY DA12 5TZ DA12 5UB DA12 5UH |
| Mallory Close | DA12 5FD |
| Maple Road | DA12 5JR |
| Montgomery Close | DA12 5NR |
| Mungo Park Road | DA12 5DE DA12 5DF |
| Nansen Road | DA12 5DA |
| Palmer Avenue | DA12 5NG DA12 5NQ |
| Park Terrace | DA12 5FF |
| Poplar Avenue | DA12 5JU DA12 5JX |
| Princes Road | DA12 5JH DA12 5JJ DA12 5JL |
| Queens Road | DA12 5JP |
| Raleigh Close | DA12 5BU |
| Read Way | DA12 5TG DA12 5TQ |
| Rosewood Mews | DA12 5AR |
| Ruffets Wood | DA12 5JQ |
| Scott Road | DA12 5TS DA12 5TT DA12 5TU |
| Shackleton Terrace | DA12 5FE |
| Sheldon Heights | DA12 5FA |
| St Davids Crescent | DA12 4AS |
| St Francis Avenue | DA12 4SH |
| St Georges Crescent | DA12 4AR |
| St Hildas Way | DA12 4AP |
| Stacey Close | DA12 5TD |
| Stanley Crescent | DA12 5SY DA12 5SZ |
| The Drive | DA12 4BY DA12 4BZ |
| The Glades | DA12 5ES |
| The Hollies | DA12 5EP DA12 5ER |
| The Rise | DA12 4BX |
| The Warren | DA12 4DA |
| Thistledown | DA12 5ET DA12 5EU DA12 5EX |
| Valley Drive | DA12 5SQ DA12 5TA DA12 5TH DA12 5UE DA12 5UF DA12 5DS DA12 5SU DA12 5FL DA12 5FN |
| Virginia Walk | DA12 5UL |
| Warrior Avenue | DA12 5NA |
| Watling Street | DA12 5UD |
| Whitehill Lane | DA12 5LZ |
| Wilberforce Way | DA12 5DG DA12 5DH DA12 5DJ DA12 5DQ |
| Winters Croft | DA12 5EA DA12 5EB |
| York Road | DA12 5JN DA12 5JW DA12 5LA |
Transport near Singlewell
- FAQ
- Price Paid By Year
- Property Type Price
Frequently asked questions about Singlewell
What is the average price for a property for sale in Singlewell?
The average price for a property for sale in Singlewell is £320,160. This amount is 13% lower than the average price in Gravesend. There are 1,192 property listings for sale in Singlewell.
What streets have the most expensive properties for sale in Singlewell?
The streets with the most expensive properties for sale in Singlewell are Whitehill Lane at an average of £505,000, Read Way at an average of £453,833 and The Warren at an average of £450,000.
What streets have the most affordable properties for sale in Singlewell?
The streets with the most affordable properties for sale in Singlewell are Mallory Close at an average of £228,875, The Hollies at an average of £234,375 and Hawkins Avenue at an average of £238,166.
Which train stations are available in or near Singlewell?
Some of the train stations available in or near Singlewell are Gravesend, Sole Street and Meopham.
Property Price Paid in Singlewell by Year
The average sold property price by year was:
| Year | Average Sold Price | Price Change |
Sold Properties
|
|---|---|---|---|
| 2025 | £320,952 | 6% |
79 Properties |
| 2024 | £303,010 | -13% |
94 Properties |
| 2023 | £341,986 | 5% |
71 Properties |
| 2022 | £325,398 | 7% |
102 Properties |
| 2021 | £301,529 | 13% |
96 Properties |
| 2020 | £262,451 | -2% |
76 Properties |
| 2019 | £268,372 | -8% |
99 Properties |
| 2018 | £290,202 | 9% |
100 Properties |
| 2017 | £263,011 | 6% |
105 Properties |
| 2016 | £246,644 | 10% |
100 Properties |
| 2015 | £220,808 | 7% |
116 Properties |
| 2014 | £204,892 | 15% |
106 Properties |
| 2013 | £174,923 | 2% |
111 Properties |
| 2012 | £170,600 | 3% |
133 Properties |
| 2011 | £165,714 | -2% |
107 Properties |
| 2010 | £168,776 | 4% |
66 Properties |
| 2009 | £161,538 | -6% |
57 Properties |
| 2008 | £171,413 | 1% |
84 Properties |
| 2007 | £170,328 | 6% |
129 Properties |
| 2006 | £160,093 | 8% |
145 Properties |
| 2005 | £147,463 | 2% |
111 Properties |
| 2004 | £144,822 | 7% |
140 Properties |
| 2003 | £134,735 | 14% |
106 Properties |
| 2002 | £116,153 | 20% |
132 Properties |
| 2001 | £93,204 | 12% |
131 Properties |
| 2000 | £81,679 | 15% |
102 Properties |
| 1999 | £69,794 | 8% |
122 Properties |
| 1998 | £64,214 | 7% |
100 Properties |
| 1997 | £59,720 | 9% |
117 Properties |
| 1996 | £54,051 | -2% |
81 Properties |
| 1995 | £54,917 | - |
80 Properties |
Property Price per Property Type in Singlewell
Here you can find historic sold price data in order to help with your property search.
The average Property Paid Price for specific property types in the last three years are:
| Property Type | Average Sold Price | Sold Properties |
|---|---|---|
| Semi Detached House | £358,731.00 | 69 Semi Detached Houses |
| Detached House | £494,444.00 | 9 Detached Houses |
| Terraced House | £305,586.00 | 147 Terraced Houses |
| Flat | £210,289.00 | 19 Flats |

