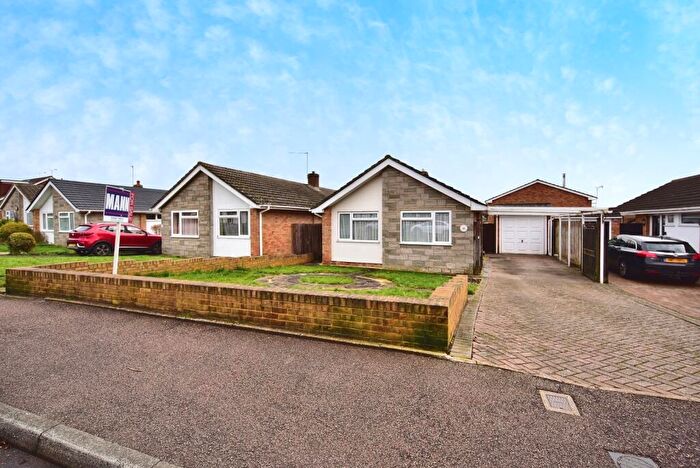
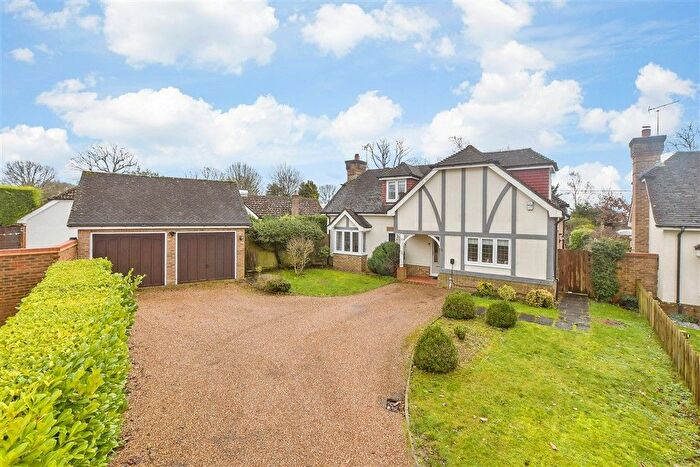
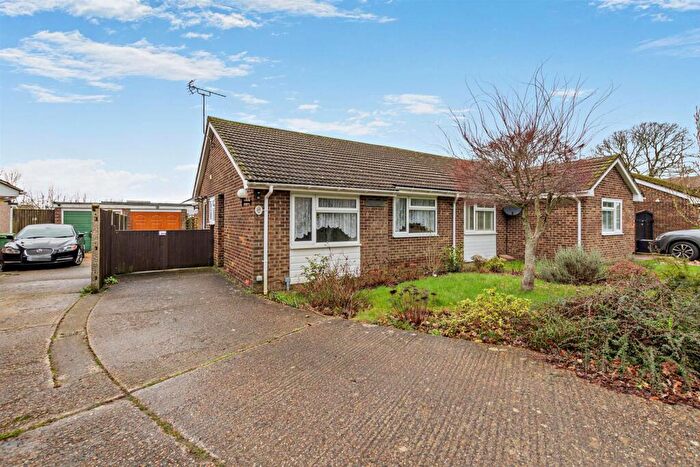
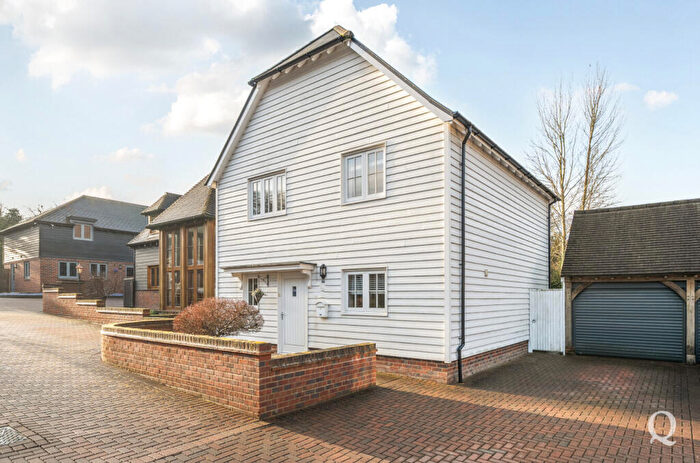
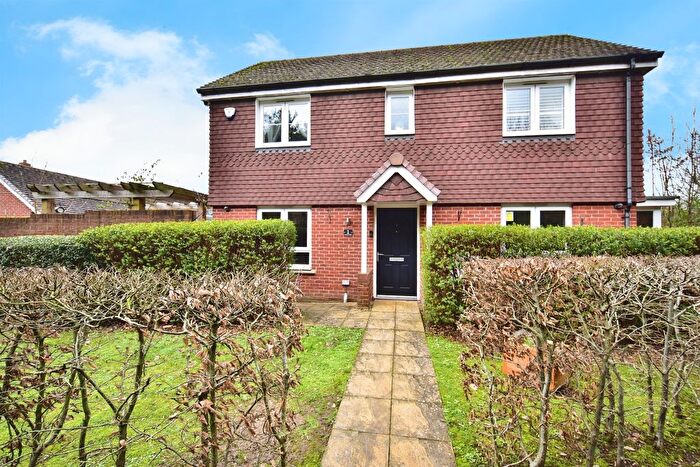
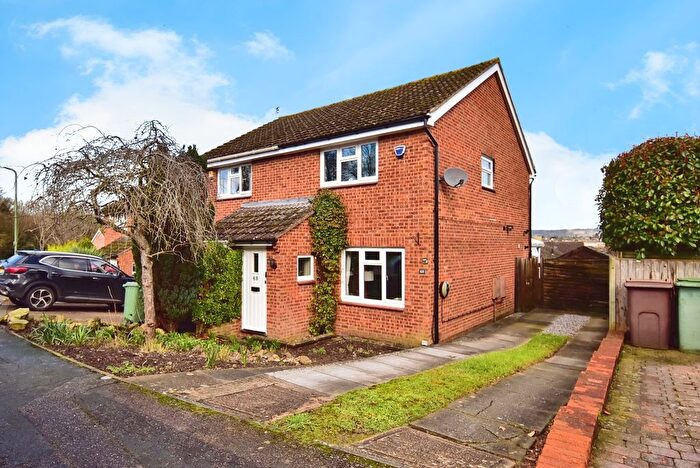
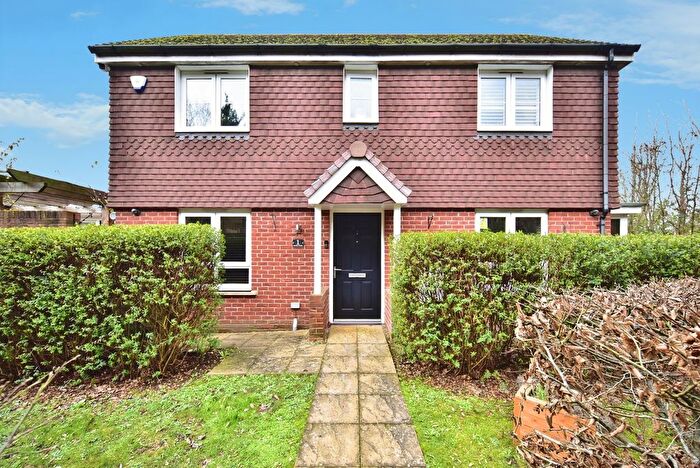
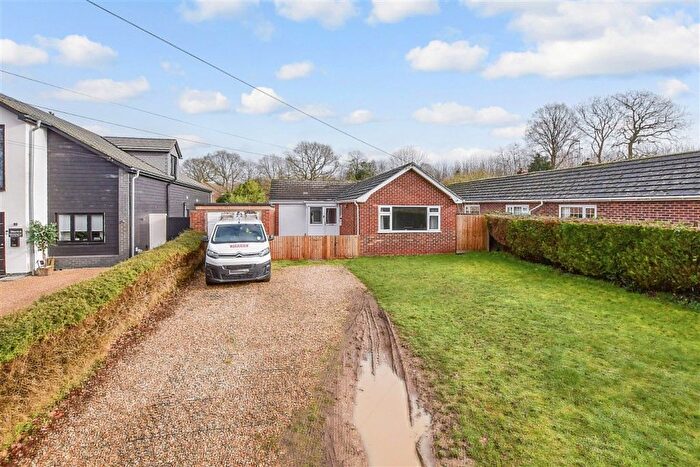
Houses for sale & to rent in North Downs, Maidstone
House Prices in North Downs
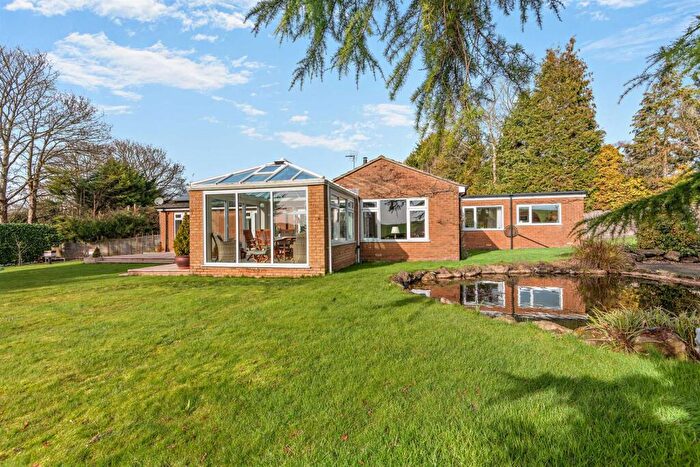
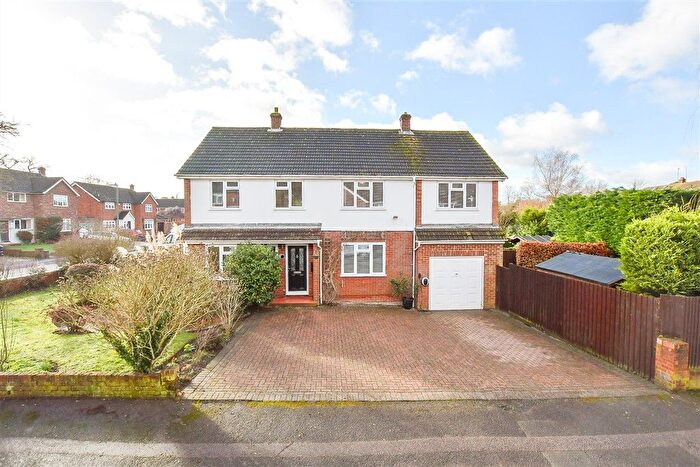
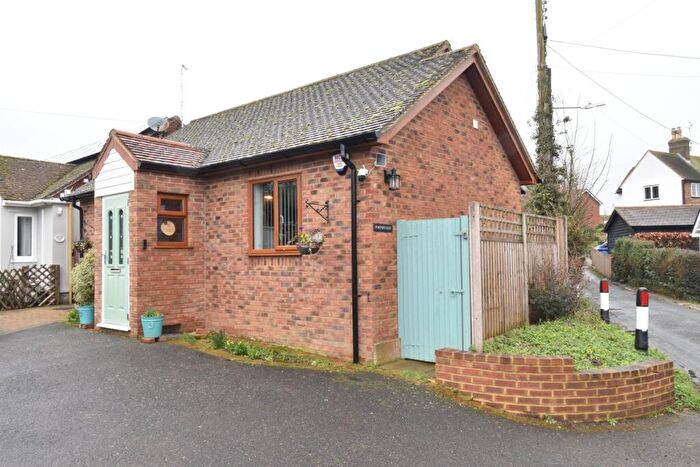
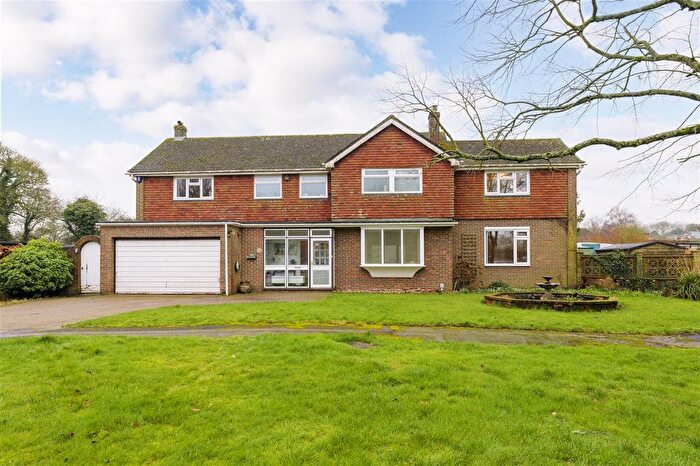
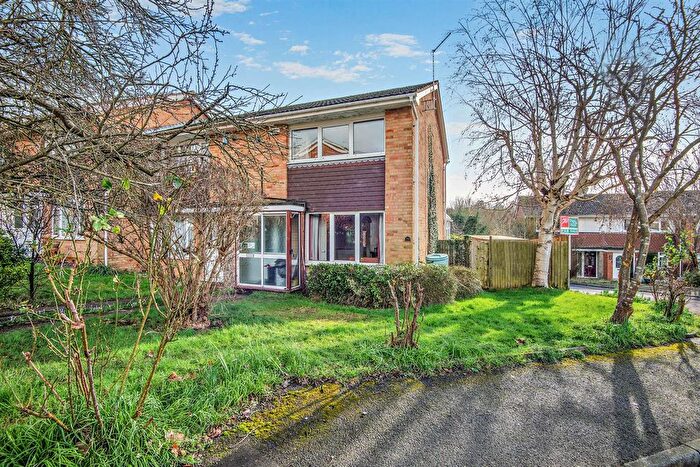
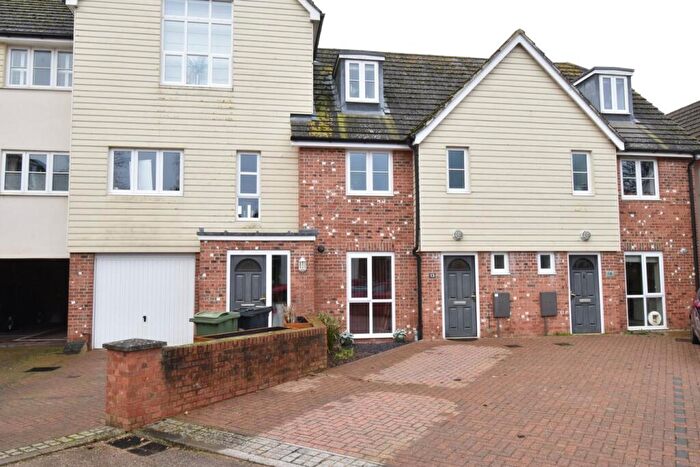
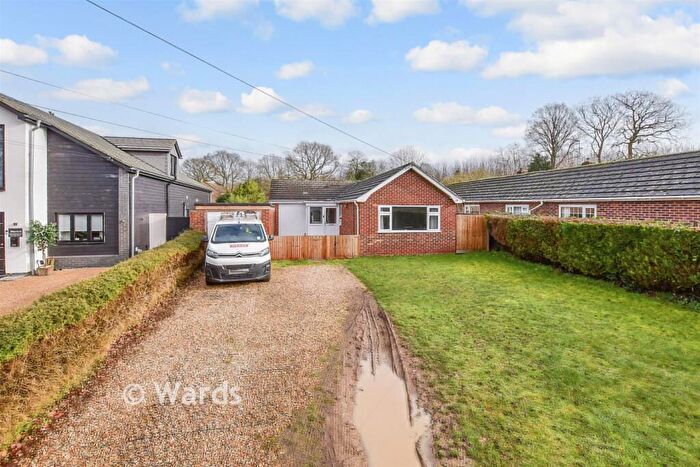
Properties in North Downs have an average house price of £683,378.00 and had 32 Property Transactions within the last 3 years¹.
North Downs is an area in Maidstone, Kent with 489 households², where the most expensive property was sold for £1,750,000.00.
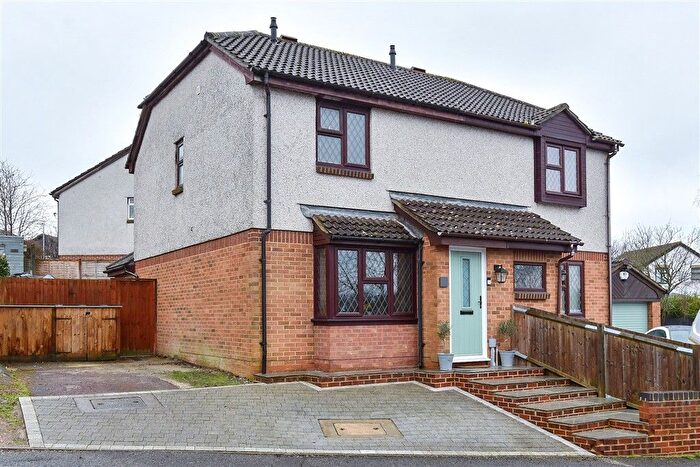
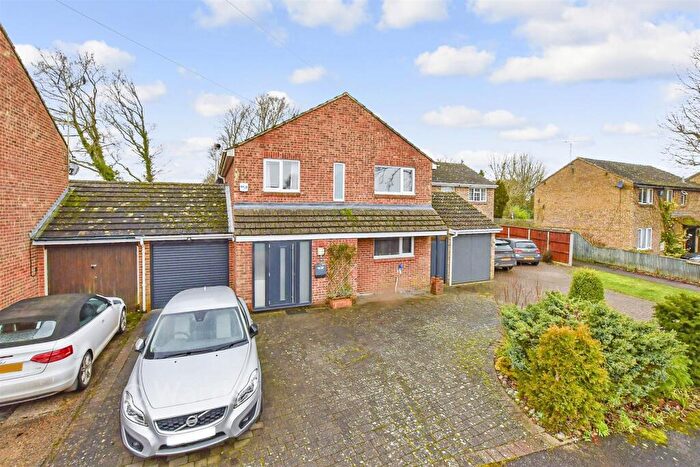
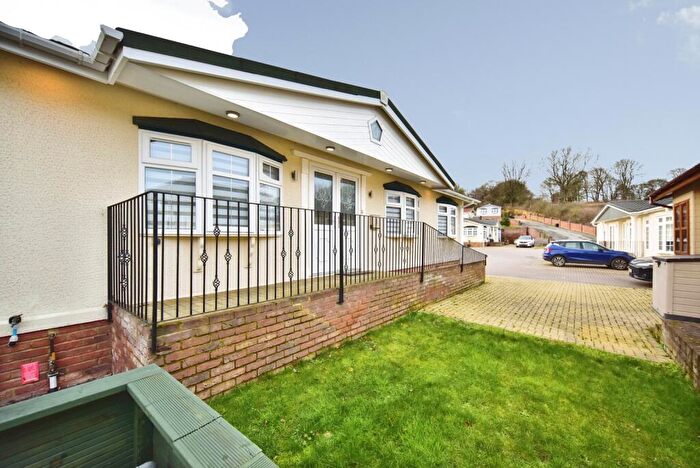
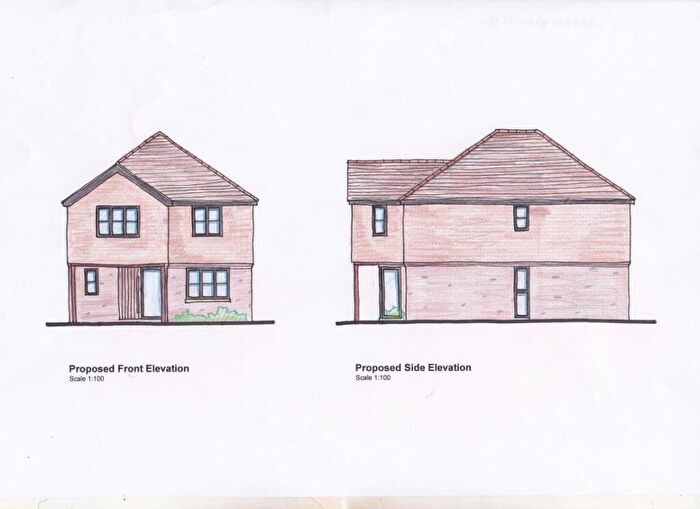
Properties for sale in North Downs
Roads and Postcodes in North Downs
Navigate through our locations to find the location of your next house in North Downs, Maidstone for sale or to rent.
| Streets | Postcodes |
|---|---|
| Ashdown Lane | ME17 2ER |
| Ashford Road | ME17 1PA ME17 1PF ME17 1PG ME17 1XH ME17 1XE ME17 1XG ME17 1XL ME17 1WR |
| Athelstan Green | ME17 1UX |
| Bank Cottages | ME17 1UP |
| Bimbury Lane | ME14 3HX ME14 3HY |
| Bourneside Terrace | ME17 1TN |
| Bredgar Road | ME17 1QN |
| Brickfields Close | ME17 1SF |
| Broad Street Hill | ME17 1QX ME17 1QY |
| Church Green | ME17 1HW |
| Church Road | ME17 1QT |
| Claygate | ME17 1XA |
| Cold Harbour Lane | ME14 3LS |
| Cold Harbour Road | ME17 2EA |
| Colyers Wents Cottages | ME17 1QP |
| Culpeper Close | ME17 1UD ME17 1UE |
| Eyhorne Street | ME17 1TP ME17 1TR ME17 1TS ME17 1TT ME17 1TX ME17 1UA ME17 1UG |
| Godfrey Meadow | ME17 1FZ |
| Greenway Court Road | ME17 1QB ME17 1QD ME17 1QE ME17 1QQ |
| Hadley Gardens | ME17 1UF |
| Hasteds | ME17 1UQ |
| Hogbarn Lane | ME17 1NZ |
| Hollingbourne Hill | ME17 1QJ ME17 1QH |
| Hook Lane | ME17 1QZ |
| Hospital Road | ME17 1QG |
| Junction 8 | ME17 1SS |
| Manor Lane | ME17 1UN |
| Musket Lane | ME17 1UU ME17 1UY |
| Payden Street | ME17 2EH |
| Pilgrims Way | ME17 1RB ME17 1RD ME17 1UR ME17 1UT |
| Pond Farm Road | ME17 1QS |
| Ringlestone Road | ME17 1NX |
| Scragged Oak Road | ME17 1QU |
| Stede Hill | ME17 1NU |
| The Pavings | ME17 1TU |
| Tilefields | ME17 1TZ |
| Tilefields Close | ME17 1TW |
| Troys Mead | ME17 1UB |
| Upper Street | ME17 1UH ME17 1UJ ME17 1UL ME17 1UW |
| Warren Street | ME17 2EE ME17 2EG |
| Woodside Green | ME17 2ES |
| ME14 3LX ME17 1QL ME17 1UZ ME17 1QR |
Transport near North Downs
- FAQ
- Price Paid By Year
- Property Type Price
Frequently asked questions about North Downs
What is the average price for a property for sale in North Downs?
The average price for a property for sale in North Downs is £683,378. This amount is 85% higher than the average price in Maidstone. There are 3,444 property listings for sale in North Downs.
What streets have the most expensive properties for sale in North Downs?
The streets with the most expensive properties for sale in North Downs are Scragged Oak Road at an average of £1,325,000, Hogbarn Lane at an average of £1,150,000 and Pilgrims Way at an average of £910,000.
What streets have the most affordable properties for sale in North Downs?
The streets with the most affordable properties for sale in North Downs are Bank Cottages at an average of £264,250, Bimbury Lane at an average of £280,000 and Greenway Court Road at an average of £300,000.
Which train stations are available in or near North Downs?
Some of the train stations available in or near North Downs are Hollingbourne, Harrietsham and Bearsted.
Property Price Paid in North Downs by Year
The average sold property price by year was:
| Year | Average Sold Price | Price Change |
Sold Properties
|
|---|---|---|---|
| 2025 | £532,375 | -32% |
12 Properties |
| 2024 | £700,954 | -23% |
11 Properties |
| 2023 | £863,236 | -2% |
9 Properties |
| 2022 | £879,472 | 32% |
12 Properties |
| 2021 | £602,400 | 13% |
30 Properties |
| 2020 | £522,663 | -3% |
23 Properties |
| 2019 | £536,145 | -0,4% |
12 Properties |
| 2018 | £538,307 | -12% |
13 Properties |
| 2017 | £603,894 | 14% |
19 Properties |
| 2016 | £516,471 | 10% |
26 Properties |
| 2015 | £465,546 | -6% |
16 Properties |
| 2014 | £494,278 | 15% |
14 Properties |
| 2013 | £419,175 | 10% |
18 Properties |
| 2012 | £377,866 | -1% |
6 Properties |
| 2011 | £381,615 | -52% |
13 Properties |
| 2010 | £579,277 | 60% |
9 Properties |
| 2009 | £232,000 | -23% |
5 Properties |
| 2008 | £284,641 | -22% |
6 Properties |
| 2007 | £348,611 | -19% |
18 Properties |
| 2006 | £413,931 | -1% |
22 Properties |
| 2005 | £419,066 | 15% |
15 Properties |
| 2004 | £356,393 | 1% |
16 Properties |
| 2003 | £351,608 | 1% |
18 Properties |
| 2002 | £346,943 | 26% |
18 Properties |
| 2001 | £255,099 | 4% |
20 Properties |
| 2000 | £244,683 | 40% |
21 Properties |
| 1999 | £147,673 | -28% |
13 Properties |
| 1998 | £188,285 | 20% |
14 Properties |
| 1997 | £149,968 | 12% |
19 Properties |
| 1996 | £131,238 | -4% |
16 Properties |
| 1995 | £136,807 | - |
13 Properties |
Property Price per Property Type in North Downs
Here you can find historic sold price data in order to help with your property search.
The average Property Paid Price for specific property types in the last three years are:
| Property Type | Average Sold Price | Sold Properties |
|---|---|---|
| Semi Detached House | £479,100.00 | 5 Semi Detached Houses |
| Detached House | £932,777.00 | 18 Detached Houses |
| Terraced House | £298,069.00 | 9 Terraced Houses |

