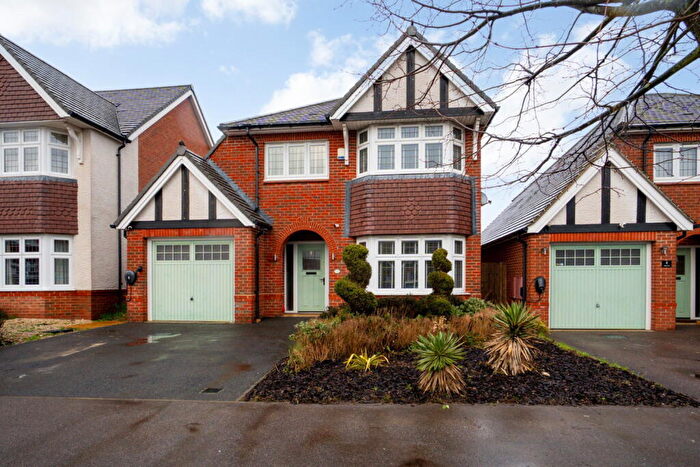
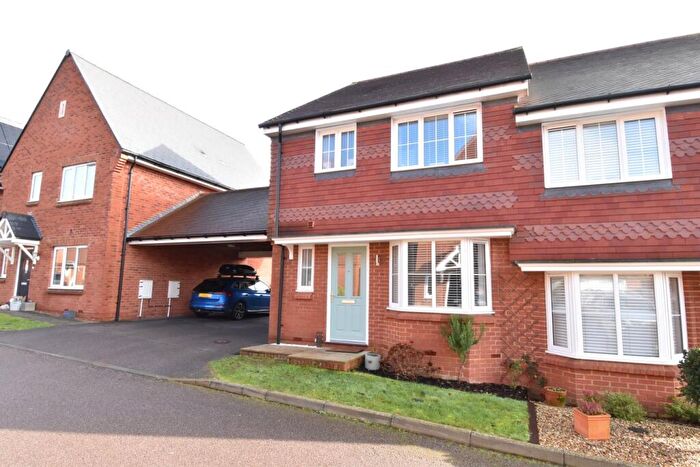
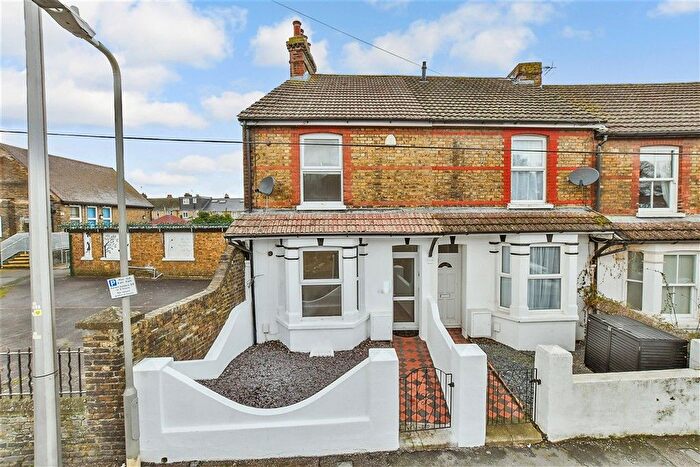
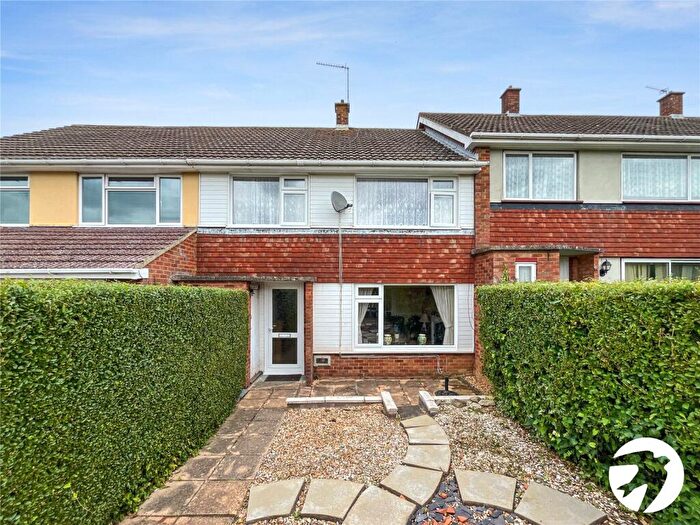
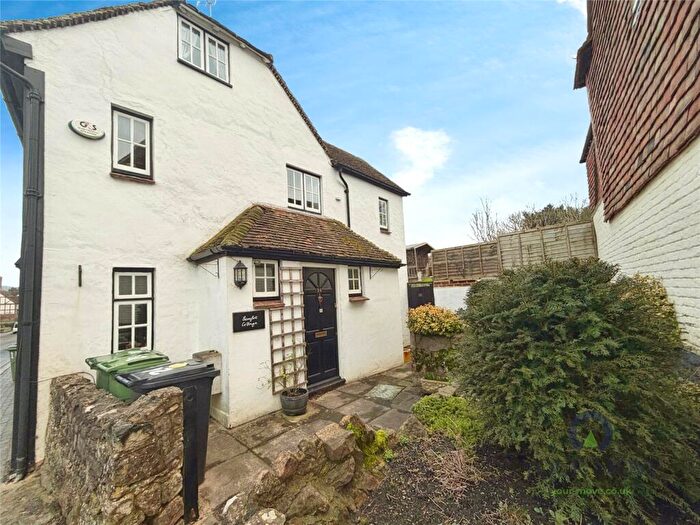
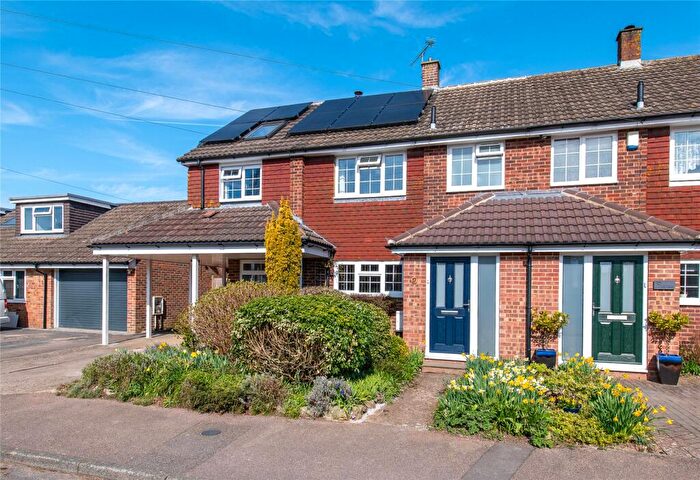
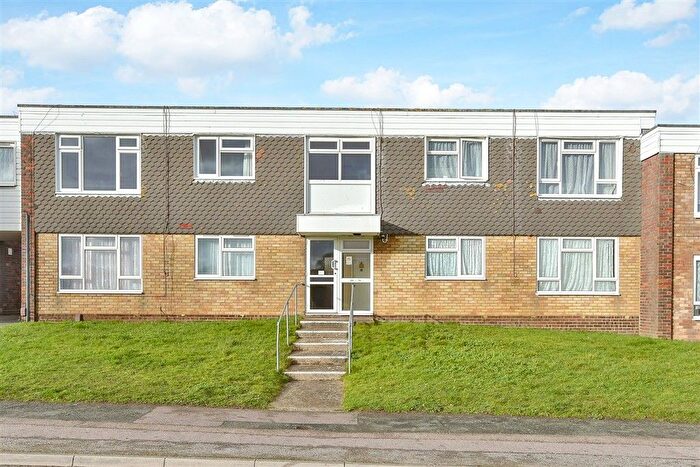
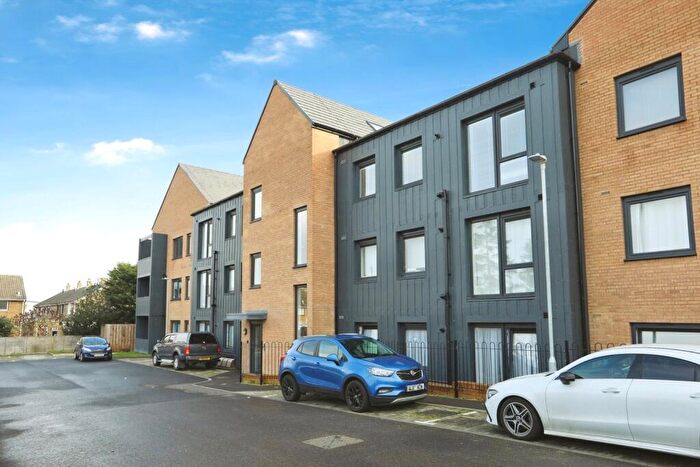
Houses for sale & to rent in North Downs, Sittingbourne
House Prices in North Downs
Properties in North Downs have an average house price of £708,025.00 and had 20 Property Transactions within the last 3 years¹.
North Downs is an area in Sittingbourne, Kent with 463 households², where the most expensive property was sold for £3,940,000.00.
Properties for sale in North Downs
Roads and Postcodes in North Downs
Navigate through our locations to find the location of your next house in North Downs, Sittingbourne for sale or to rent.
| Streets | Postcodes |
|---|---|
| Bedmonton | ME9 0EH |
| Bicknor Lane | ME9 8AX ME9 8AY ME9 8BA ME9 8AU |
| Bicknor Road | ME9 8XJ |
| Bimbury Lane | ME9 7QT ME9 7QX |
| Bottom Pond Road | ME9 0TN ME9 0TP ME9 0TR |
| Bull Lane | ME9 7UB |
| Buxton Meadow | ME9 7FF |
| Cedar Gardens | ME9 7UG |
| Chalky Road | ME9 7QP ME9 7QR |
| Church Cottages | ME9 0TQ |
| Church Lane | ME9 7RD |
| Coalpit Lane | ME9 0SS |
| Cowstead Road | ME9 7UA |
| Draysfield | ME9 0TY |
| Faversham Road | ME9 0DE |
| Gossy Hill Road | ME9 0TH |
| Harrow Court | ME9 7UQ |
| Hazel Street | ME9 7SB ME9 7SA |
| Hill Green Road | ME9 7UN ME9 7UP |
| Mattinson Place | ME9 0TX |
| New Purchase Cottages | ME9 0TB |
| Northdown | ME9 7UL |
| Old Forge Lane | ME9 7RX |
| Old Lenham Road | ME9 0DS ME9 0DT |
| Park Farm Lane | ME9 0UA |
| Parsonage Farm Cottages | ME9 7UJ |
| Pett Lane | ME9 7RL |
| Pett Road | ME9 7RJ ME9 7QE ME9 7RP |
| Plum Tree Lane | ME9 7RA ME9 7UR |
| Rumstead Lane | ME9 7QL ME9 7RS ME9 7RT ME9 7RU |
| Seed Road | ME9 0NN |
| Slade Road | ME9 0NP |
| South Green | ME9 7RR ME9 7RY |
| South Lees Lane | ME9 7RZ |
| South Street Road | ME9 7QS ME9 7RB |
| Stockbury Valley | ME9 7QD ME9 7QH ME9 7QJ ME9 7QN |
| The Street | ME9 0TF ME9 0TT ME9 0TU ME9 0UB ME9 7UD ME9 7UE ME9 7UH |
| Torry Hill | ME9 0SP |
| Twin Hills Lane | ME9 0BF |
| West Wood Road | ME9 7SQ |
| Wormshill | ME9 0TS |
| Yelsted Lane | ME9 7GE |
| Yelsted Road | ME9 7UU ME9 7XG ME9 7QY |
| ME9 0DH ME9 0DJ ME9 0EA ME9 0SL ME9 0SY ME9 7RN ME9 7UT ME9 8BJ ME9 0DP ME9 0SN ME9 0SR ME9 0ST ME9 0SU ME9 0SX |
Transport near North Downs
-
Hollingbourne Station
-
Newington Station
-
Sittingbourne Station
-
Harrietsham Station
-
Bearsted Station
-
Lenham Station
- FAQ
- Price Paid By Year
- Property Type Price
Frequently asked questions about North Downs
What is the average price for a property for sale in North Downs?
The average price for a property for sale in North Downs is £708,025. This amount is 124% higher than the average price in Sittingbourne. There are 6,881 property listings for sale in North Downs.
What streets have the most expensive properties for sale in North Downs?
The streets with the most expensive properties for sale in North Downs are Hazel Street at an average of £2,482,500, Harrow Court at an average of £960,000 and Bottom Pond Road at an average of £720,000.
What streets have the most affordable properties for sale in North Downs?
The streets with the most affordable properties for sale in North Downs are Stockbury Valley at an average of £348,000, Northdown at an average of £356,000 and Mattinson Place at an average of £367,500.
Which train stations are available in or near North Downs?
Some of the train stations available in or near North Downs are Hollingbourne, Newington and Sittingbourne.
Property Price Paid in North Downs by Year
The average sold property price by year was:
| Year | Average Sold Price | Price Change |
Sold Properties
|
|---|---|---|---|
| 2025 | £373,625 | -124% |
4 Properties |
| 2024 | £838,111 | 13% |
9 Properties |
| 2023 | £731,857 | -7% |
7 Properties |
| 2022 | £783,583 | 26% |
12 Properties |
| 2021 | £577,030 | -25% |
16 Properties |
| 2020 | £721,666 | 34% |
9 Properties |
| 2019 | £478,115 | -47% |
13 Properties |
| 2018 | £701,500 | 21% |
10 Properties |
| 2017 | £555,000 | 7% |
6 Properties |
| 2016 | £517,000 | -18% |
5 Properties |
| 2015 | £609,700 | 22% |
10 Properties |
| 2014 | £473,392 | 18% |
14 Properties |
| 2013 | £388,850 | -48% |
10 Properties |
| 2012 | £574,951 | 36% |
8 Properties |
| 2011 | £365,750 | -7% |
4 Properties |
| 2010 | £389,916 | 10% |
12 Properties |
| 2009 | £351,562 | 27% |
8 Properties |
| 2008 | £256,737 | -64% |
8 Properties |
| 2007 | £421,425 | -9% |
20 Properties |
| 2006 | £457,633 | 7% |
15 Properties |
| 2005 | £425,968 | 15% |
16 Properties |
| 2004 | £361,068 | -4% |
18 Properties |
| 2003 | £375,956 | 24% |
13 Properties |
| 2002 | £286,903 | 20% |
16 Properties |
| 2001 | £230,026 | -25% |
19 Properties |
| 2000 | £286,666 | 41% |
3 Properties |
| 1999 | £170,062 | -14% |
8 Properties |
| 1998 | £193,958 | 32% |
12 Properties |
| 1997 | £132,218 | 15% |
8 Properties |
| 1996 | £111,891 | -16% |
12 Properties |
| 1995 | £129,527 | - |
18 Properties |
Property Price per Property Type in North Downs
Here you can find historic sold price data in order to help with your property search.
The average Property Paid Price for specific property types in the last three years are:
| Property Type | Average Sold Price | Sold Properties |
|---|---|---|
| Semi Detached House | £311,000.00 | 8 Semi Detached Houses |
| Detached House | £1,041,318.00 | 11 Detached Houses |
| Flat | £218,000.00 | 1 Flat |

