
Houses for sale in Ramsgate, Kent
House Prices in Ramsgate
Properties in Ramsgate have an average house price of £277k and had 2,074 Property Transactions within the last 3 years.¹
Ramsgate is an area in Kent with 21,660 households², where the most expensive property was sold for £1.9M.
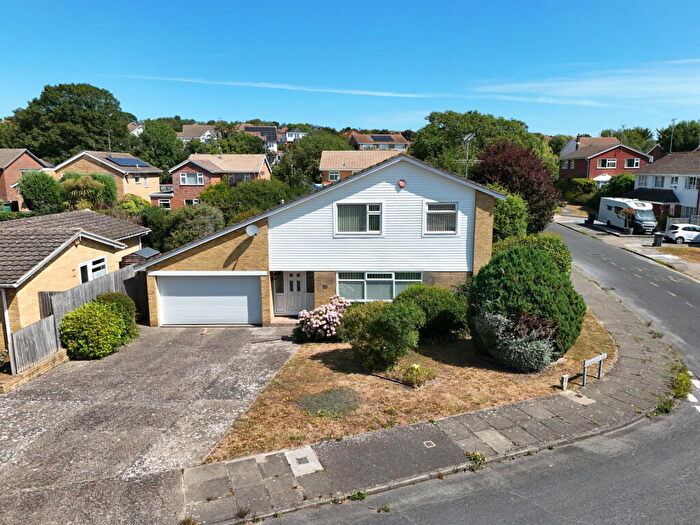
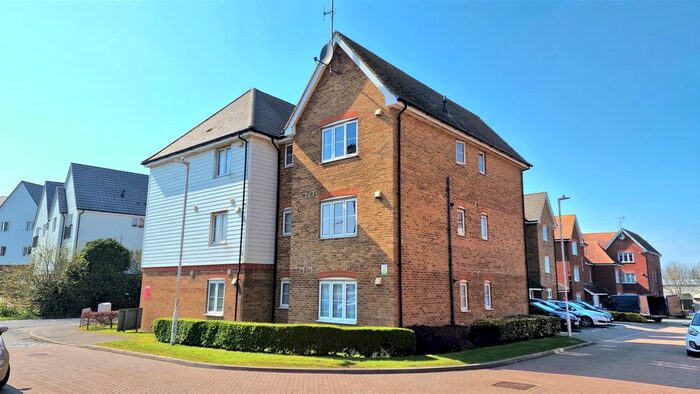
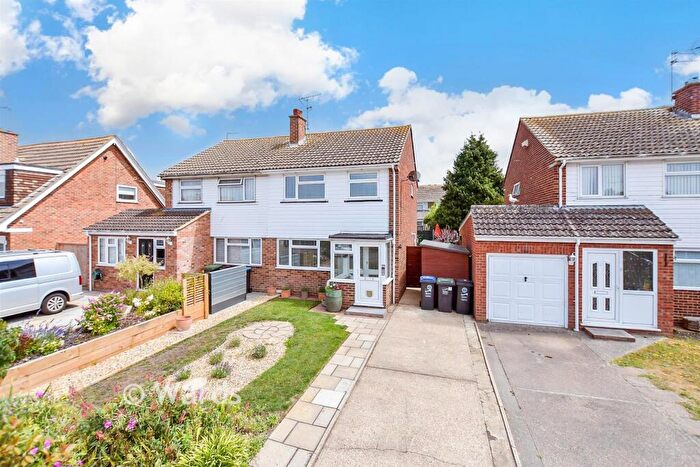
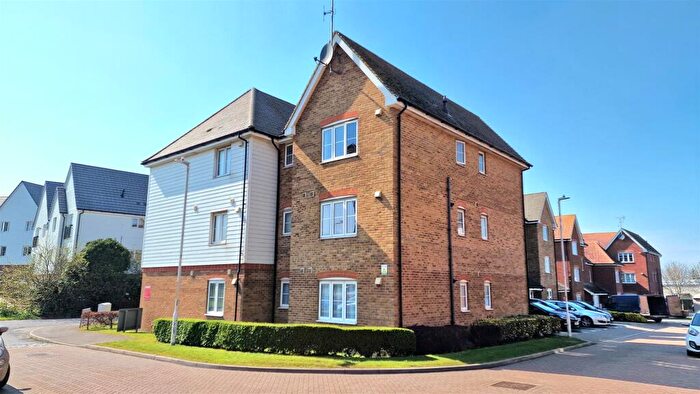
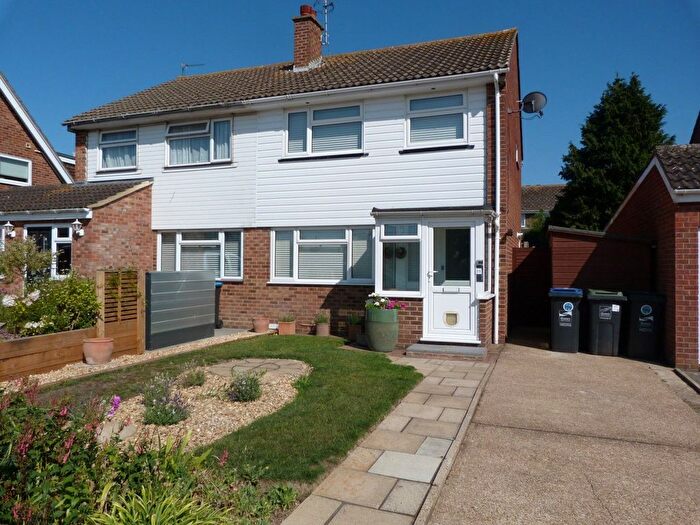
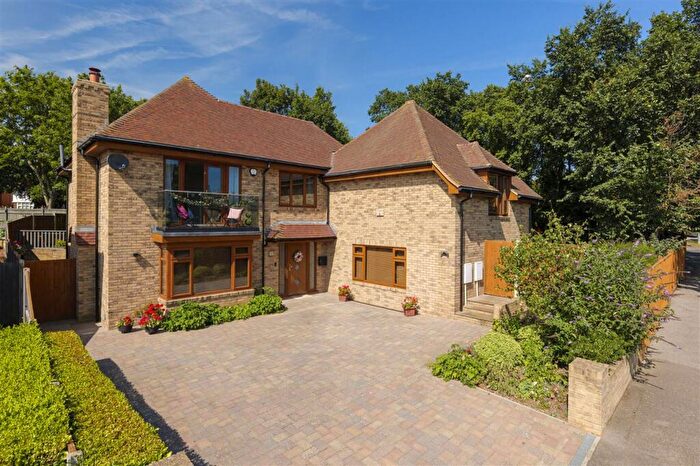
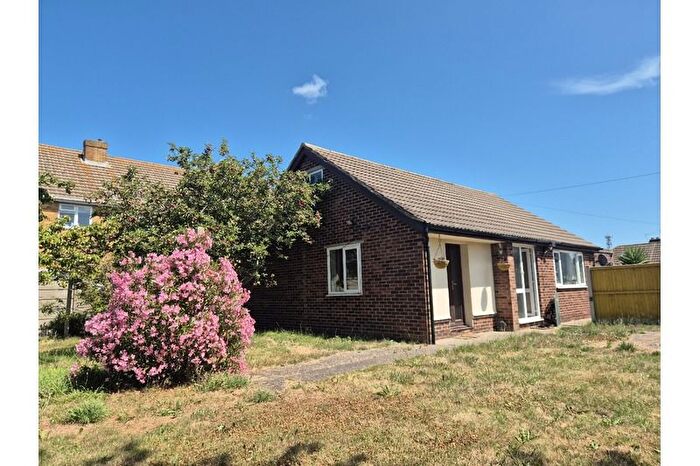
Properties for sale in Ramsgate
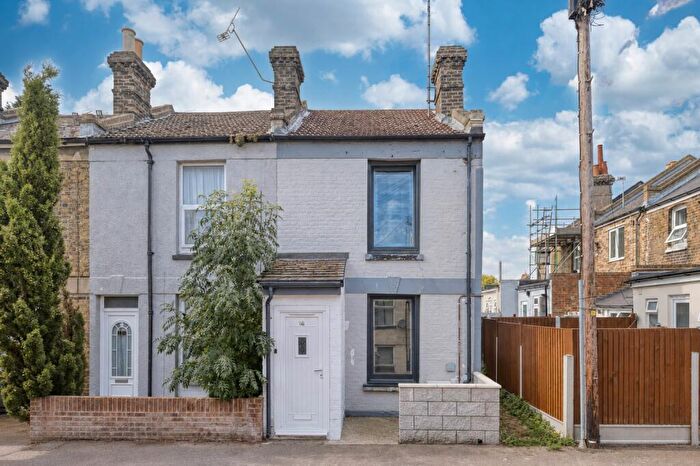


![]()
If you are looking to sell your house, let it out, or receive a property valuation, an expert can help you.
Click the button below to get started.

Neighbourhoods in Ramsgate
Navigate through our locations to find the location of your next house in Ramsgate, Kent for sale or to rent.
Property price trends in Ramsgate
According to the latest Land Registry data, the average home in Ramsgate sold for £267,609 in 2026. That figure comes from a substantial record of 29,037 sales logged over the past 31 years.
Prices have fallen back over the last three years. Compared with 2023, when the typical sale came in around £295,972, that's a fall of roughly 9.6%.
Looking back five years, average prices are down about 6.8% since 2021, a drop of around £19,518 in cash terms.
Zoom out to the past decade for the fuller picture. Back in 2016, homes here averaged £202,395, so the typical sold price has climbed about 32.2% since then, roughly 2.8% a year. Stretch the view to fifteen years and that annual pace edges up closer to 3.9%.
Frequently asked questions about Ramsgate
What is the average price for a property for sale in Ramsgate?
The average price for a property for sale in Ramsgate is £277,493. This amount is 29% lower than the average price in Kent. There are more than 10,000 property listings for sale in Ramsgate.
What locations have the most expensive properties for sale in Ramsgate?
The locations with the most expensive properties for sale in Ramsgate are Cliffsend And Pegwell at an average of £346,622, Thanet Villages at an average of £323,474 and Nethercourt at an average of £292,711.
What locations have the most affordable properties for sale in Ramsgate?
The locations with the most affordable properties for sale in Ramsgate are Newington at an average of £226,278, Eastcliff at an average of £230,953 and Northwood at an average of £271,842.
Which train stations are available in or near Ramsgate?
Some of the train stations available in or near Ramsgate are Ramsgate, Dumpton Park and Broadstairs.
Property Price Paid in Ramsgate by Year
The average sold property price by year was:
| Year | Average Sold Price | Price Change |
Sold Properties
|
|---|---|---|---|
| 2026 | £267,609 | 0,4% |
62 Properties |
| 2025 | £266,419 | -3% |
671 Properties |
| 2024 | £273,200 | -8% |
735 Properties |
| 2023 | £295,972 | -1% |
606 Properties |
| 2022 | £297,958 | 4% |
865 Properties |
| 2021 | £287,127 | 12% |
1,193 Properties |
| 2020 | £253,218 | 6% |
720 Properties |
| 2019 | £238,465 | 3% |
803 Properties |
| 2018 | £232,003 | 2% |
905 Properties |
| 2017 | £226,348 | 11% |
1,039 Properties |
Property Price per Property Type in Ramsgate
Here you can find historic sold price data in order to help with your property search.
The average Property Paid Price for specific property types in the last three years are:
| Property Type | Average Sold Price | Sold Properties |
|---|---|---|
| Semi Detached House | £305,894.00 | 603 Semi Detached Houses |
| Terraced House | £267,176.00 | 780 Terraced Houses |
| Detached House | £407,676.00 | 284 Detached Houses |
| Flat | £164,347.00 | 407 Flats |
Transport in Ramsgate
Please see below transportation links in this area:
