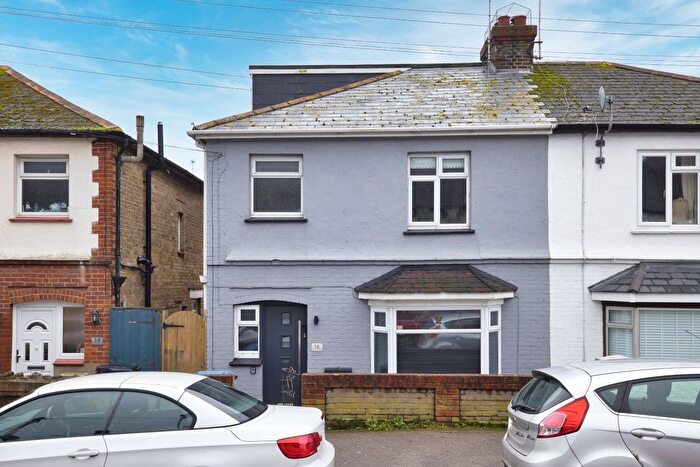
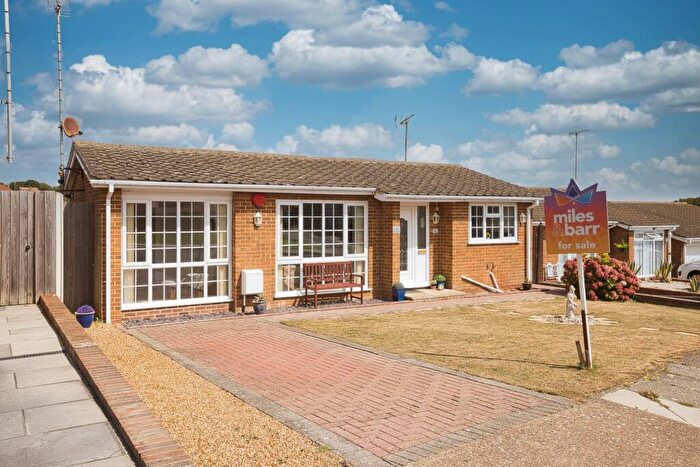
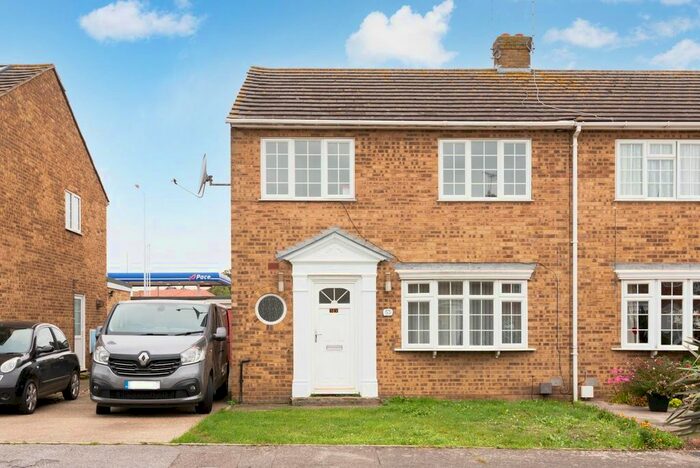
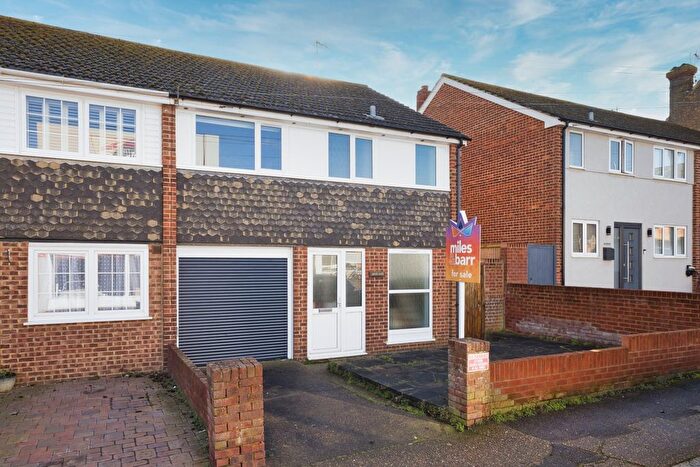
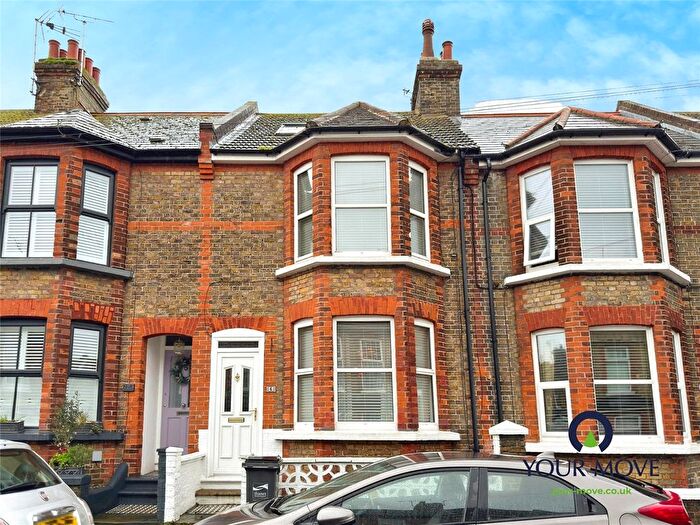
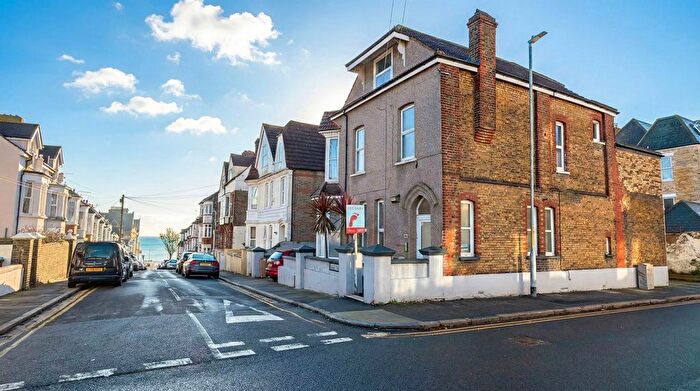
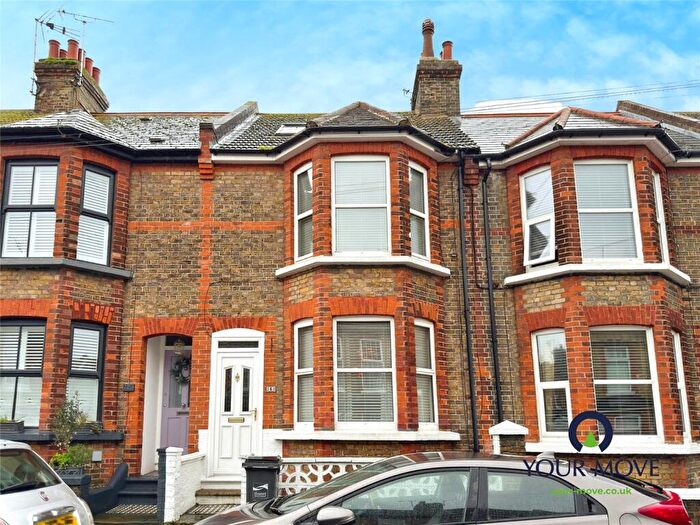
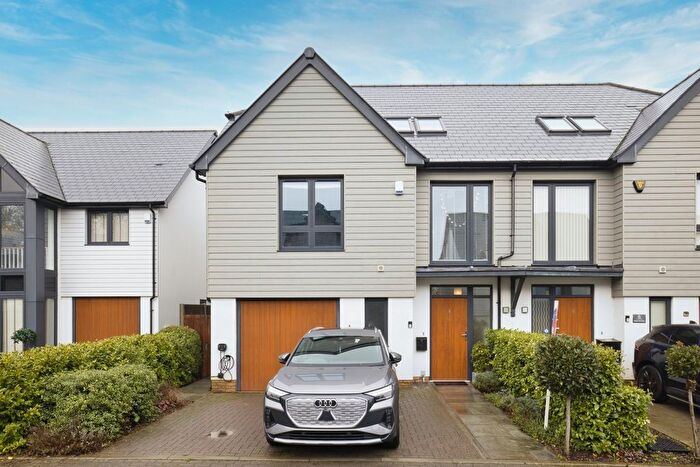
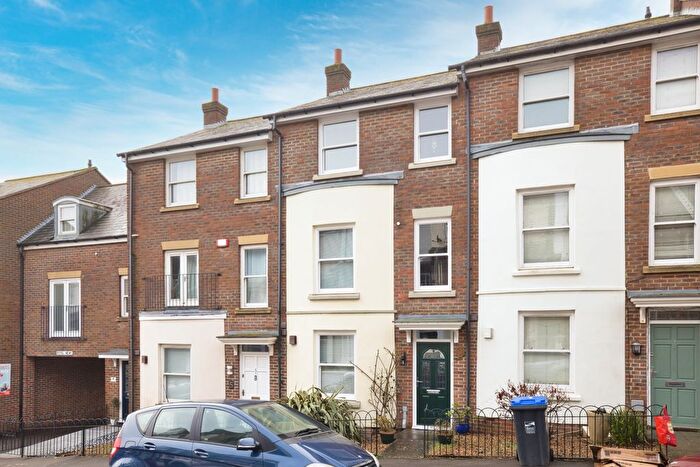
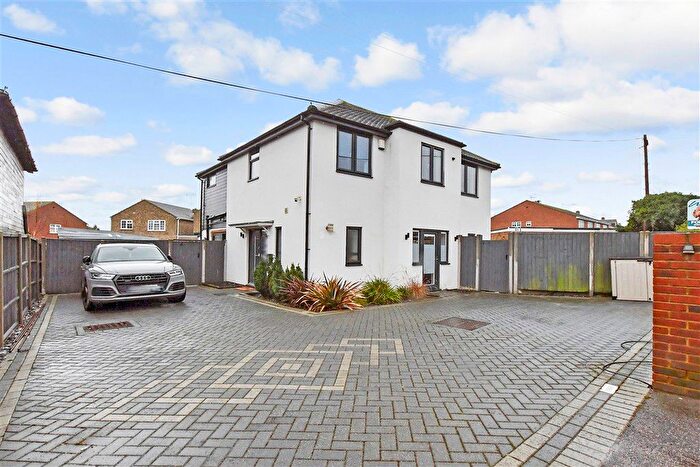
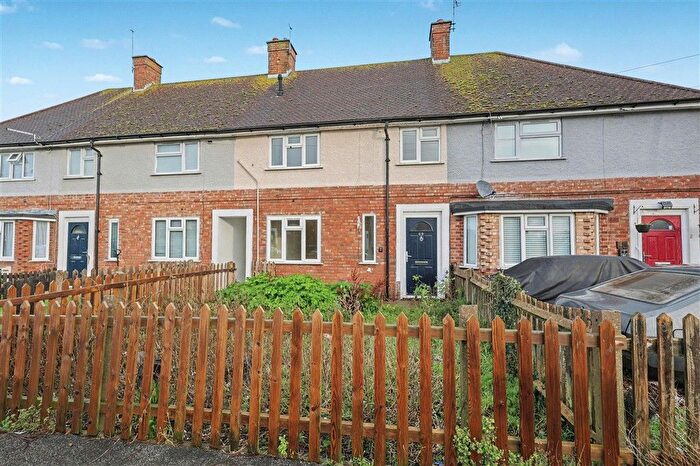
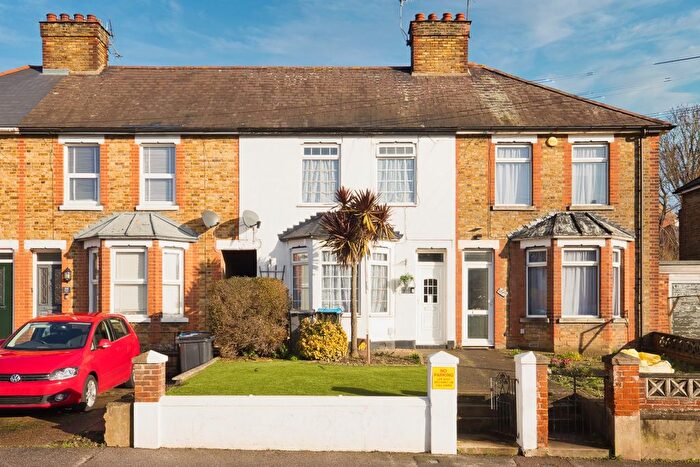
Houses for sale & to rent in Sir Moses Montefiore, Ramsgate
House Prices in Sir Moses Montefiore
Properties in Sir Moses Montefiore have an average house price of £289,768.00 and had 164 Property Transactions within the last 3 years¹.
Sir Moses Montefiore is an area in Ramsgate, Kent with 2,114 households², where the most expensive property was sold for £1,300,000.00.
Properties for sale in Sir Moses Montefiore
Roads and Postcodes in Sir Moses Montefiore
Navigate through our locations to find the location of your next house in Sir Moses Montefiore, Ramsgate for sale or to rent.
| Streets | Postcodes |
|---|---|
| Avebury Avenue | CT11 8BB |
| Baillemore Court | CT11 7TE |
| Beechcroft Gardens | CT11 7HE |
| Brindle Grove | CT11 8BN |
| Brockenhurst Road | CT11 8ED |
| Cecilia Road | CT11 7DY CT11 7DZ CT11 7DX |
| College Road | CT11 7AD |
| Cornwall Avenue | CT11 7HD |
| Cranbourne Close | CT11 7HB |
| Crinan Court | CT11 7TH |
| Dumpton Lane | CT11 7AN CT11 7AJ |
| Dumpton Park Drive | CT11 8AD CT11 8AE CT11 8AN CT11 8AP CT11 8AR CT11 8AT CT11 8BA CT11 8BH CT11 8BP CT11 8AL |
| Dunoon Court | CT11 7TD |
| Ellen Avenue | CT11 7DD |
| Fairfield Road | CT11 7BB CT11 7BD CT11 7BE |
| Frances Gardens | CT11 8AF |
| Granville Farm Mews | CT11 8EU |
| Harebrook | CT11 8BQ |
| Hawthorn Close | CT11 7BG |
| Heathwood Drive | CT11 7DE |
| Hereson Road | CT11 7DS CT11 7DU CT11 7EE CT11 7EG CT11 7EH CT11 7EL CT11 7ER CT11 7ET CT11 7HG CT11 7HH CT11 7HQ CT11 7EX |
| Honeysuckle Road | CT11 8AA CT11 8AB |
| Inverary Court | CT11 7TF |
| Kilbride Court | CT11 7TB |
| Lillian Road | CT11 7DT |
| Lyndhurst Road | CT11 8EA CT11 8EF |
| Michael Avenue | CT11 8AW |
| Montefiore Avenue | CT11 8BD CT11 8BE CT11 8BW |
| Moss End Mews | CT11 7BW |
| Muir Road | CT11 8AU CT11 8AX |
| Mulberry Close | CT11 8EW |
| Oakwood Villas | CT11 7AW |
| Park Cottages | CT11 7BY |
| Penshurst Road | CT11 8EG |
| Prestedge Avenue | CT11 7BP CT11 7BT CT11 7BU CT11 7BS |
| Queens Road | CT11 8DZ CT11 8EE |
| Ramsgate Road | CT11 7DL |
| Rosebery Avenue | CT11 7ES |
| Rothsay Court | CT11 7TA |
| Sandwood Road | CT11 7DH |
| Sherwood Gardens | CT11 7AP CT11 7AR |
| Shirley Avenue | CT11 7AT CT11 7AU |
| Springfield Close | CT11 7BQ |
| St Andrews Road | CT11 7EQ |
| St Catherines Court | CT11 7TG |
| St Davids Road | CT11 7EP |
| St Georges Road | CT11 7EF |
| St Patricks Road | CT11 7EJ |
| Stonar Close | CT11 7BA |
| Sycamore Grange | CT11 7EW |
| Sydney Road | CT11 8EJ |
| Tavistock Road | CT11 7AX |
| Thanet Road | CT11 8EH CT11 8EL |
| The Chase | CT11 8BF |
| The Parade | CT11 7DQ |
| Thorn Gardens | CT11 7AS |
| Union Road | CT11 7EB |
| Victoria Parade | CT11 8AJ CT11 8DU CT11 8EB |
| Vine Close | CT11 7BJ CT11 7BN |
| Wallwood Road | CT11 8AS |
| Warten Road | CT11 8BJ CT11 8BL |
| West Dumpton Lane | CT11 7BH CT11 7BL CT11 7BX CT11 7BZ CT11 7DF CT11 7DG |
| Wickham Avenue | CT11 8AY |
| Winterstoke Crescent | CT11 8AH CT11 8AQ |
| Winterstoke Way | CT11 8AG |
Transport near Sir Moses Montefiore
- FAQ
- Price Paid By Year
- Property Type Price
Frequently asked questions about Sir Moses Montefiore
What is the average price for a property for sale in Sir Moses Montefiore?
The average price for a property for sale in Sir Moses Montefiore is £289,768. This amount is 4% higher than the average price in Ramsgate. There are 3,417 property listings for sale in Sir Moses Montefiore.
What streets have the most expensive properties for sale in Sir Moses Montefiore?
The streets with the most expensive properties for sale in Sir Moses Montefiore are Victoria Parade at an average of £1,050,000, Winterstoke Crescent at an average of £680,000 and Lyndhurst Road at an average of £482,500.
What streets have the most affordable properties for sale in Sir Moses Montefiore?
The streets with the most affordable properties for sale in Sir Moses Montefiore are Vine Close at an average of £196,928, Oakwood Villas at an average of £200,000 and Cecilia Road at an average of £205,520.
Which train stations are available in or near Sir Moses Montefiore?
Some of the train stations available in or near Sir Moses Montefiore are Dumpton Park, Ramsgate and Broadstairs.
Property Price Paid in Sir Moses Montefiore by Year
The average sold property price by year was:
| Year | Average Sold Price | Price Change |
Sold Properties
|
|---|---|---|---|
| 2025 | £286,360 | -1% |
43 Properties |
| 2024 | £288,921 | -1% |
56 Properties |
| 2023 | £292,753 | -4% |
65 Properties |
| 2022 | £305,257 | 8% |
82 Properties |
| 2021 | £280,383 | 14% |
91 Properties |
| 2020 | £240,168 | -4% |
68 Properties |
| 2019 | £249,323 | 4% |
83 Properties |
| 2018 | £239,442 | 8% |
82 Properties |
| 2017 | £220,141 | 7% |
98 Properties |
| 2016 | £205,433 | 8% |
96 Properties |
| 2015 | £189,959 | 13% |
101 Properties |
| 2014 | £165,723 | 10% |
118 Properties |
| 2013 | £149,251 | -12% |
81 Properties |
| 2012 | £166,953 | 4% |
65 Properties |
| 2011 | £159,462 | -9% |
54 Properties |
| 2010 | £173,171 | 3% |
67 Properties |
| 2009 | £167,690 | 3% |
43 Properties |
| 2008 | £162,992 | -12% |
60 Properties |
| 2007 | £182,937 | 14% |
121 Properties |
| 2006 | £156,792 | 3% |
157 Properties |
| 2005 | £151,857 | 8% |
109 Properties |
| 2004 | £140,005 | 16% |
150 Properties |
| 2003 | £118,256 | 15% |
140 Properties |
| 2002 | £100,902 | 18% |
197 Properties |
| 2001 | £83,005 | 19% |
181 Properties |
| 2000 | £67,583 | 21% |
89 Properties |
| 1999 | £53,328 | 8% |
116 Properties |
| 1998 | £49,226 | 7% |
102 Properties |
| 1997 | £45,705 | 10% |
127 Properties |
| 1996 | £40,947 | 0,4% |
85 Properties |
| 1995 | £40,802 | - |
70 Properties |
Property Price per Property Type in Sir Moses Montefiore
Here you can find historic sold price data in order to help with your property search.
The average Property Paid Price for specific property types in the last three years are:
| Property Type | Average Sold Price | Sold Properties |
|---|---|---|
| Semi Detached House | £289,173.00 | 46 Semi Detached Houses |
| Detached House | £485,921.00 | 19 Detached Houses |
| Terraced House | £262,007.00 | 83 Terraced Houses |
| Flat | £202,562.00 | 16 Flats |

