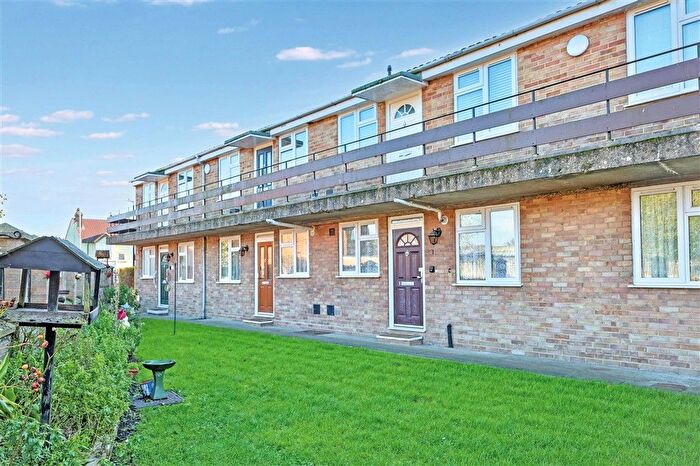
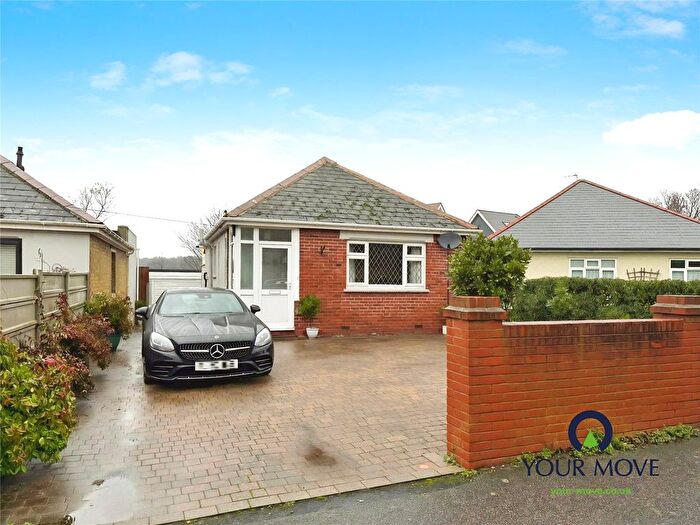
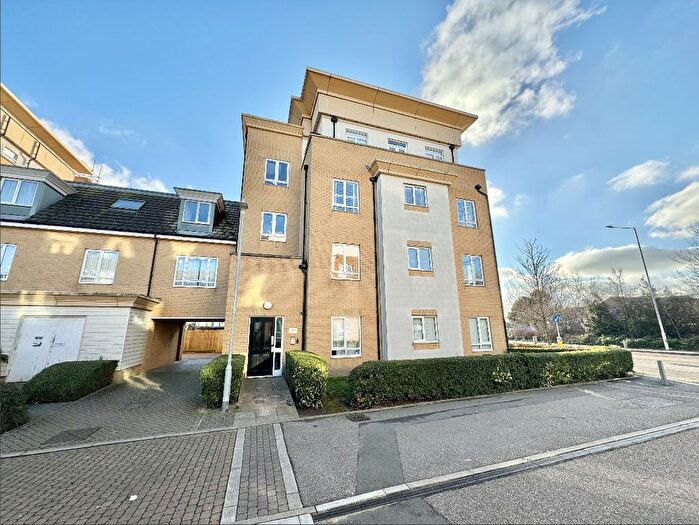
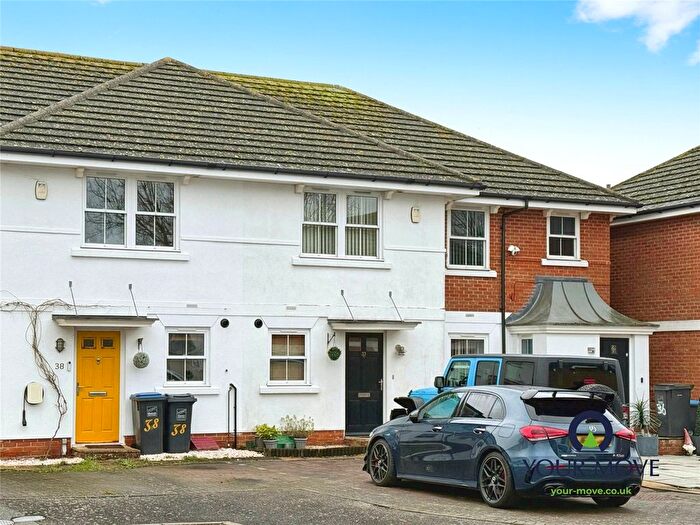
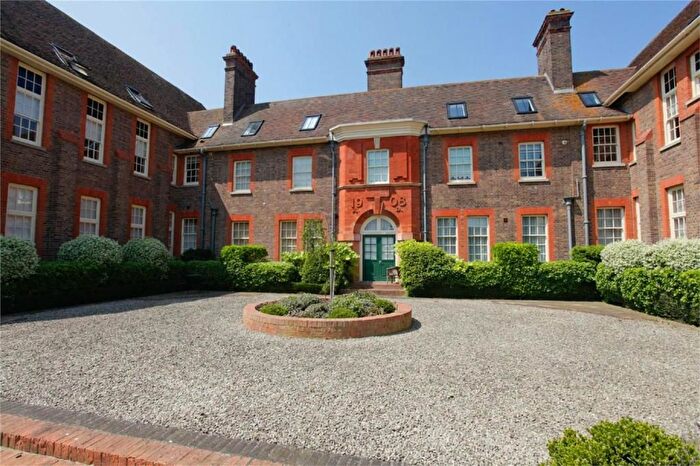
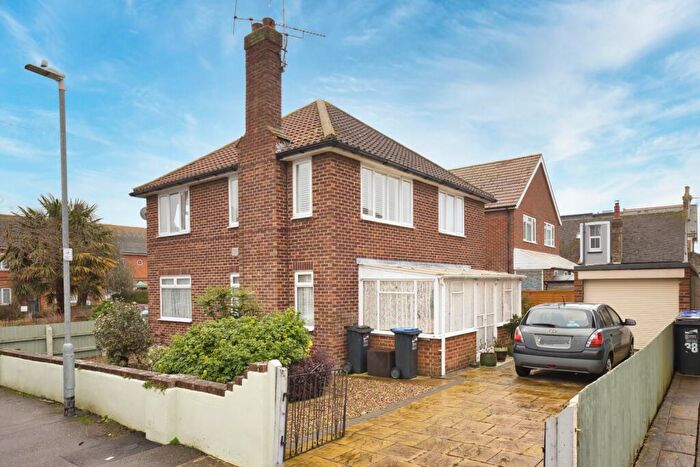
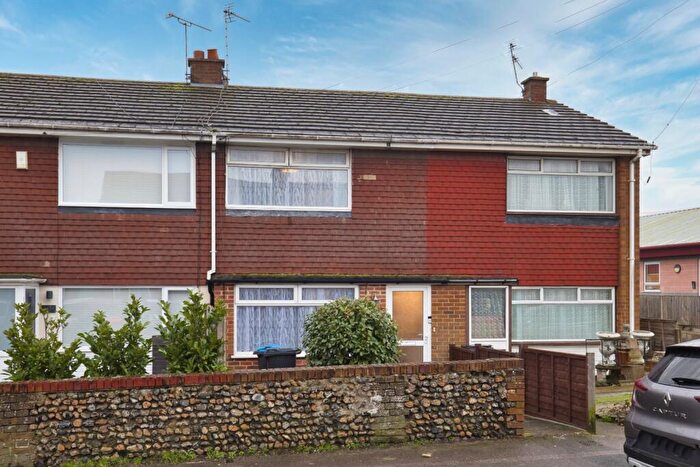
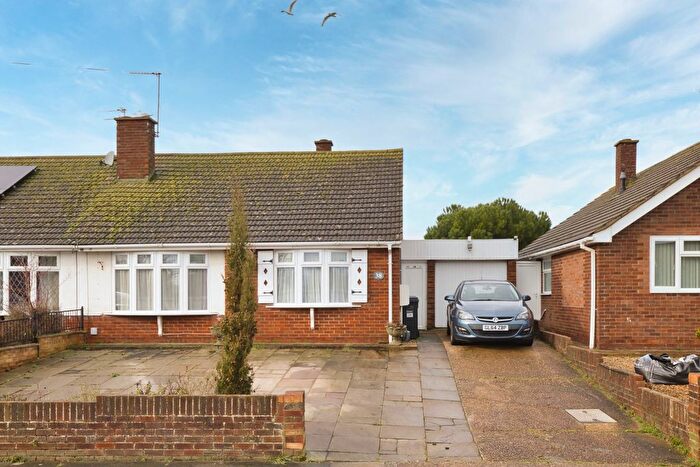
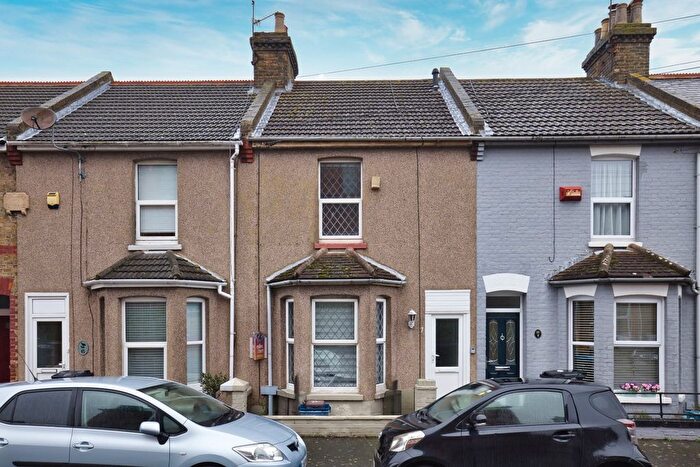
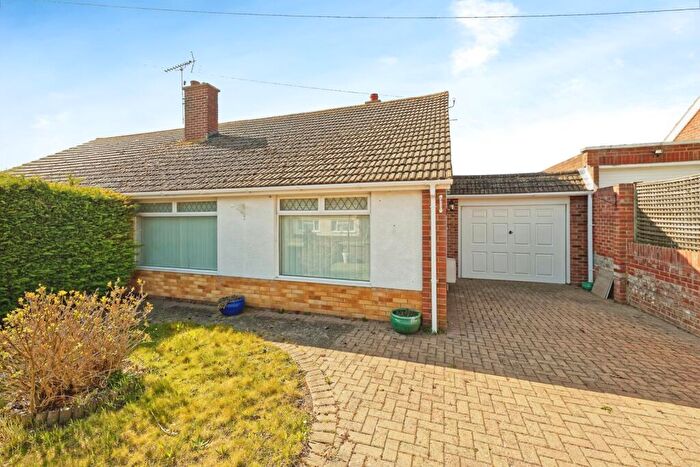
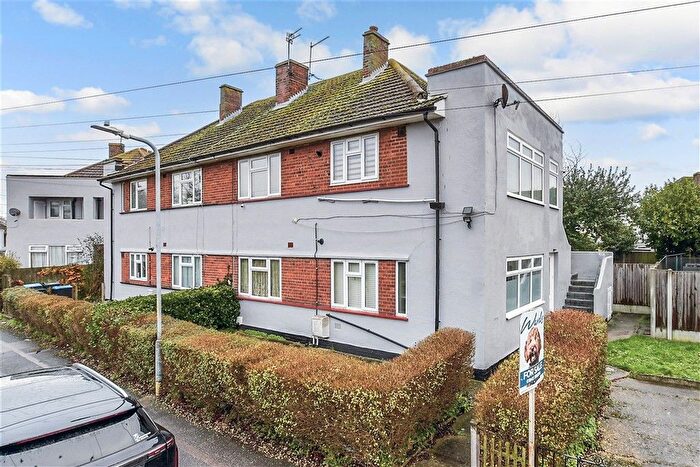
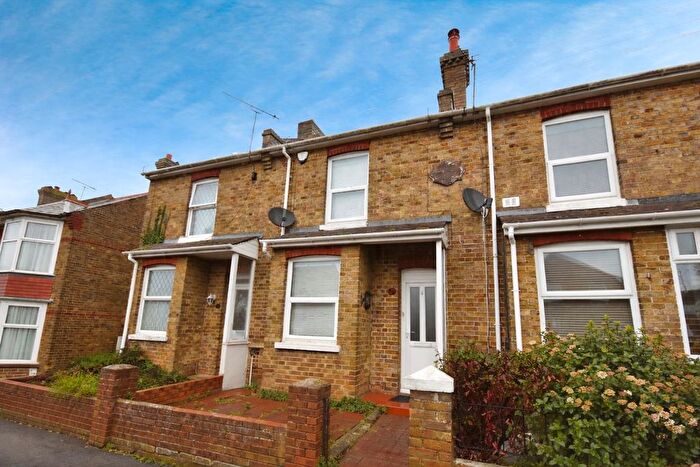
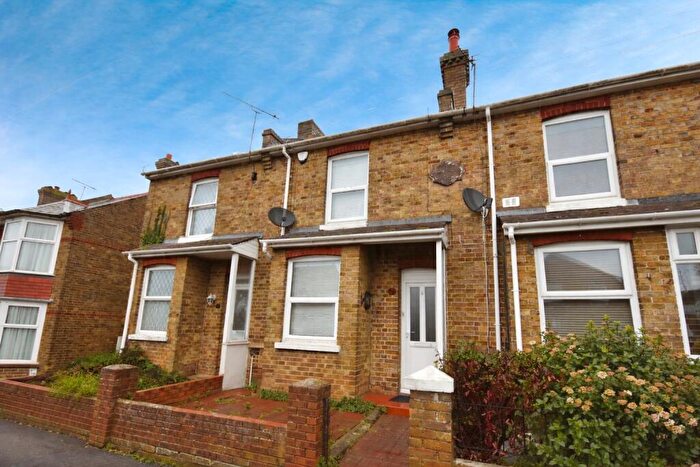
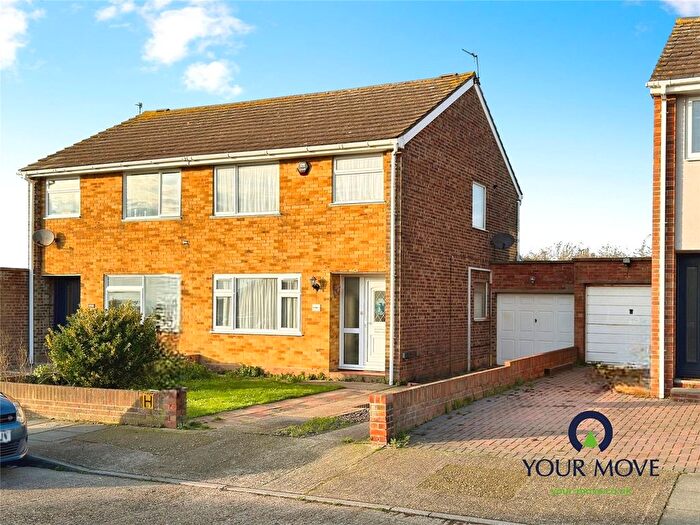
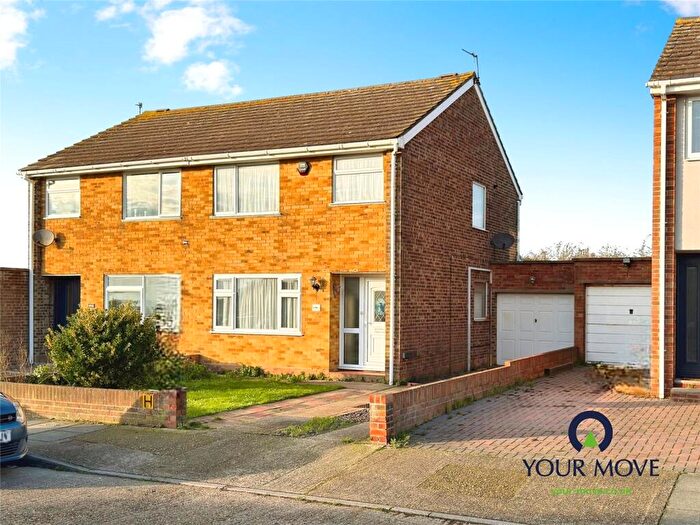
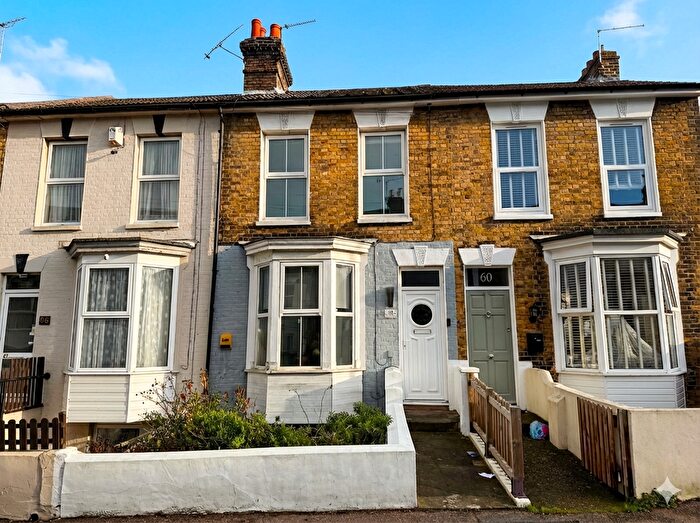
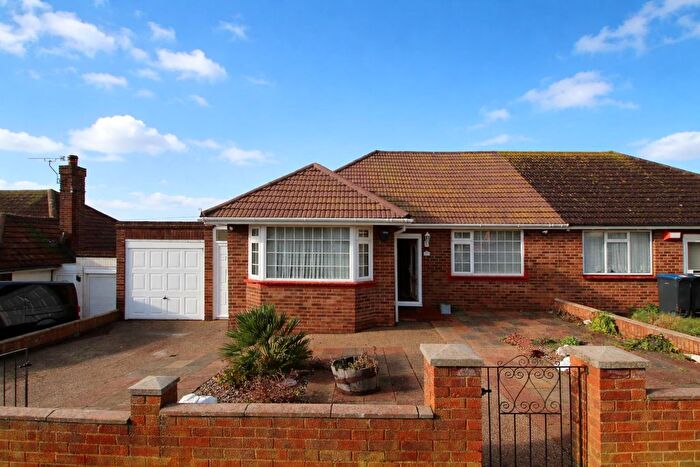
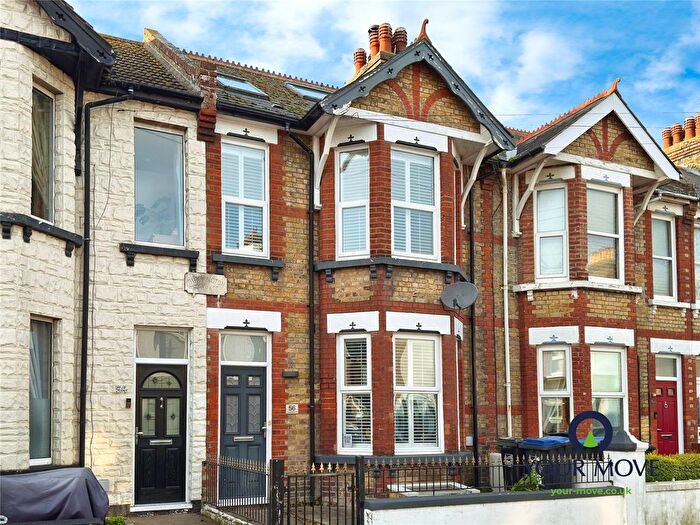
Houses for sale & to rent in Nethercourt, Ramsgate
House Prices in Nethercourt
Properties in Nethercourt have an average house price of £297,566.00 and had 220 Property Transactions within the last 3 years¹.
Nethercourt is an area in Ramsgate, Kent with 2,020 households², where the most expensive property was sold for £1,225,000.00.
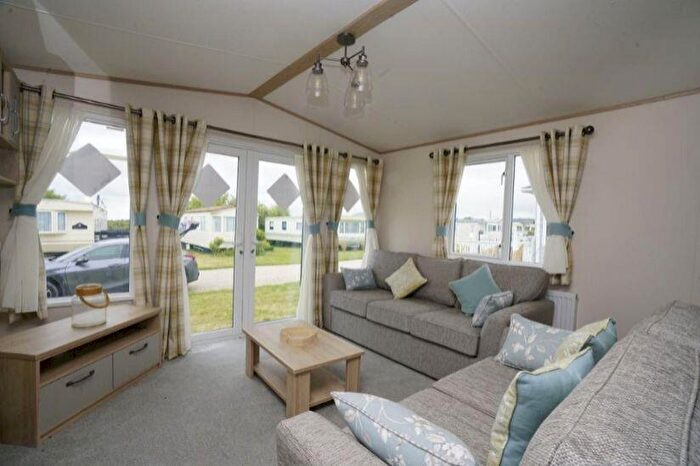
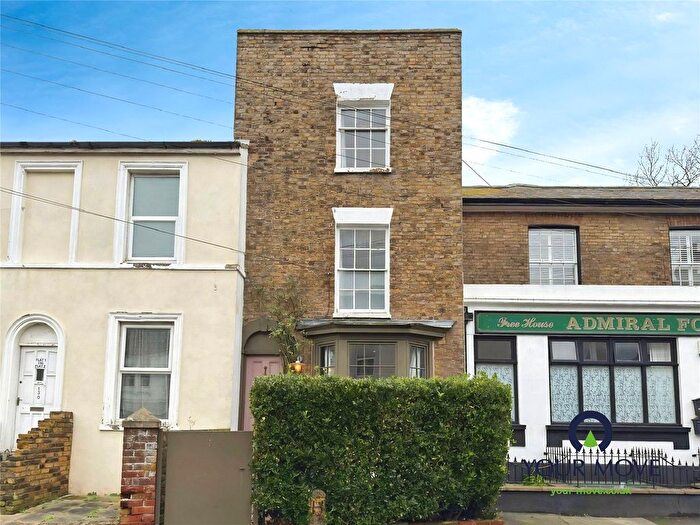
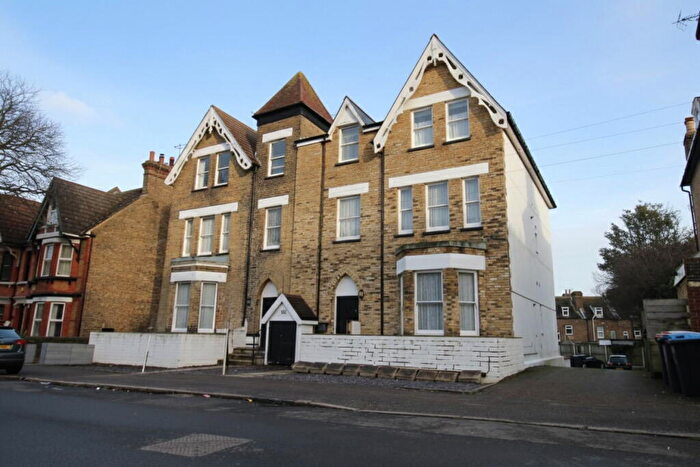
Properties for sale in Nethercourt
Roads and Postcodes in Nethercourt
Navigate through our locations to find the location of your next house in Nethercourt, Ramsgate for sale or to rent.
| Streets | Postcodes |
|---|---|
| Armadale Villas | CT11 0AR |
| Ashburnham Road | CT11 0BH CT11 0BJ CT11 0BN CT11 0BL |
| Bloomsbury Road | CT11 0AG CT11 0AQ |
| Borrowdale Avenue | CT11 0PS |
| Canterbury Road East | CT11 0JX CT11 0LA |
| Chapel Road | CT11 0BS CT11 0BW |
| Claremont Gardens | CT11 0BP |
| Clarence Road | CT11 0DX |
| Coniston Avenue | CT11 0PN CT11 0PW |
| Derwent Avenue | CT11 0QA |
| Drybeck Avenue | CT11 0NX |
| Edith Road | CT11 0ET |
| Ellington Place | CT11 0ES |
| Eskdale Avenue | CT11 0PB CT11 0PD |
| Fir Tree Close | CT11 0BD CT11 0BU |
| Grange Road | CT11 9PP CT11 9PR CT11 9PT CT11 9PX CT11 9QB |
| Grasmere Avenue | CT11 0PP CT11 0PR |
| Grosvenor Road | CT11 0AY |
| Grummock Avenue | CT11 0RP CT11 0RR |
| Hallcroft Court | CT11 0BT |
| Hawes Avenue | CT11 0RN |
| Helvellyn Avenue | CT11 0RL CT11 0RS CT11 0RW |
| Herbert Road | CT11 0AS |
| High Street | CT11 0QG CT11 0QP CT11 0QR CT11 0QS CT11 0QW |
| Kendal Close | CT11 0JU |
| Kentmere Avenue | CT11 0QF |
| King Edward Road | CT11 0AT |
| Kirkstone Avenue | CT11 0NT |
| Langdale Avenue | CT11 0PG CT11 0PQ |
| Lorne Road | CT11 0AB CT11 0AE CT11 0BZ |
| Mays Road | CT11 0AD |
| Myrtle Cottages | CT11 0QN |
| Napleton Road | CT11 0AH CT11 0EL |
| Nethercourt Farm Road | CT11 0RT CT11 0RU |
| Nethercourt Gardens | CT11 0RY |
| Nethercourt Hill | CT11 0RX CT11 0RZ |
| Old School Row | CT11 0EW CT11 0FD |
| Prices Avenue | CT11 0AN CT11 0EP |
| Queen Bertha Road | CT11 0DY |
| Rawdon Road | CT11 0DZ |
| Rose Terrace | CT11 0BF |
| Rydal Avenue | CT11 0PT CT11 0PU CT11 0PX CT11 0PY CT11 0PZ |
| Seafield Mews | CT11 0FB |
| Seafield Road | CT11 0AU CT11 0AX |
| Southwood Gardens | CT11 0BG CT11 0BQ |
| Southwood Heights | CT11 0BE |
| Southwood Road | CT11 0AA CT11 0AJ CT11 0AL CT11 0AW CT11 0AZ CT11 0BA CT11 0AP |
| St Lawrence Chase | CT11 0RD |
| The Grange | CT11 9FR |
| Thirlmere Avenue | CT11 0PH CT11 0PJ |
| Weigall Place | CT11 0BB |
| Whinfell Avenue | CT11 0QE |
| Windermere Avenue | CT11 0NU CT11 0PA CT11 0PE CT11 0PF CT11 0PL CT11 0QB CT11 0QD |
| CT11 0FG |
Transport near Nethercourt
- FAQ
- Price Paid By Year
- Property Type Price
Frequently asked questions about Nethercourt
What is the average price for a property for sale in Nethercourt?
The average price for a property for sale in Nethercourt is £297,566. This amount is 7% higher than the average price in Ramsgate. There are 3,002 property listings for sale in Nethercourt.
What streets have the most expensive properties for sale in Nethercourt?
The streets with the most expensive properties for sale in Nethercourt are Grange Road at an average of £448,861, Kendal Close at an average of £425,000 and Coniston Avenue at an average of £403,000.
What streets have the most affordable properties for sale in Nethercourt?
The streets with the most affordable properties for sale in Nethercourt are Claremont Gardens at an average of £155,500, Chapel Road at an average of £203,000 and Lorne Road at an average of £204,500.
Which train stations are available in or near Nethercourt?
Some of the train stations available in or near Nethercourt are Ramsgate, Dumpton Park and Broadstairs.
Property Price Paid in Nethercourt by Year
The average sold property price by year was:
| Year | Average Sold Price | Price Change |
Sold Properties
|
|---|---|---|---|
| 2025 | £283,115 | -5% |
78 Properties |
| 2024 | £297,305 | -7% |
83 Properties |
| 2023 | £317,039 | 1% |
59 Properties |
| 2022 | £314,964 | 10% |
76 Properties |
| 2021 | £283,191 | 13% |
111 Properties |
| 2020 | £245,670 | 1% |
82 Properties |
| 2019 | £242,320 | -7% |
82 Properties |
| 2018 | £259,712 | 11% |
90 Properties |
| 2017 | £231,256 | 9% |
95 Properties |
| 2016 | £210,215 | 10% |
111 Properties |
| 2015 | £188,411 | 6% |
112 Properties |
| 2014 | £177,312 | 9% |
83 Properties |
| 2013 | £161,292 | 8% |
81 Properties |
| 2012 | £148,914 | -2% |
78 Properties |
| 2011 | £151,445 | 2% |
70 Properties |
| 2010 | £148,453 | 5% |
64 Properties |
| 2009 | £140,828 | -19% |
82 Properties |
| 2008 | £167,499 | -8% |
61 Properties |
| 2007 | £180,367 | 5% |
162 Properties |
| 2006 | £171,191 | 8% |
178 Properties |
| 2005 | £156,893 | 9% |
84 Properties |
| 2004 | £142,220 | 13% |
105 Properties |
| 2003 | £124,411 | 19% |
118 Properties |
| 2002 | £101,247 | 26% |
124 Properties |
| 2001 | £74,904 | 12% |
108 Properties |
| 2000 | £65,879 | 7% |
104 Properties |
| 1999 | £61,172 | 13% |
129 Properties |
| 1998 | £53,346 | 13% |
100 Properties |
| 1997 | £46,242 | -1% |
96 Properties |
| 1996 | £46,787 | -2% |
67 Properties |
| 1995 | £47,542 | - |
69 Properties |
Property Price per Property Type in Nethercourt
Here you can find historic sold price data in order to help with your property search.
The average Property Paid Price for specific property types in the last three years are:
| Property Type | Average Sold Price | Sold Properties |
|---|---|---|
| Semi Detached House | £314,146.00 | 102 Semi Detached Houses |
| Detached House | £372,424.00 | 33 Detached Houses |
| Terraced House | £252,521.00 | 80 Terraced Houses |
| Flat | £186,000.00 | 5 Flats |

