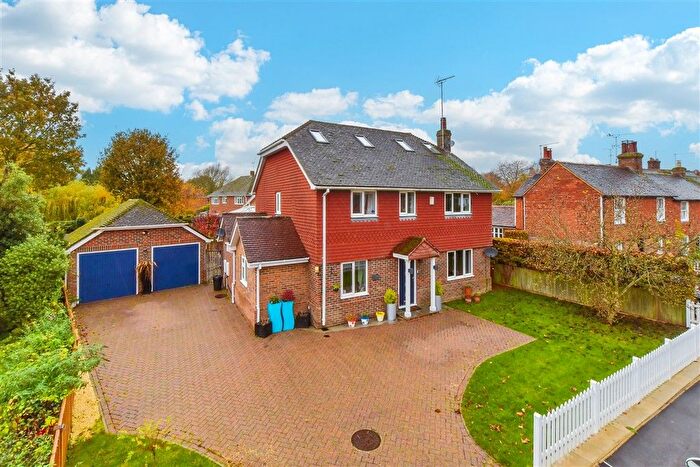
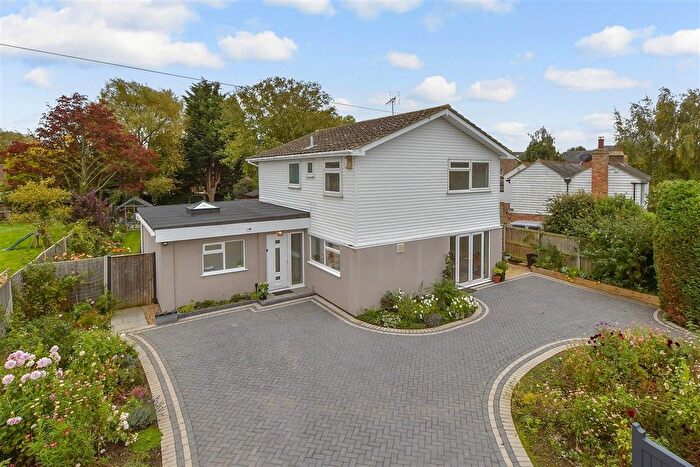
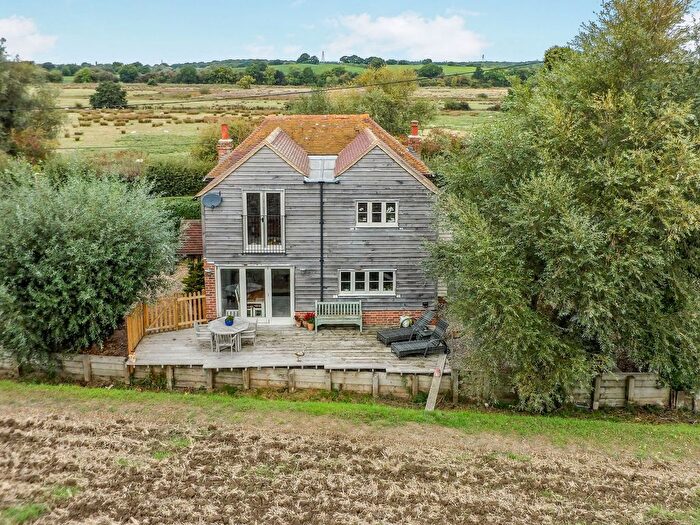
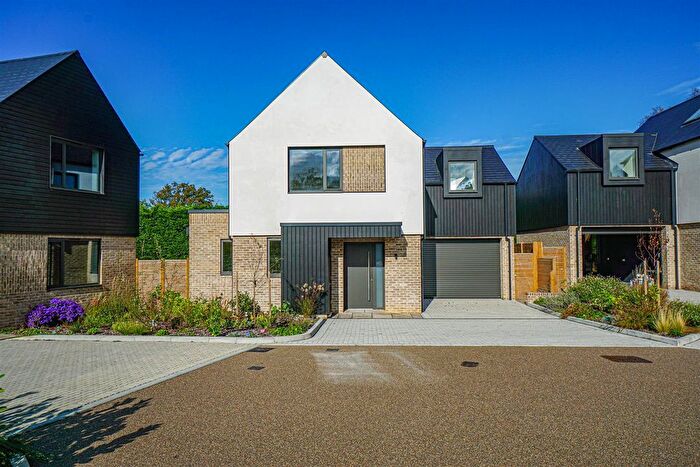
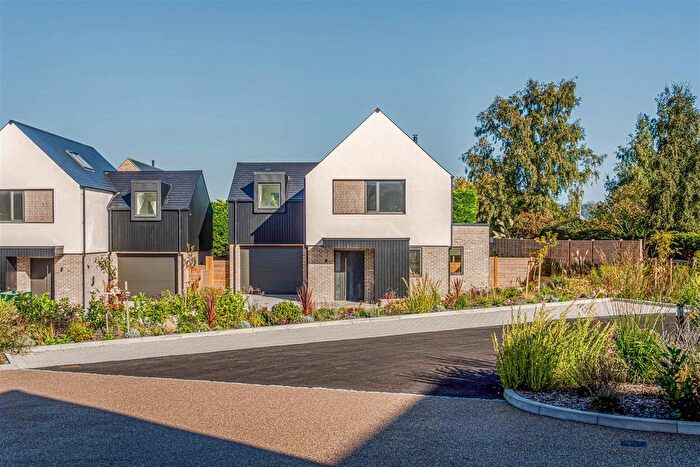
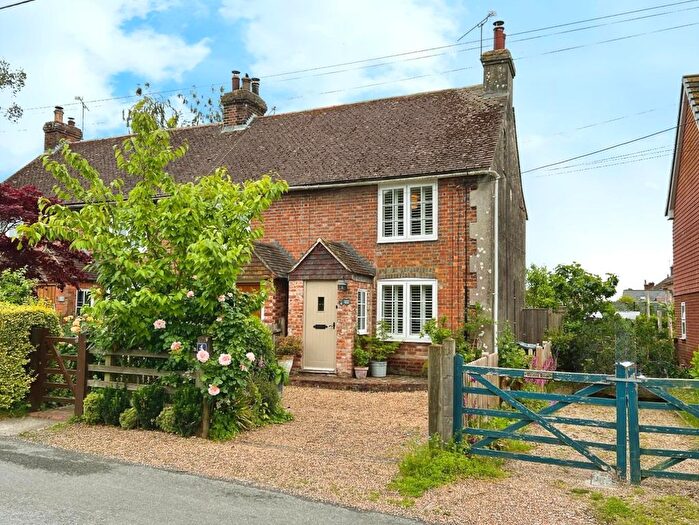
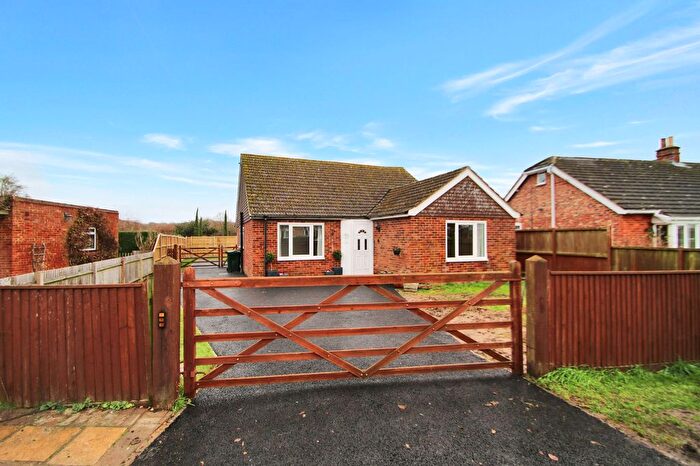
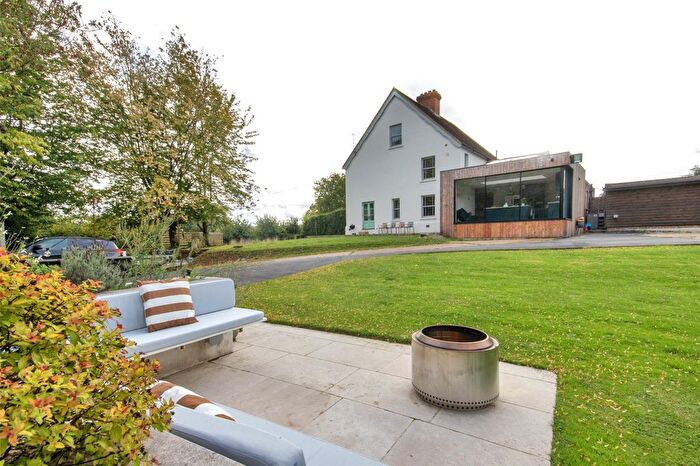
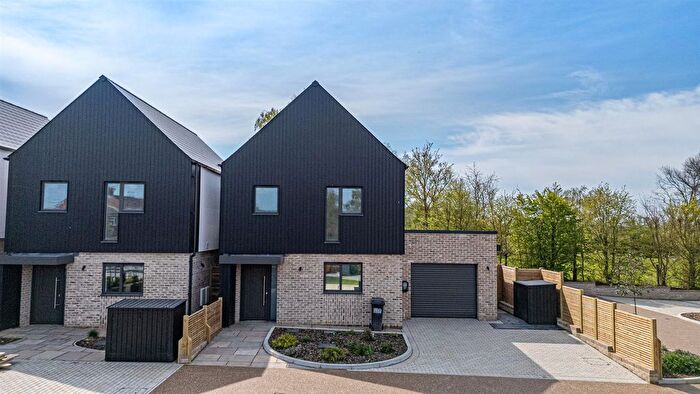
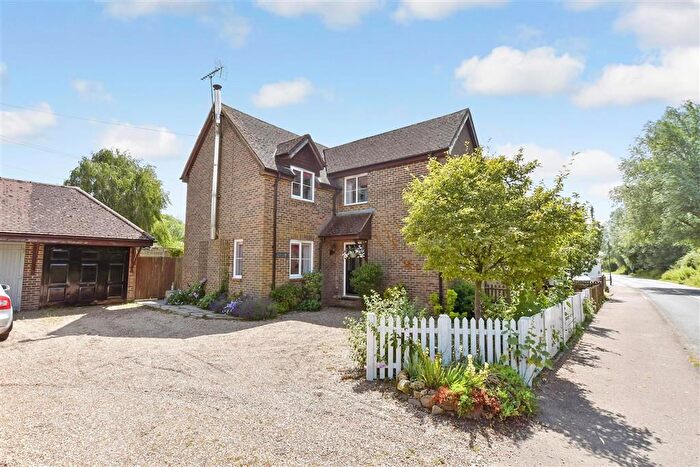
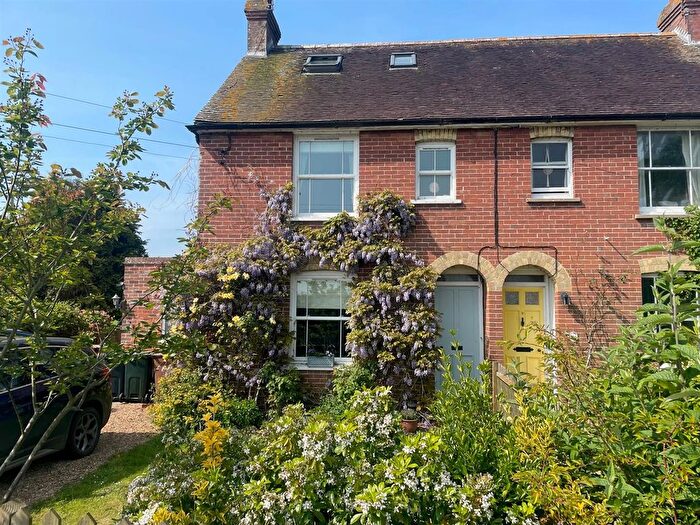
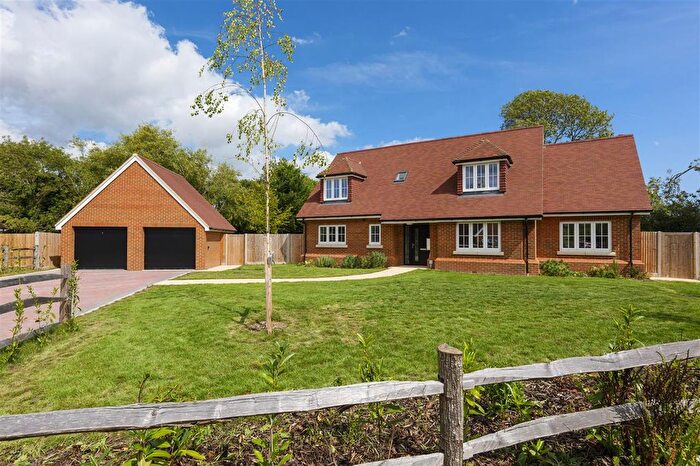
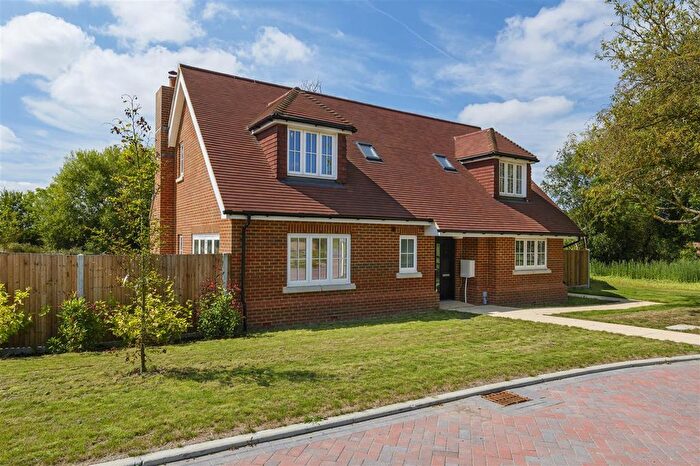
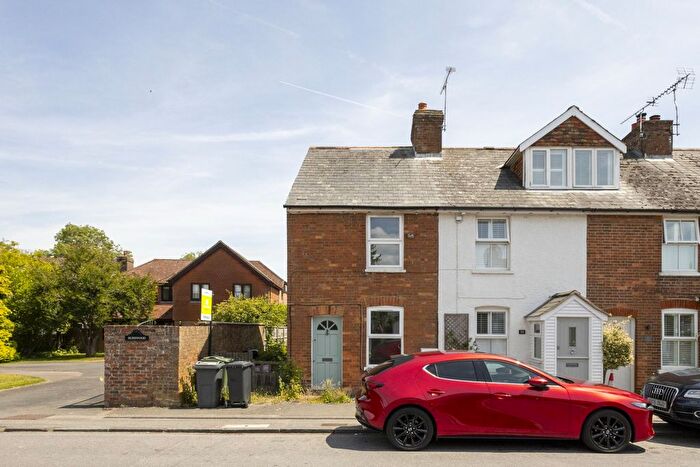
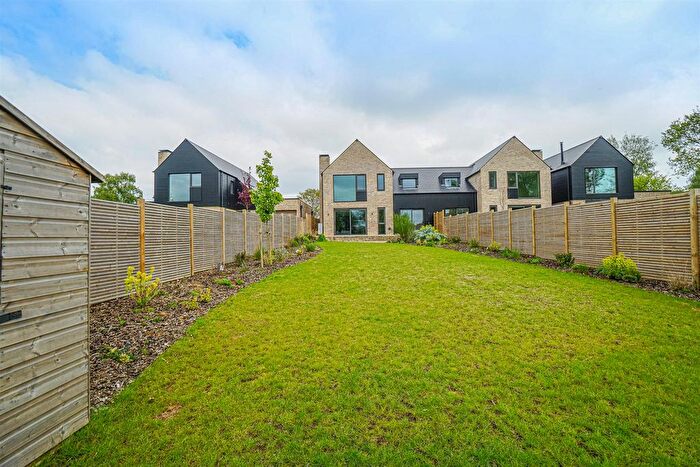
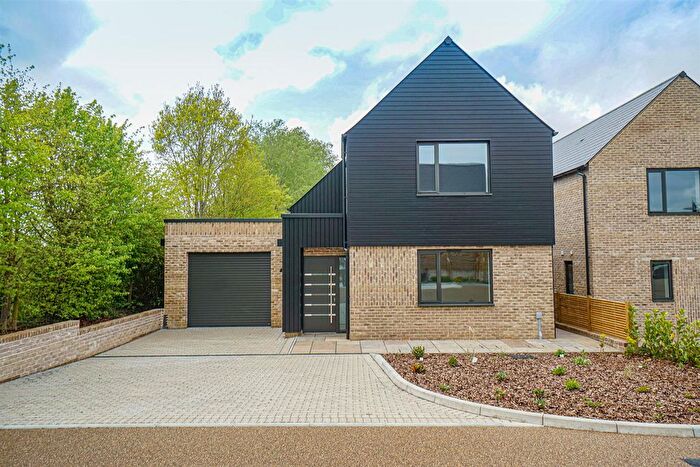
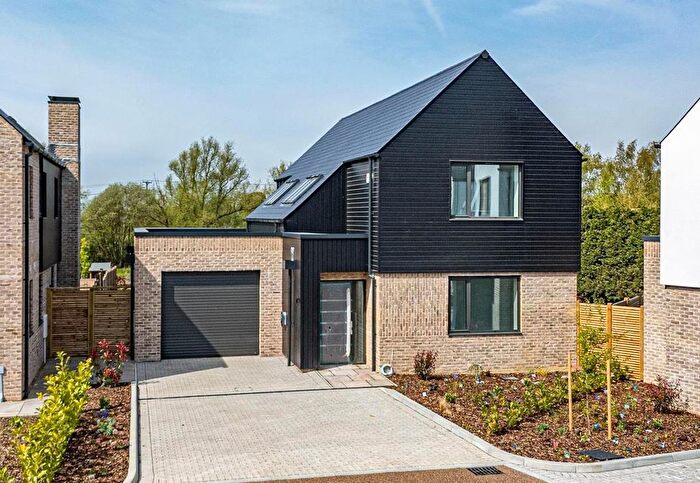
Houses for sale & to rent in Isle Of Oxney, Ashford
House Prices in Isle Of Oxney
Properties in Isle Of Oxney have an average house price of £498,675.00 and had 30 Property Transactions within the last 3 years¹.
Isle Of Oxney is an area in Ashford, Kent with 417 households², where the most expensive property was sold for £975,000.00.
Properties for sale in Isle Of Oxney
Previously listed properties in Isle Of Oxney
Roads and Postcodes in Isle Of Oxney
Navigate through our locations to find the location of your next house in Isle Of Oxney, Ashford for sale or to rent.
| Streets | Postcodes |
|---|---|
| Appledore Road | TN26 2LZ TN26 2NA |
| Applegate Court | TN26 2AQ |
| Church Lane | TN26 2NG TN26 2NQ |
| Court Lodge Road | TN26 2DD TN26 2DH |
| Coxland | TN26 2AW |
| Donkey Lane | TN26 2BD |
| Elmtree Cottages | TN26 2DL |
| Ferry Road | TN26 2DN |
| Hawthorn | TN26 2AH |
| Heath Road | TN26 2LA |
| Heathside | TN26 2AT |
| High House Lane | TN26 2LF |
| Kenardington Road | TN26 2BP TN26 2BE |
| Manor Farm Oast | TN26 2NE |
| Maple Place | TN26 2BZ |
| Military Road | TN26 2BG |
| Moor Lane | TN26 2BH |
| Prospect Place | TN26 2BL |
| Rye Road | TN26 2DJ |
| School Road | TN26 2BW |
| Snargate Road | TN26 2BT |
| Station Road | TN26 2DE |
| Station Villas | TN26 2DF |
| Tenterden Road | TN26 2AL TN26 2AP |
| The Heath | TN26 2AX |
| The Street | TN26 2AE TN26 2AF TN26 2BU TN26 2BX TN26 2DA TN26 2AD |
| The Wish | TN26 2NB |
| Victoria Terrace | TN26 2AU |
| Warehorne Road | TN26 2LE TN26 2LY |
| TN26 2AJ TN26 2AR TN26 2AS TN26 2BA TN26 2BB TN26 2BJ TN26 2BS TN26 2DB TN26 2LX TN26 2NF TN26 2NH TN26 3TL TN26 2BF TN26 2DP TN26 2DR TN26 2ND |
Transport near Isle Of Oxney
-
Appledore Station
-
Ham Street Station
-
Rye Station
-
Ashford International Station
-
Pluckley Station
-
Winchelsea Station
- FAQ
- Price Paid By Year
- Property Type Price
Frequently asked questions about Isle Of Oxney
What is the average price for a property for sale in Isle Of Oxney?
The average price for a property for sale in Isle Of Oxney is £498,675. This amount is 37% higher than the average price in Ashford. There are 145 property listings for sale in Isle Of Oxney.
What streets have the most expensive properties for sale in Isle Of Oxney?
The streets with the most expensive properties for sale in Isle Of Oxney are Station Villas at an average of £825,000, Appledore Road at an average of £565,000 and Tenterden Road at an average of £535,000.
What streets have the most affordable properties for sale in Isle Of Oxney?
The streets with the most affordable properties for sale in Isle Of Oxney are The Heath at an average of £290,750, Victoria Terrace at an average of £305,000 and Heathside at an average of £308,000.
Which train stations are available in or near Isle Of Oxney?
Some of the train stations available in or near Isle Of Oxney are Appledore, Ham Street and Rye.
Property Price Paid in Isle Of Oxney by Year
The average sold property price by year was:
| Year | Average Sold Price | Price Change |
Sold Properties
|
|---|---|---|---|
| 2025 | £492,961 | -16% |
13 Properties |
| 2024 | £571,444 | 25% |
9 Properties |
| 2023 | £426,093 | -28% |
8 Properties |
| 2022 | £547,000 | -18% |
8 Properties |
| 2021 | £643,679 | 27% |
11 Properties |
| 2020 | £467,347 | 5% |
23 Properties |
| 2019 | £441,725 | -9% |
16 Properties |
| 2018 | £481,190 | -3% |
21 Properties |
| 2017 | £497,545 | 27% |
16 Properties |
| 2016 | £365,583 | 1% |
18 Properties |
| 2015 | £361,347 | 4% |
19 Properties |
| 2014 | £345,394 | 12% |
19 Properties |
| 2013 | £305,246 | 9% |
16 Properties |
| 2012 | £278,937 | -16% |
8 Properties |
| 2011 | £322,900 | -22% |
10 Properties |
| 2010 | £393,153 | 24% |
13 Properties |
| 2009 | £298,916 | -31% |
12 Properties |
| 2008 | £390,258 | 2% |
17 Properties |
| 2007 | £383,559 | 12% |
16 Properties |
| 2006 | £337,558 | 29% |
17 Properties |
| 2005 | £239,541 | -36% |
23 Properties |
| 2004 | £326,828 | 3% |
14 Properties |
| 2003 | £317,467 | 20% |
17 Properties |
| 2002 | £254,170 | 39% |
23 Properties |
| 2001 | £156,295 | -10% |
21 Properties |
| 2000 | £171,374 | 21% |
12 Properties |
| 1999 | £135,496 | -2% |
16 Properties |
| 1998 | £138,000 | 21% |
6 Properties |
| 1997 | £109,671 | 0,2% |
19 Properties |
| 1996 | £109,455 | 14% |
17 Properties |
| 1995 | £93,957 | - |
13 Properties |
Property Price per Property Type in Isle Of Oxney
Here you can find historic sold price data in order to help with your property search.
The average Property Paid Price for specific property types in the last three years are:
| Property Type | Average Sold Price | Sold Properties |
|---|---|---|
| Semi Detached House | £362,125.00 | 12 Semi Detached Houses |
| Detached House | £698,145.00 | 12 Detached Houses |
| Terraced House | £372,833.00 | 6 Terraced Houses |

