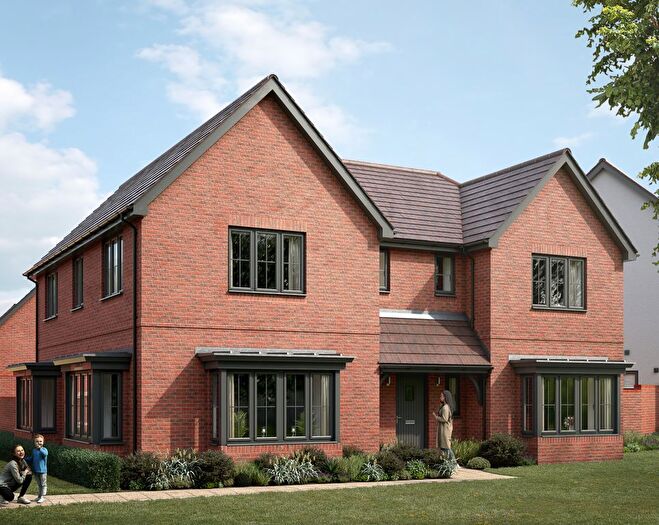
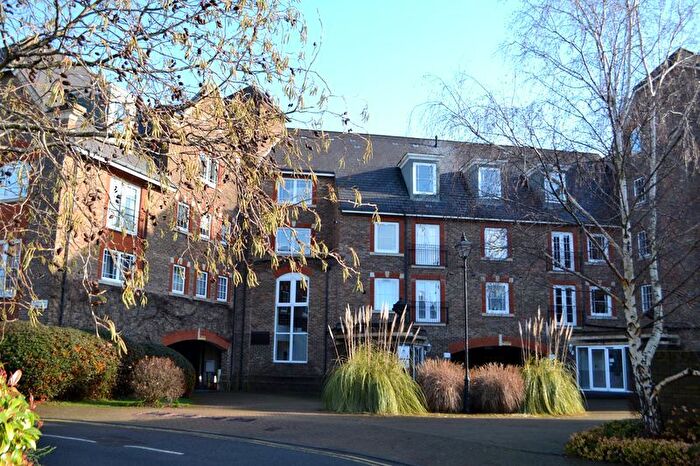
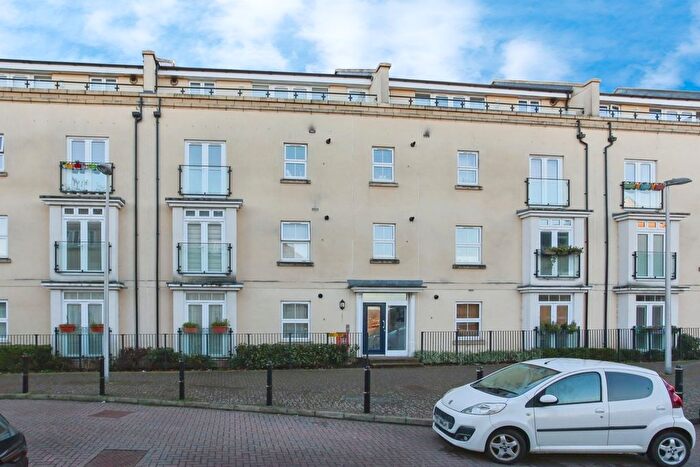
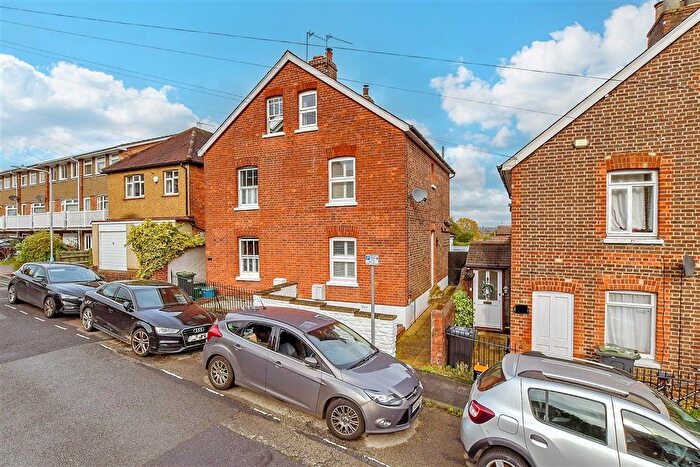
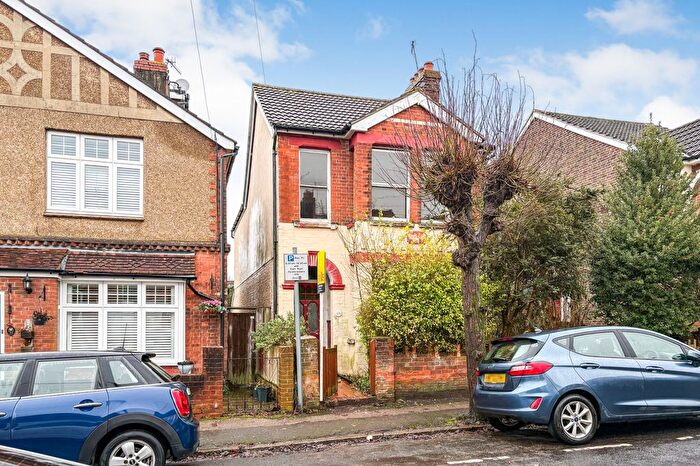
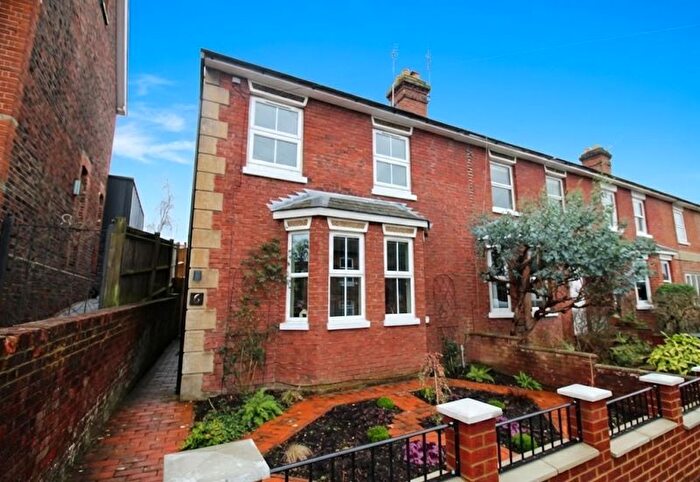
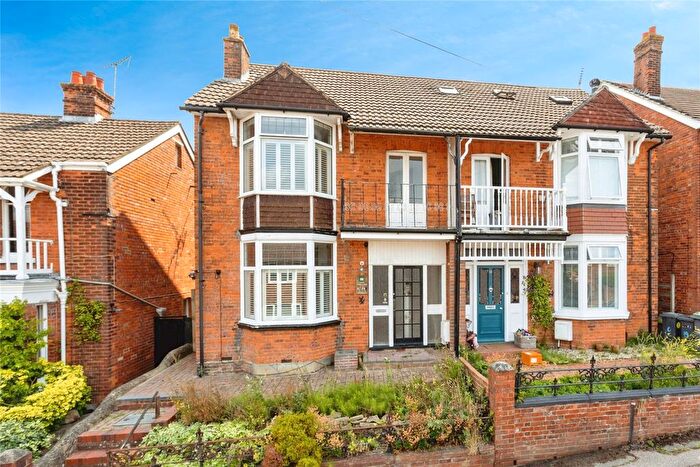
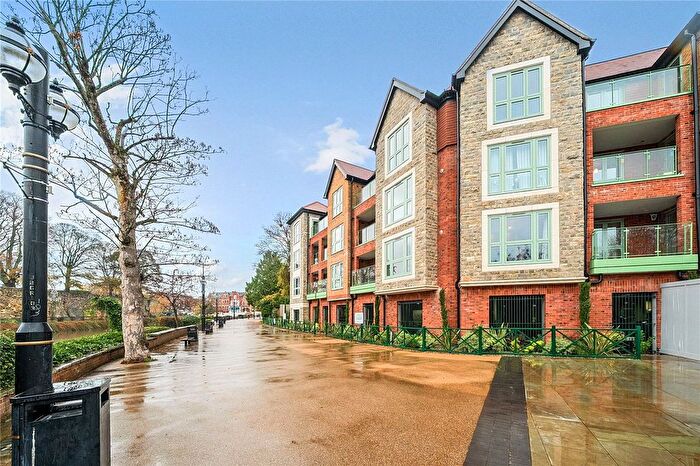
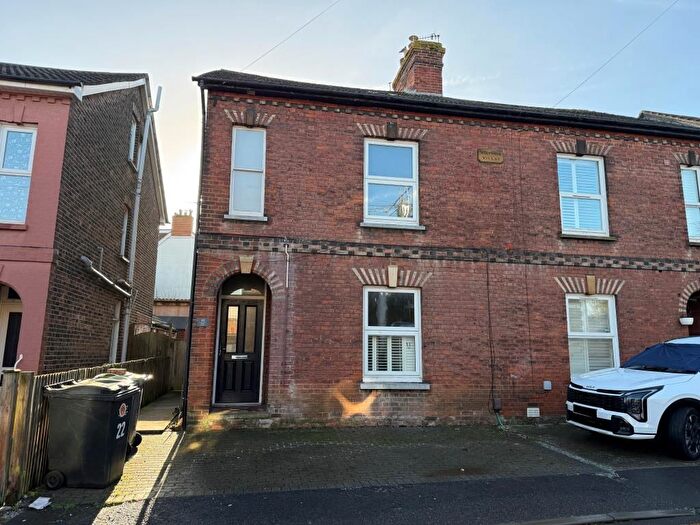
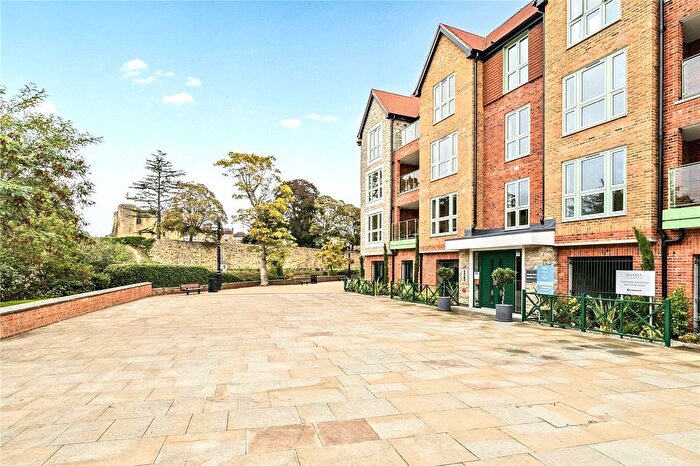
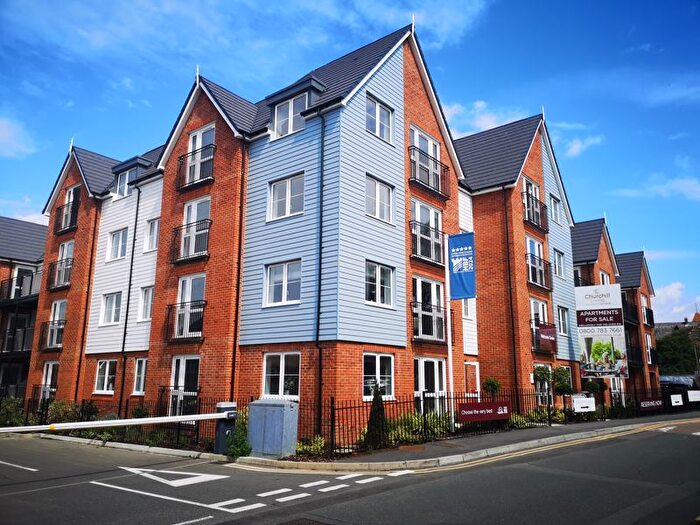
Houses for sale & to rent in Vauxhall, Tonbridge
House Prices in Vauxhall
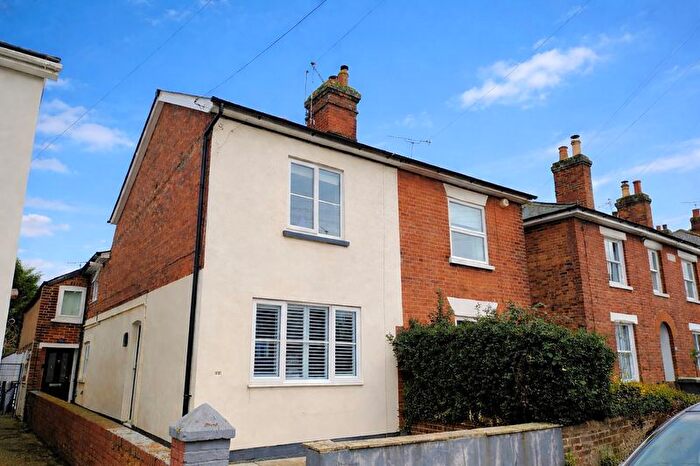
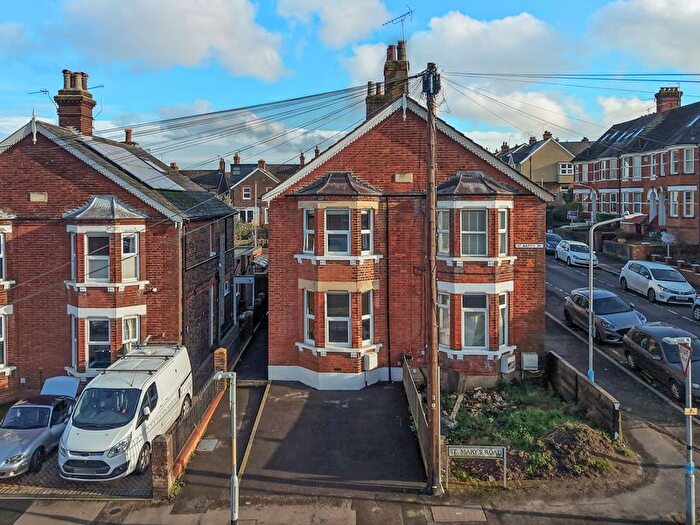
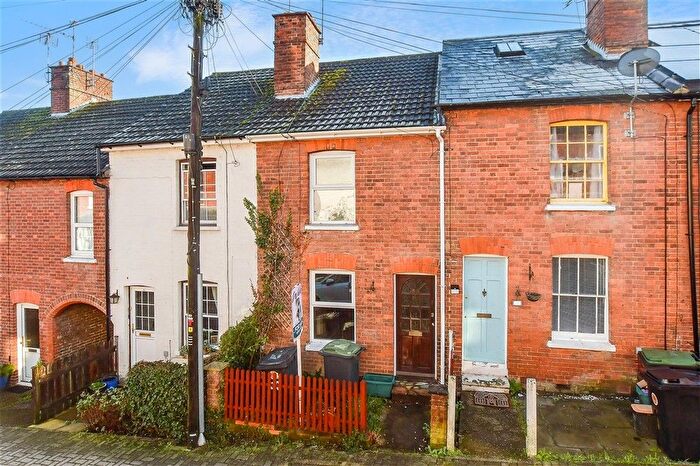
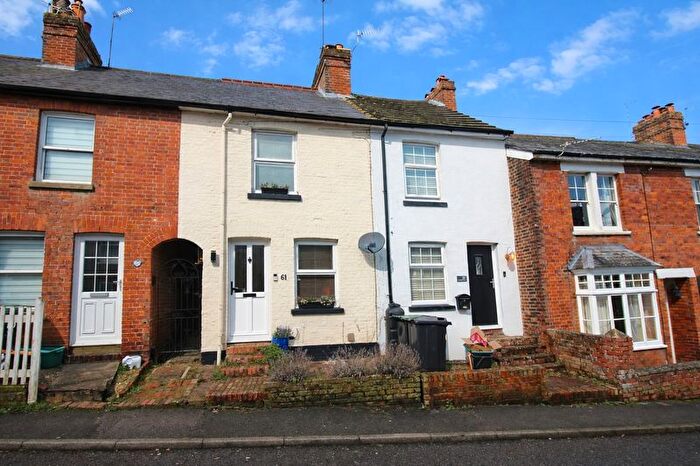
Properties in Vauxhall have an average house price of £446,379.00 and had 246 Property Transactions within the last 3 years¹.
Vauxhall is an area in Tonbridge, Kent with 2,015 households², where the most expensive property was sold for £1,160,000.00.
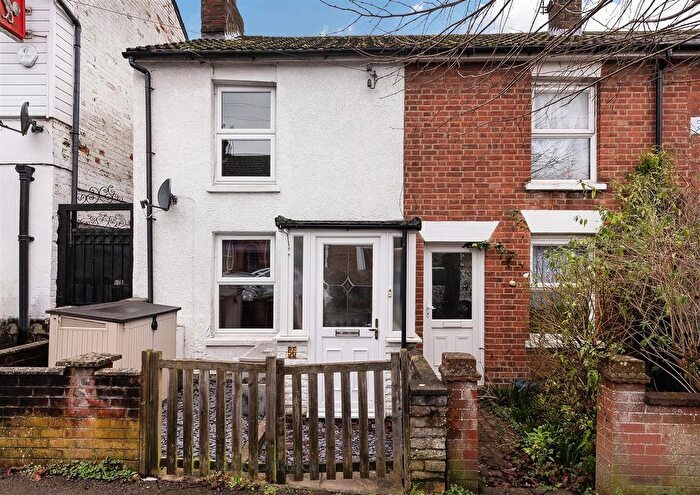
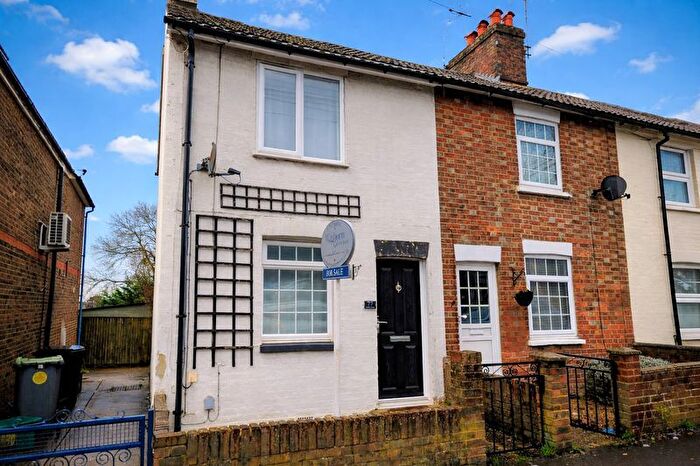
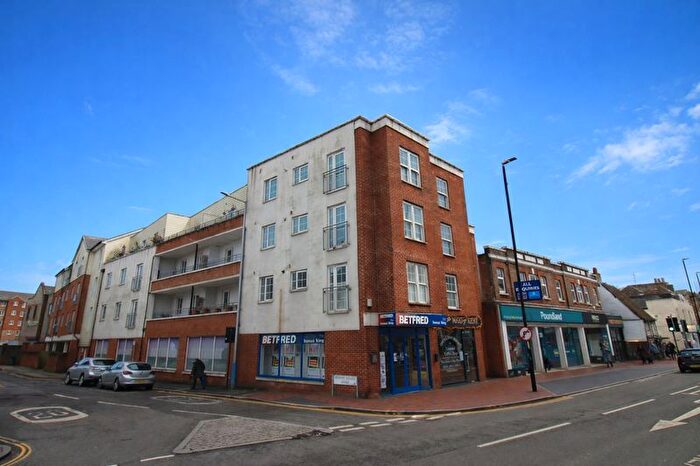
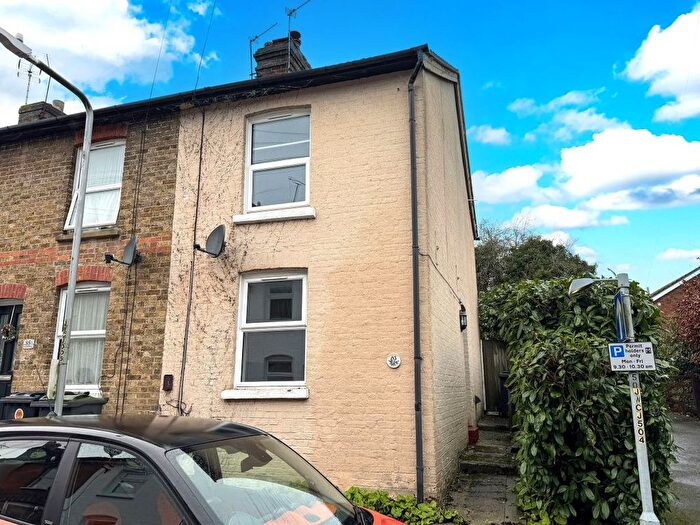
Properties for sale in Vauxhall
Previously listed properties in Vauxhall
Roads and Postcodes in Vauxhall
Navigate through our locations to find the location of your next house in Vauxhall, Tonbridge for sale or to rent.
| Streets | Postcodes |
|---|---|
| Alexandra Road | TN9 2AA TN9 2BD |
| Baltic Road | TN9 2LT TN9 2LU TN9 2LX TN9 2LY TN9 2LZ TN9 2NB |
| Bishops Mews | TN9 2BA |
| Brickworks Close | TN9 2US |
| Challis Close | TN9 2FA |
| Commercial Road | TN9 2AR |
| Cowdreys | TN9 2JD |
| Deakin Leas | TN9 2JS TN9 2JT TN9 2JU TN9 2JX TN9 2JY TN9 2JR |
| Deans Court | TN9 2XA |
| Drayton Road | TN9 2BE TN9 2BG |
| Fairview Close | TN9 2UU |
| Fosse Bank Close | TN9 2NX |
| Gardyne Mews | TN9 2LW |
| George Street | TN9 2SE |
| Hill Top | TN9 2UL TN9 2UN TN9 2UP TN9 2UW |
| Judd Road | TN9 2NH TN9 2NJ |
| Lambs Bank | TN9 2UZ |
| Lavender Hill | TN9 2AT TN9 2AU TN9 2AX TN9 2AY |
| Lavender Mews | TN9 2FD |
| Magnolia Close | TN9 2JH |
| Monks Walk | TN9 2XB |
| Parsons Place | TN9 2GA |
| Pembury Grove | TN9 2BH |
| Pembury Road | TN9 2HX TN9 2JB TN9 2JE TN9 2JF TN9 2JG TN9 2JL TN9 2JQ TN9 2JZ TN9 2HS TN9 2HU TN9 2JA |
| Priory Grove | TN9 2AJ |
| Priory Road | TN9 2AQ TN9 2AS TN9 2EF TN9 2BB |
| Priory Street | TN9 2AN TN9 2AP TN9 2AW TN9 2AH TN9 2AZ |
| Priory Walk | TN9 2AL |
| Quarry Bank | TN9 2QZ |
| Quarry Hill Parade | TN9 2HR |
| Quarry Hill Road | TN9 2NU TN9 2PE TN9 2RS TN9 2RT TN9 2SA |
| Quarry Rise | TN9 2PQ |
| Silver Close | TN9 2UX TN9 2UY |
| Springwell Road | TN9 2LH TN9 2LJ TN9 2LL TN9 2LN |
| St Georges Mews | TN9 2SF |
| St Marys Road | TN9 2LD TN9 2LE TN9 2NL TN9 2NN TN9 2LB |
| St Stephens Street | TN9 2AB TN9 2AD |
| Taylor Close | TN9 2FE |
| The Birches | TN9 2UR |
| The Drive | TN9 2LP TN9 2LR TN9 2LS |
| The Lowry | TN9 2RF |
| Tonbridge Chambers | TN9 2HZ |
| Treetops | TN9 2UT |
| Vauxhall Lane | TN11 0NE TN11 0NQ TN11 0NF |
| Waterloo Place | TN9 2SD |
| Weald View Road | TN9 2NG TN9 2NQ |
| White Oak Close | TN9 2NP |
| Woodfield Road | TN9 2LG TN9 2LQ |
| Woodlands Road | TN9 2NE |
| Woodside Road | TN9 2PB TN9 2PD |
Transport near Vauxhall
- FAQ
- Price Paid By Year
- Property Type Price
Frequently asked questions about Vauxhall
What is the average price for a property for sale in Vauxhall?
The average price for a property for sale in Vauxhall is £446,379. This amount is 8% lower than the average price in Tonbridge. There are 1,226 property listings for sale in Vauxhall.
What streets have the most expensive properties for sale in Vauxhall?
The streets with the most expensive properties for sale in Vauxhall are Fosse Bank Close at an average of £1,020,000, Quarry Bank at an average of £886,250 and The Drive at an average of £721,861.
What streets have the most affordable properties for sale in Vauxhall?
The streets with the most affordable properties for sale in Vauxhall are Gardyne Mews at an average of £180,000, White Oak Close at an average of £252,500 and Quarry Hill Road at an average of £278,750.
Which train stations are available in or near Vauxhall?
Some of the train stations available in or near Vauxhall are Tonbridge, High Brooms and Leigh (Kent).
Property Price Paid in Vauxhall by Year
The average sold property price by year was:
| Year | Average Sold Price | Price Change |
Sold Properties
|
|---|---|---|---|
| 2025 | £467,756 | 3% |
74 Properties |
| 2024 | £452,017 | 8% |
100 Properties |
| 2023 | £416,578 | 0,5% |
72 Properties |
| 2022 | £414,694 | -11% |
98 Properties |
| 2021 | £459,863 | 15% |
112 Properties |
| 2020 | £391,161 | -5% |
68 Properties |
| 2019 | £409,688 | 15% |
97 Properties |
| 2018 | £347,555 | -11% |
107 Properties |
| 2017 | £387,345 | 8% |
94 Properties |
| 2016 | £356,628 | 10% |
108 Properties |
| 2015 | £321,321 | -3% |
116 Properties |
| 2014 | £329,551 | 19% |
145 Properties |
| 2013 | £267,535 | 1% |
114 Properties |
| 2012 | £263,987 | -6% |
74 Properties |
| 2011 | £280,527 | 8% |
87 Properties |
| 2010 | £257,153 | 4% |
93 Properties |
| 2009 | £246,077 | 3% |
71 Properties |
| 2008 | £239,092 | -6% |
73 Properties |
| 2007 | £252,442 | 10% |
130 Properties |
| 2006 | £227,386 | 8% |
119 Properties |
| 2005 | £208,594 | 3% |
108 Properties |
| 2004 | £201,568 | 9% |
127 Properties |
| 2003 | £183,436 | 13% |
125 Properties |
| 2002 | £158,722 | 10% |
111 Properties |
| 2001 | £142,829 | 25% |
122 Properties |
| 2000 | £107,082 | 2% |
96 Properties |
| 1999 | £104,470 | 19% |
99 Properties |
| 1998 | £84,241 | -13% |
116 Properties |
| 1997 | £95,088 | -10% |
135 Properties |
| 1996 | £104,803 | 39% |
116 Properties |
| 1995 | £64,313 | - |
103 Properties |
Property Price per Property Type in Vauxhall
Here you can find historic sold price data in order to help with your property search.
The average Property Paid Price for specific property types in the last three years are:
| Property Type | Average Sold Price | Sold Properties |
|---|---|---|
| Semi Detached House | £540,300.00 | 78 Semi Detached Houses |
| Detached House | £800,700.00 | 21 Detached Houses |
| Terraced House | £363,205.00 | 115 Terraced Houses |
| Flat | £283,831.00 | 32 Flats |

