
Houses for sale & to rent in TN9 2JH, Magnolia Close, Vauxhall, Tonbridge
House Prices in TN9 2JH, Magnolia Close, Vauxhall
Properties in TN9 2JH have no sales history available within the last 3 years. TN9 2JH is a postcode in Magnolia Close located in Vauxhall, an area in Tonbridge, Kent, with 3 households².
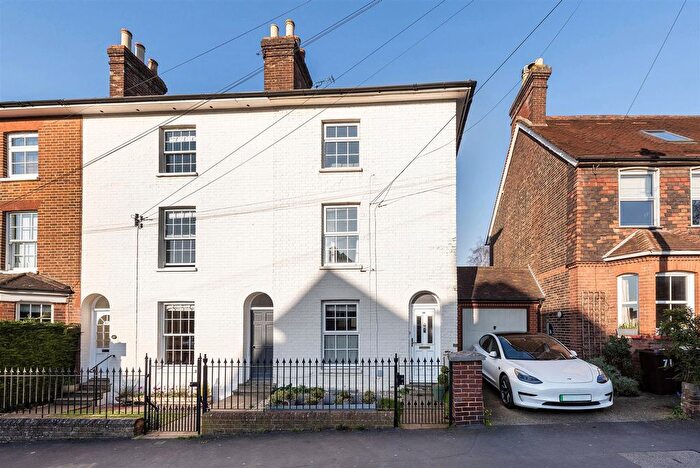
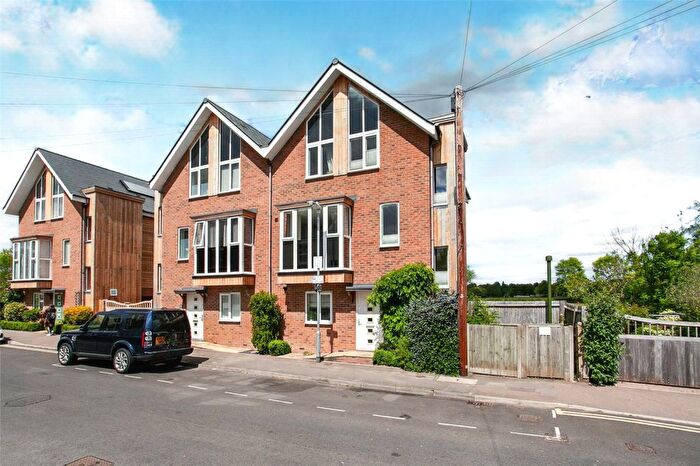
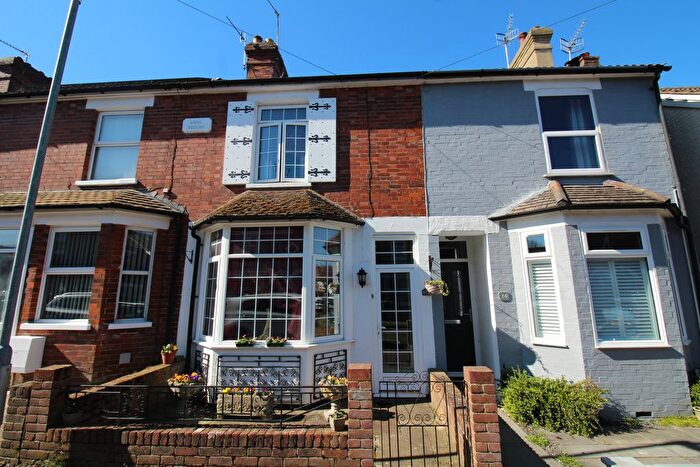
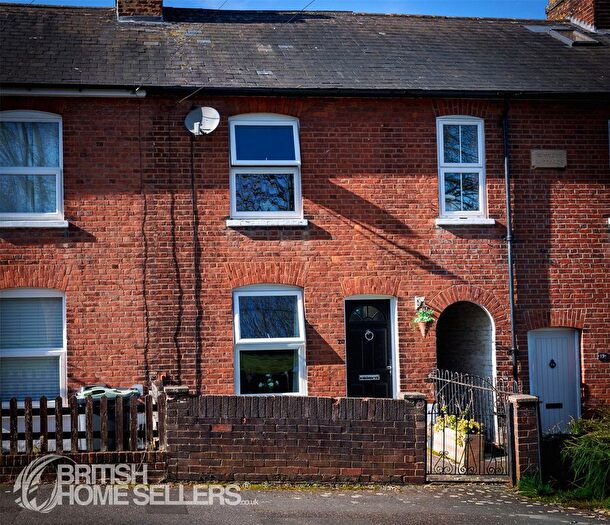
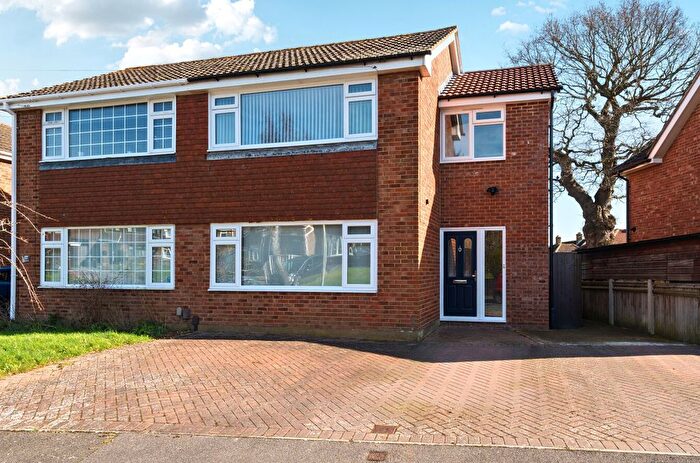
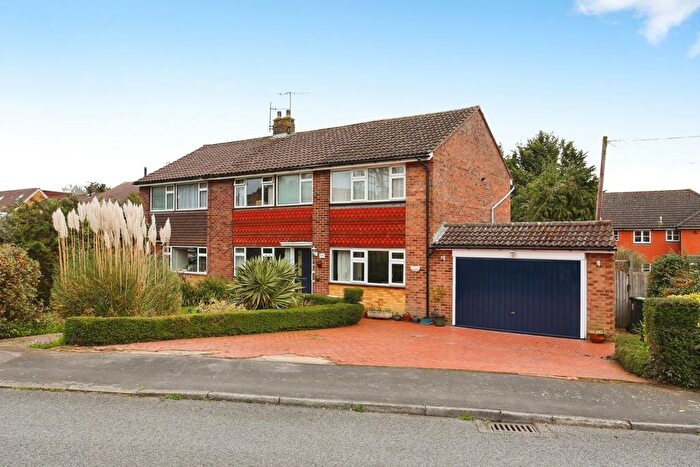
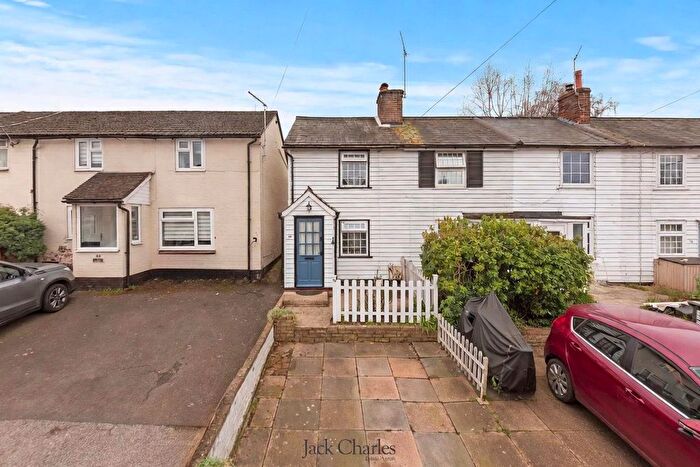
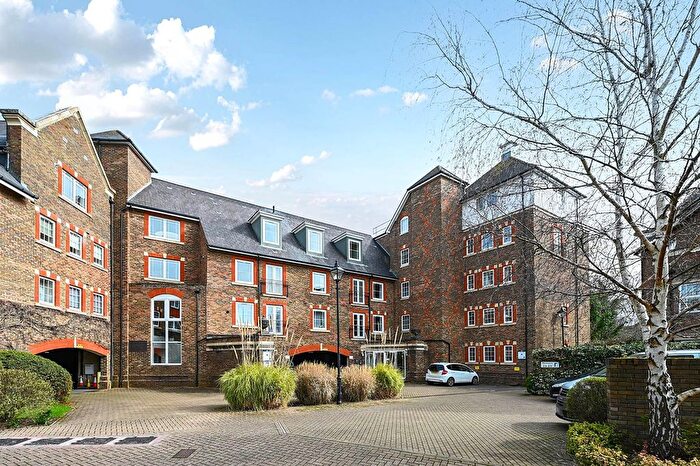
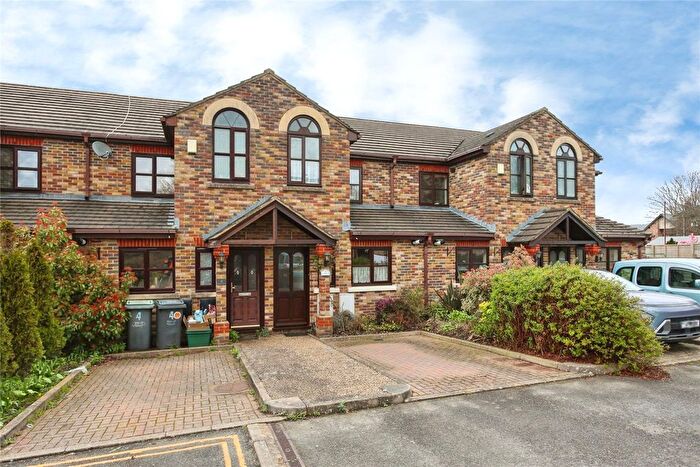
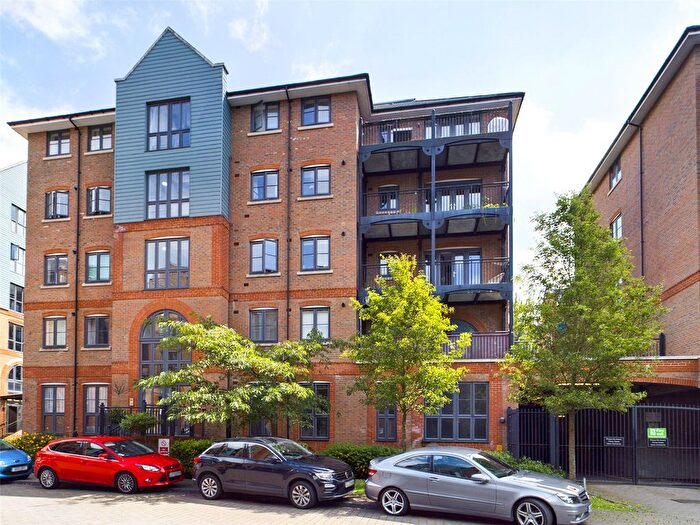
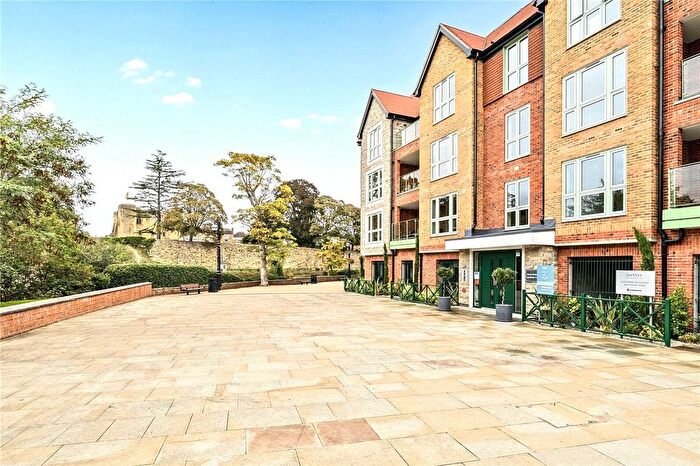
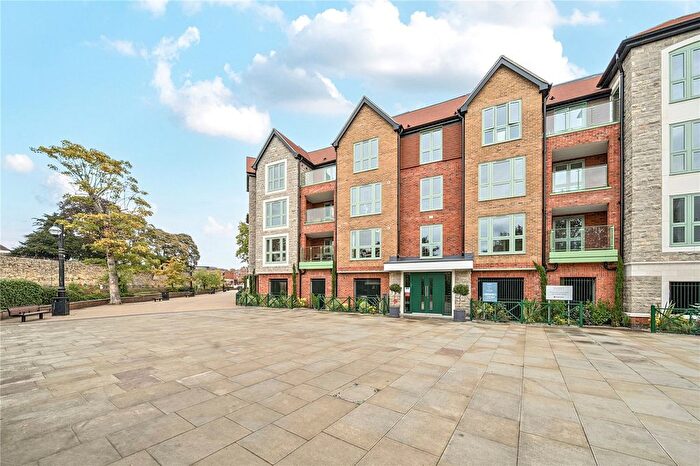
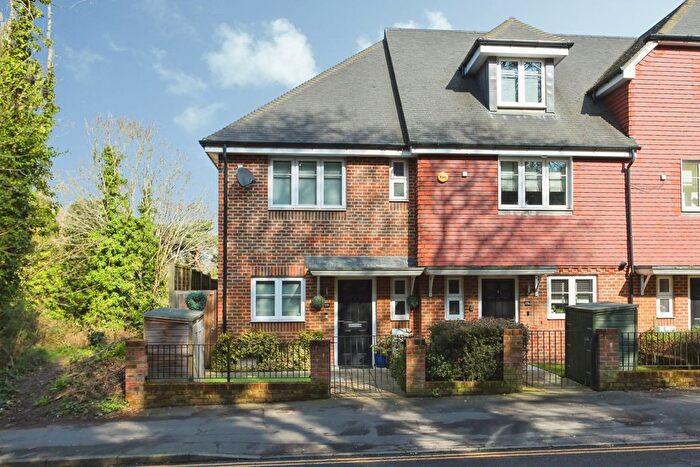
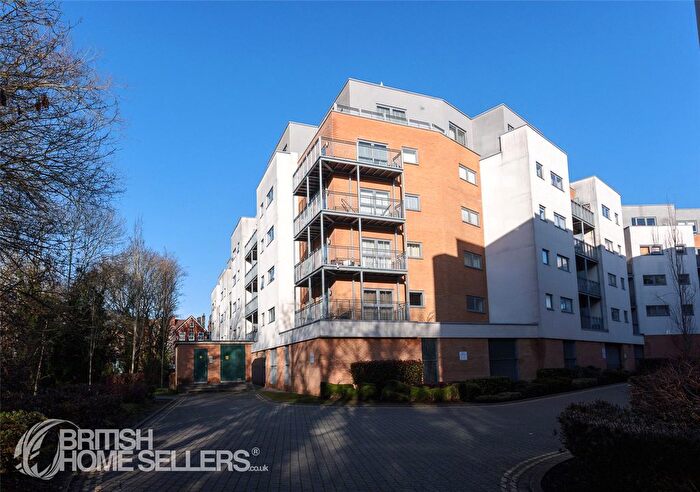
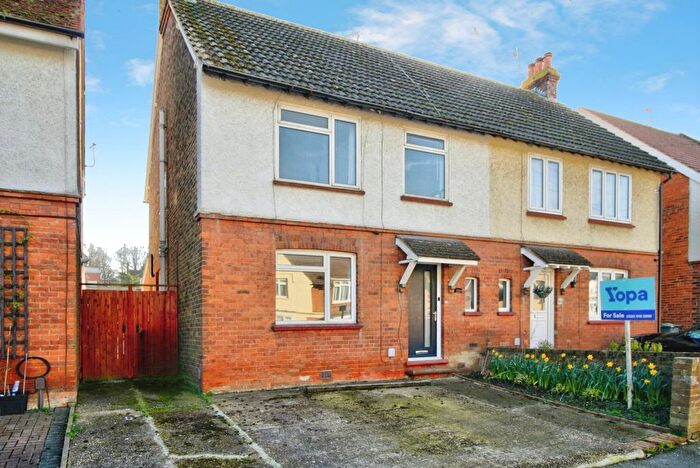
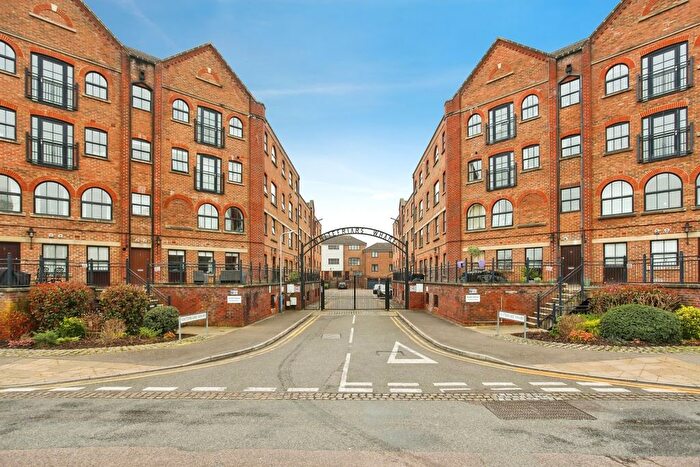
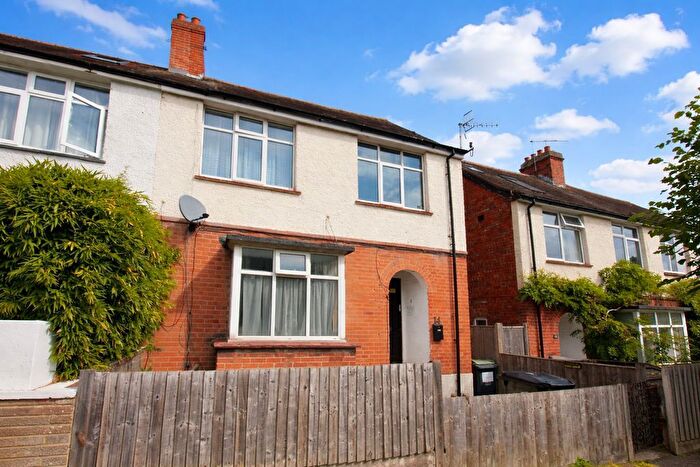
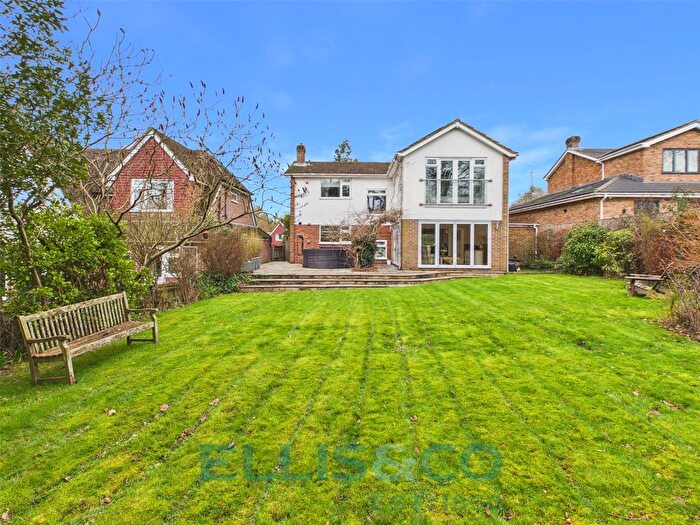
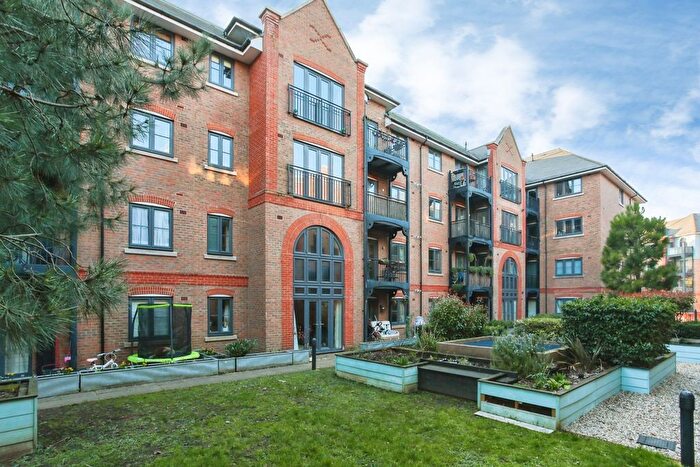
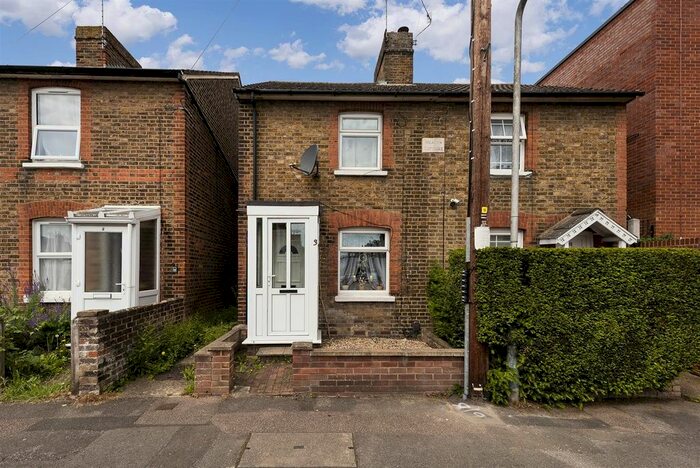
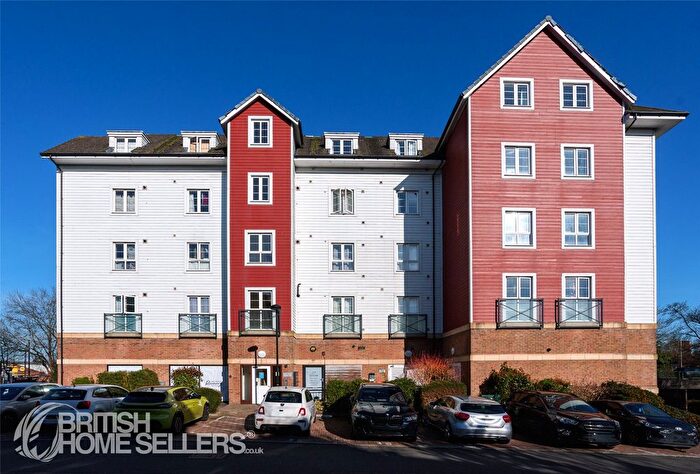
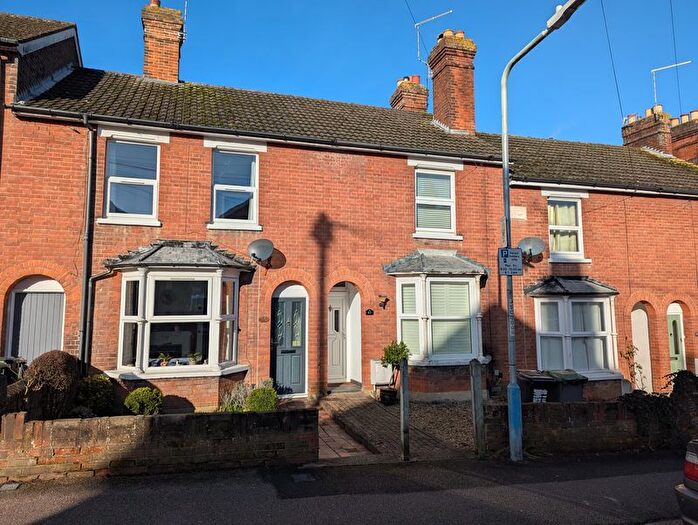
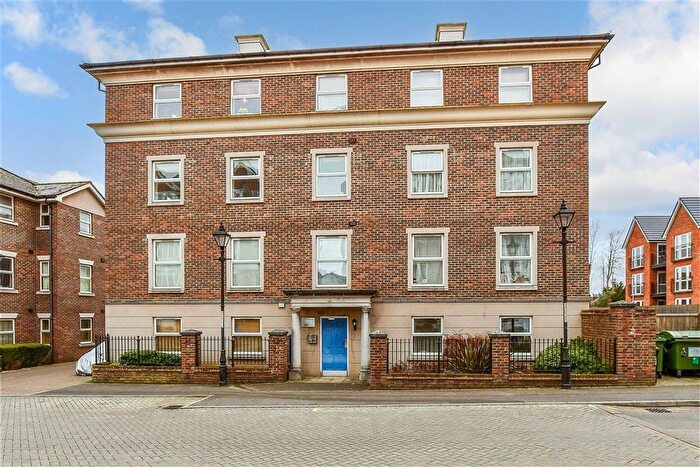
Properties for sale near TN9 2JH, Magnolia Close
![]()
If you are looking to sell your house, let it out, or receive a property valuation, an expert can help you.
Click the button below to get started.

Price Paid in Magnolia Close, TN9 2JH, Vauxhall
3 Magnolia Close, TN9 2JH, Vauxhall Tonbridge
Property 3 has been sold 2 times. The last time it was sold was in 01/03/2022 and the sold price was £741,000.00.
This semi detached house, sold as a freehold on 01/03/2022, is a 178 sqm detached house with an EPC rating of D.
| Date | Price | Property Type | Tenure | Classification |
|---|---|---|---|---|
| 01/03/2022 | £741,000.00 | Semi Detached House | freehold | Established Building |
| 20/01/2006 | £366,000.00 | Semi Detached House | freehold | Established Building |
2 Magnolia Close, TN9 2JH, Vauxhall Tonbridge
Property 2 has been sold 1 time. The last time it was sold was in 31/08/2021 and the sold price was £582,000.00.
This semi detached house, sold as a freehold on 31/08/2021, is a 79 sqm semi-detached house with an EPC rating of E.
| Date | Price | Property Type | Tenure | Classification |
|---|---|---|---|---|
| 31/08/2021 | £582,000.00 | Semi Detached House | freehold | Established Building |
1 Magnolia Close, TN9 2JH, Vauxhall Tonbridge
Property 1 has been sold 1 time. The last time it was sold was in 04/09/2000 and the sold price was £80,000.00.
This is a Semi Detached House which was sold as a freehold in 04/09/2000
| Date | Price | Property Type | Tenure | Classification |
|---|---|---|---|---|
| 04/09/2000 | £80,000.00 | Semi Detached House | freehold | Established Building |
Transport near TN9 2JH, Magnolia Close

House price paid reports for TN9 2JH, Magnolia Close
Click on the buttons below to see price paid reports by year or property price:
- Price Paid By Year
Property Price Paid in TN9 2JH, Magnolia Close by Year
The average sold property price by year was:
| Year | Average Sold Price | Price Change |
Sold Properties
|
|---|---|---|---|
| 2022 | £741,000 | 21% |
1 Property |
| 2021 | £582,000 | 37% |
1 Property |
| 2006 | £366,000 | 78% |
1 Property |
| 2000 | £80,000 | - |
1 Property |