
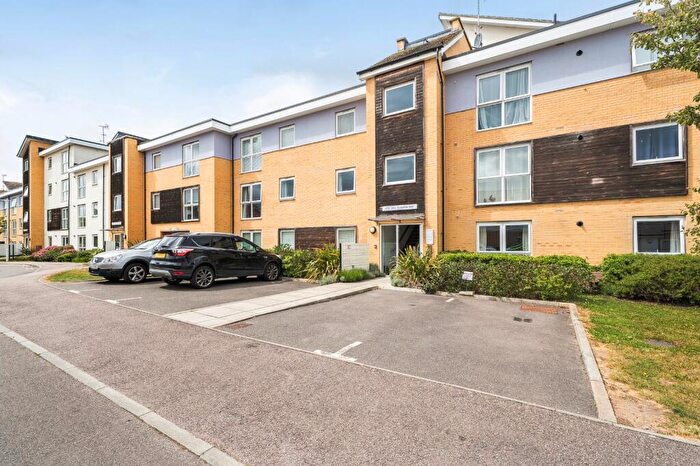
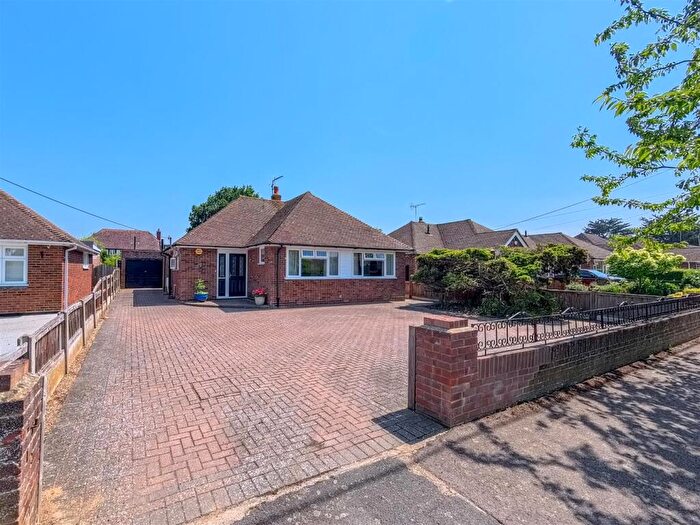
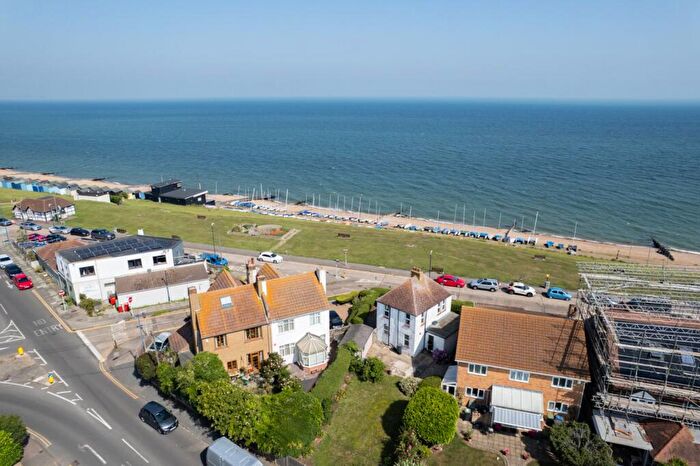
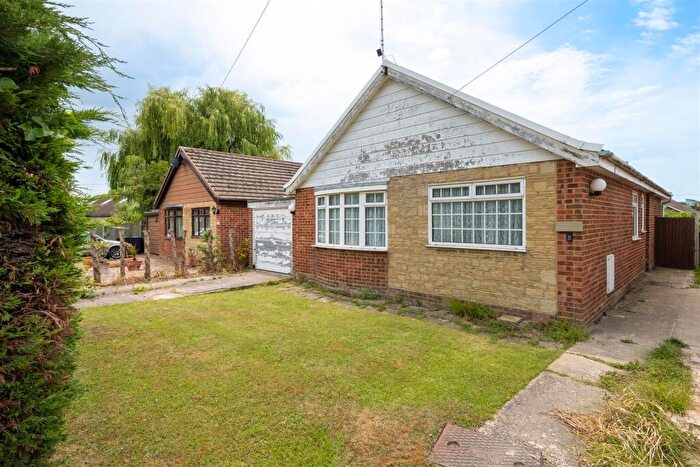
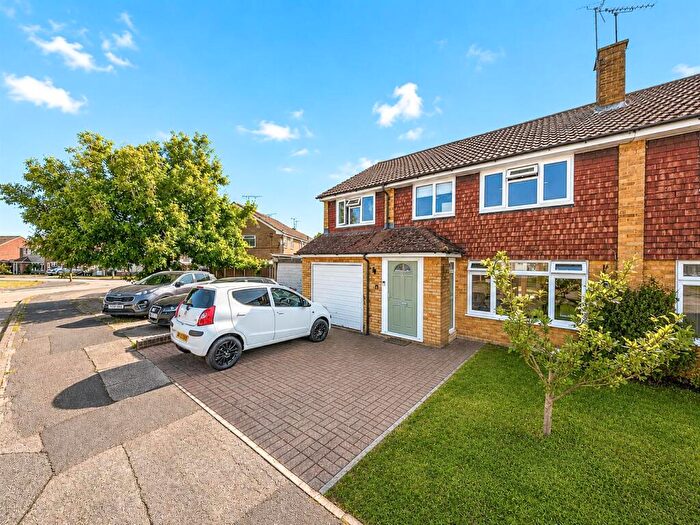
Houses for sale in Chestfield, Whitstable
House Prices in Chestfield
Properties in Chestfield have an average house price of £212k and had 22 Property Transactions within the last 3 years¹.
Chestfield is an area in Whitstable, Kent with 94 households², where the most expensive property was sold for £560k.
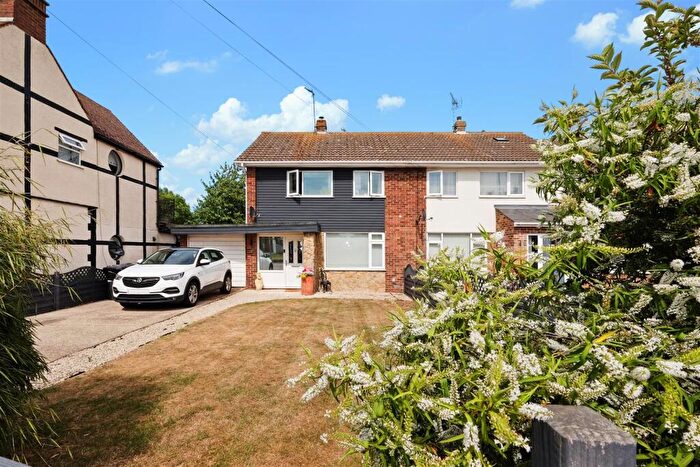
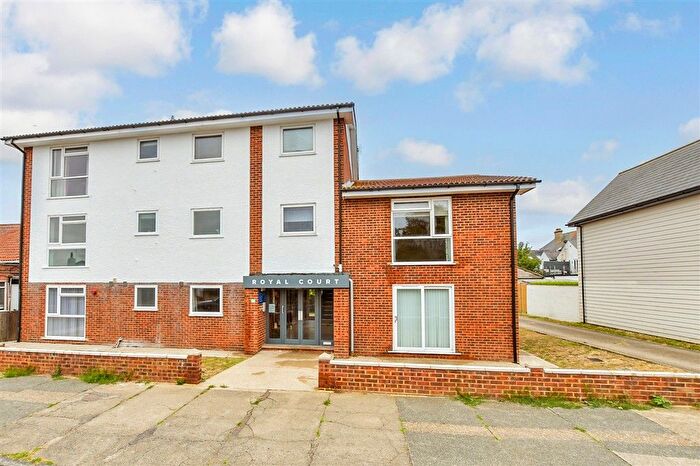
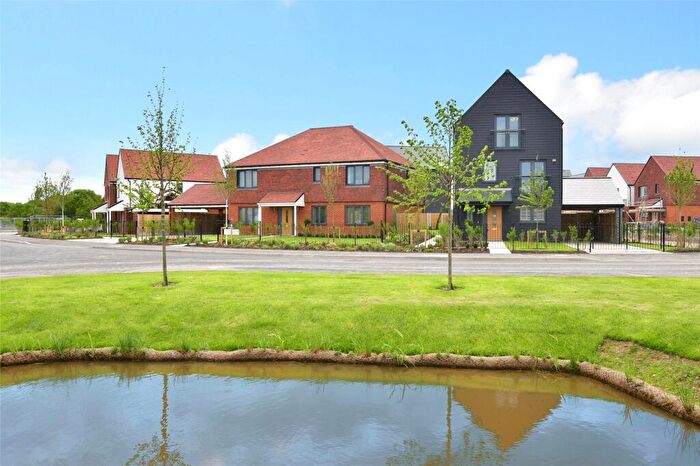
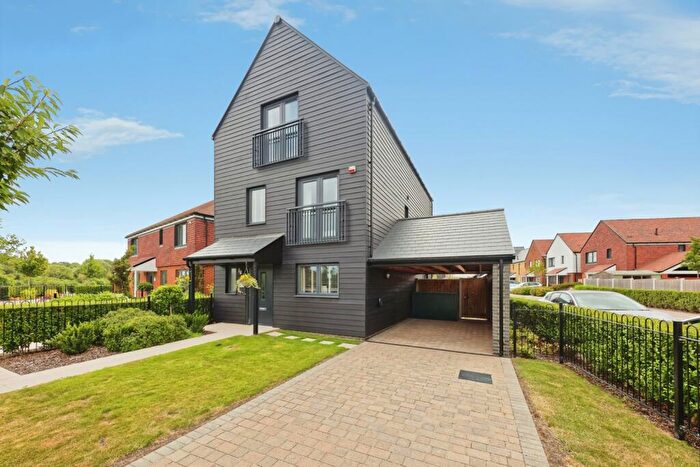
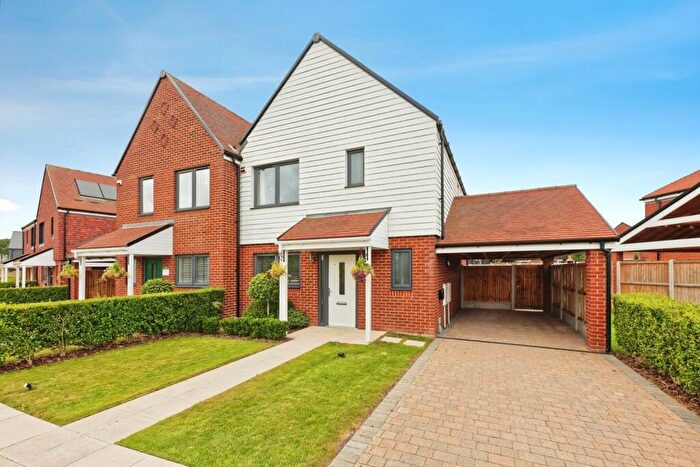
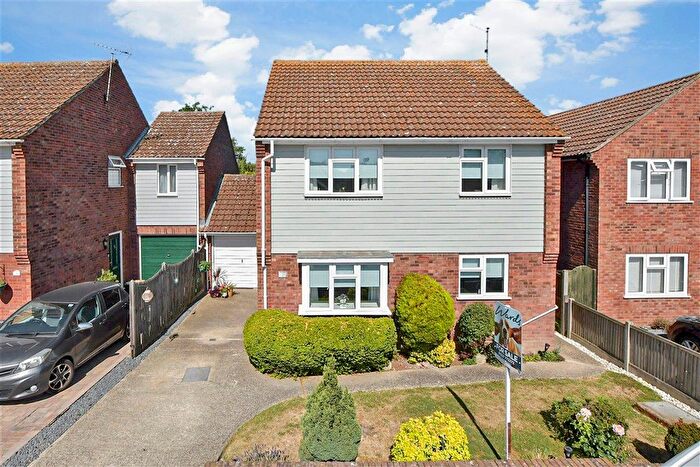
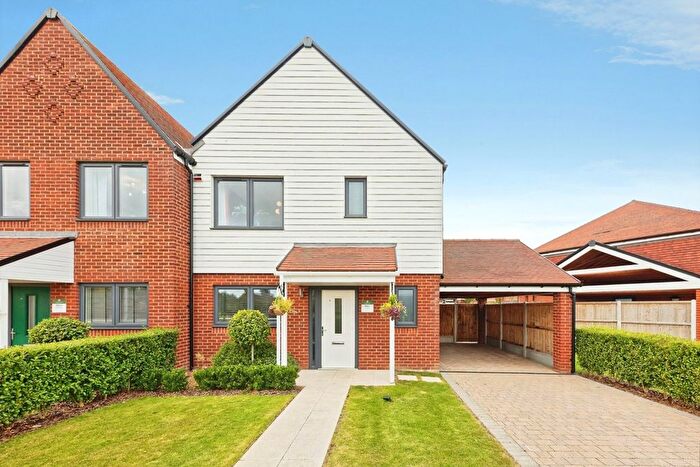
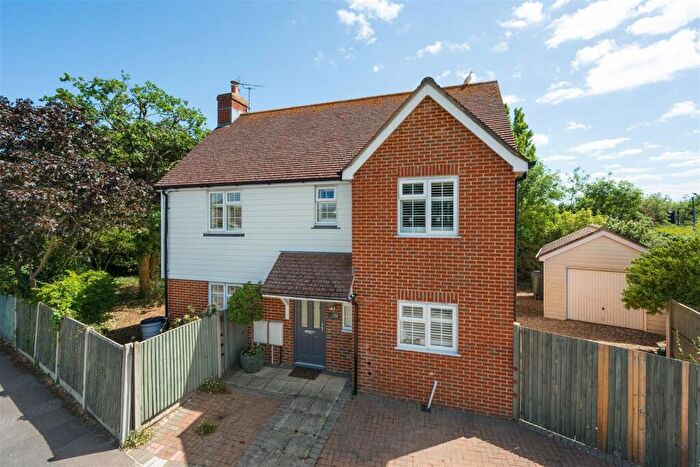
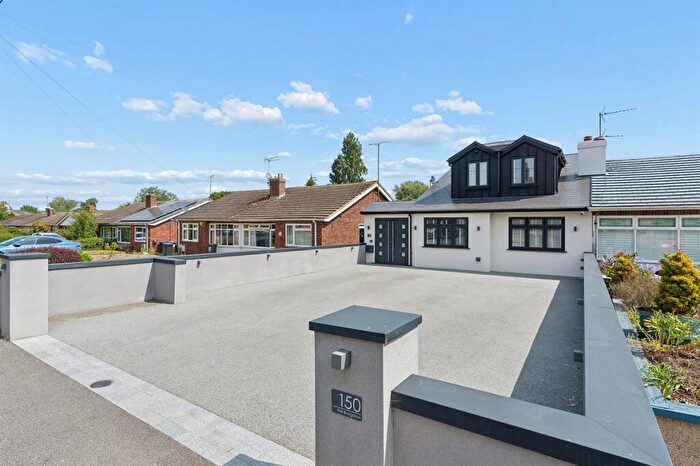
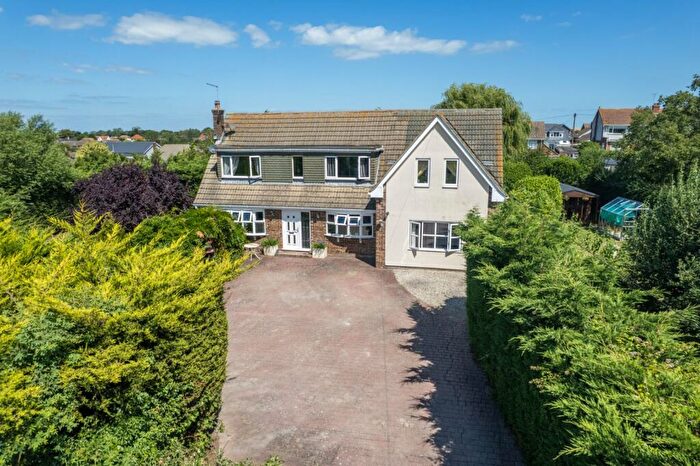
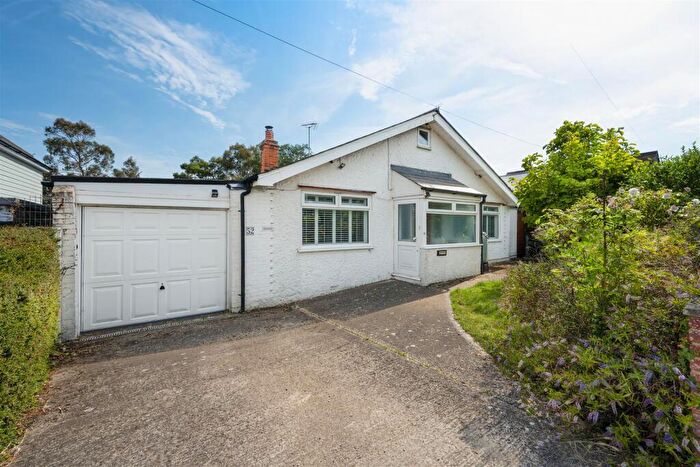
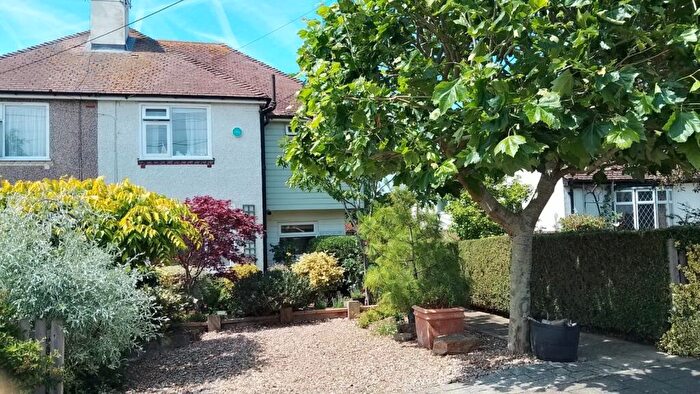
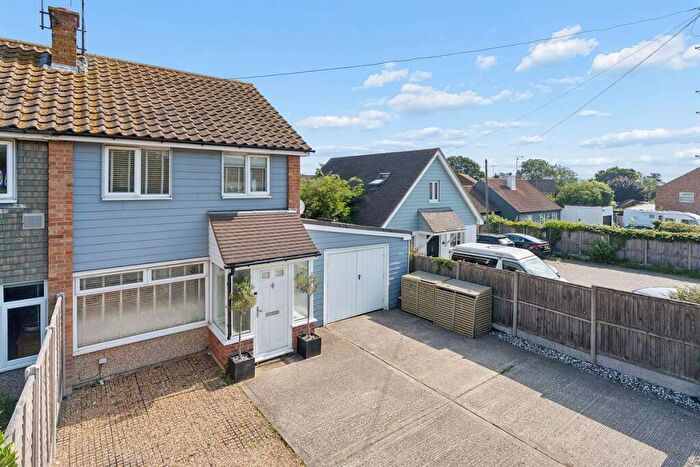
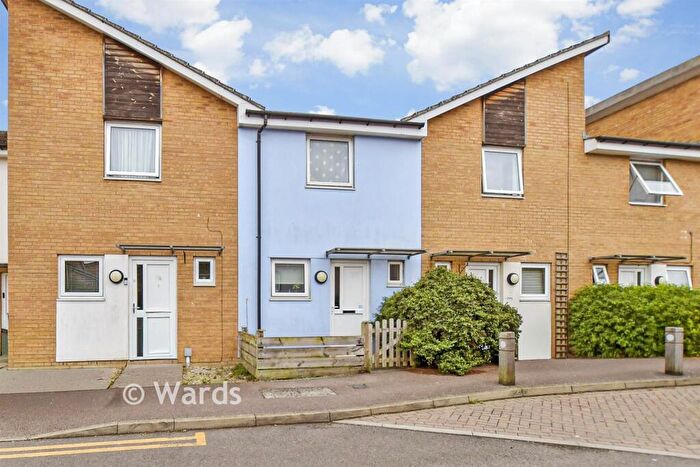
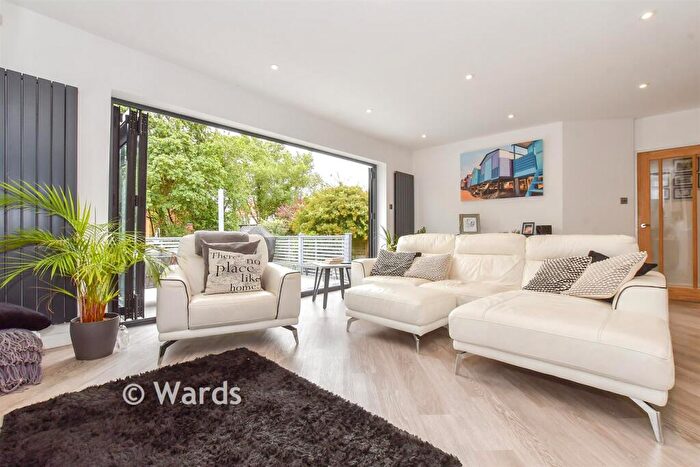
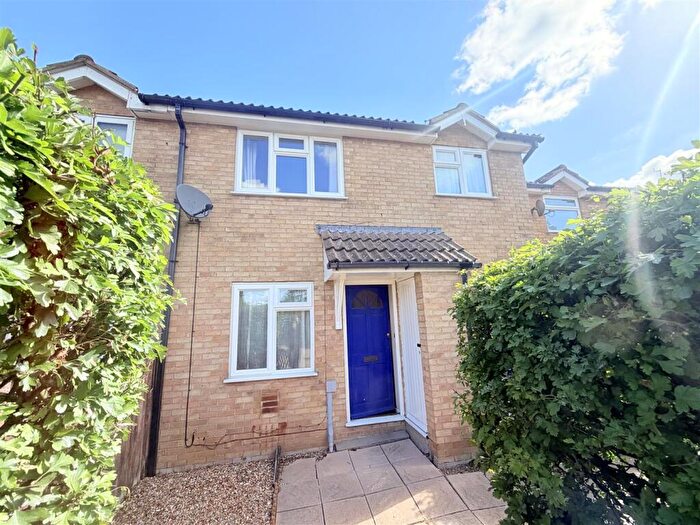
Properties for sale in Chestfield
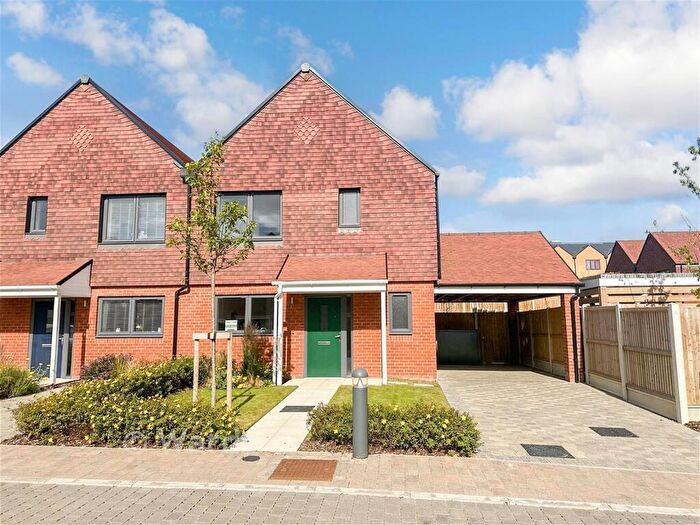
![]()
If you are looking to sell your house, let it out, or receive a property valuation, an expert can help you.
Click the button below to get started.


Roads and Postcodes in Chestfield
Navigate through our locations to find the location of your next house in Chestfield, Whitstable for sale or to rent.
| Streets | Postcodes |
|---|---|
| Barley Drive | CT5 3PT |
| Bermuda Road | CT5 3RX |
| John Wilson Business Park | CT5 3QJ CT5 3QP CT5 3QT CT5 3QX CT5 3QY CT5 3QZ CT5 3RA CT5 3RB |
| Joseph Wilson Industrial Estate | CT5 3FU |
| Millstrood Road | CT5 3EE CT5 3SN |
| Molehill Road | CT5 3PX |
| Nassella Gardens | CT5 3RU |
| Olympia Way | CT5 3FP |
| Reeves Way | CT5 3QS CT5 3QU CT5 3SS |
| Saltings Close | CT5 3FQ |
| Shepherds Way | CT5 3LZ |
| South Street | CT5 3DU |
| Thanet Way | CT5 3JF CT5 3JQ CT5 3SB CT5 3JE |
| The Crescent | CT5 3ED |
Property price trends in Chestfield
According to the latest Land Registry data, the average home in Chestfield sold for £182,500 in 2026. That figure comes from 187 sales logged over the past 23 years.
Prices have fallen back over the last three years. Compared with 2023, when the typical sale came in around £198,500, that's a fall of roughly 8.1%.
Looking back five years, average prices are down about 1% since 2021, a drop of around £1,875 in cash terms.
Zoom out to the past decade for the fuller picture. Back in 2016, homes here averaged £199,599, so the typical sold price has fallen about 8.6% since then, around 0.9% a year lower. Stretch the view to fifteen years and that annual pace edges up closer to 2.9%.
Frequently asked questions about Chestfield
What is the average price for a property for sale in Chestfield?
The average price for a property for sale in Chestfield is £211,954. This amount is 54% lower than the average price in Whitstable. There are 1,444 property listings for sale in Chestfield.
What streets have the most expensive properties for sale in Chestfield?
The street with the most expensive properties for sale in Chestfield is The Crescent at an average of £560,000.
What streets have the most affordable properties for sale in Chestfield?
The street with the most affordable properties for sale in Chestfield is Olympia Way at an average of £195,380.
Which train stations are available in or near Chestfield?
Some of the train stations available in or near Chestfield are Chestfield and Swalecliffe, Whitstable and Herne Bay.
Property Price Paid in Chestfield by Year
The average sold property price by year was:
| Year | Average Sold Price | Price Change |
Sold Properties
|
|---|---|---|---|
| 2026 | £182,500 | -6% |
1 Property |
| 2025 | £193,714 | -25% |
7 Properties |
| 2024 | £241,687 | 18% |
8 Properties |
| 2023 | £198,500 | -4% |
6 Properties |
| 2022 | £206,375 | 11% |
8 Properties |
| 2021 | £184,375 | -16% |
8 Properties |
| 2020 | £213,200 | 14% |
5 Properties |
| 2019 | £182,480 | 1% |
13 Properties |
| 2018 | £180,600 | -0,2% |
10 Properties |
| 2017 | £180,900 | -10% |
15 Properties |
Property Price per Property Type in Chestfield
Here you can find historic sold price data in order to help with your property search.
The average Property Paid Price for specific property types in the last three years are:
| Property Type | Average Sold Price | Sold Properties |
|---|---|---|
| Flat | £195,380.00 | 21 Flats |
| Detached House | £560,000.00 | 1 Detached House |
