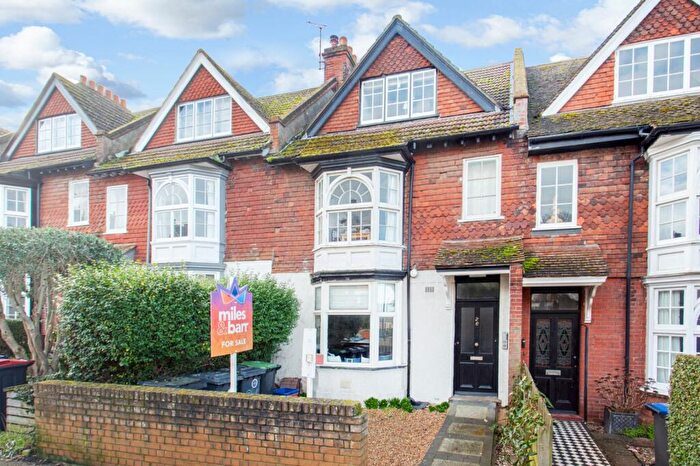
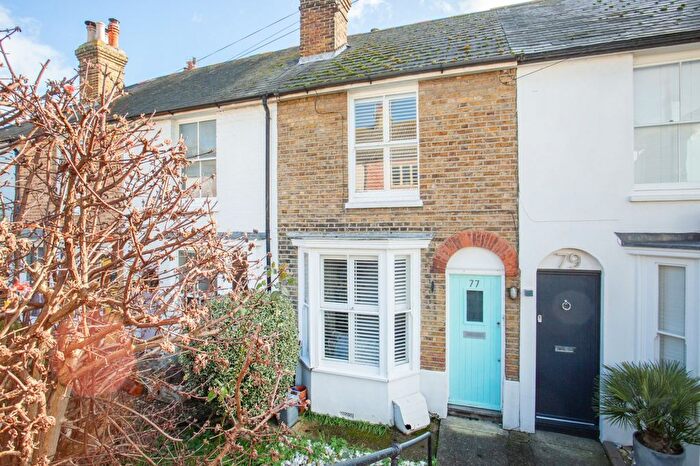
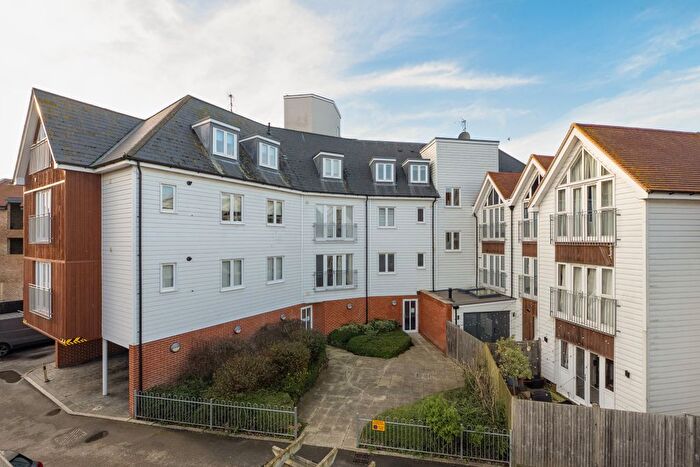
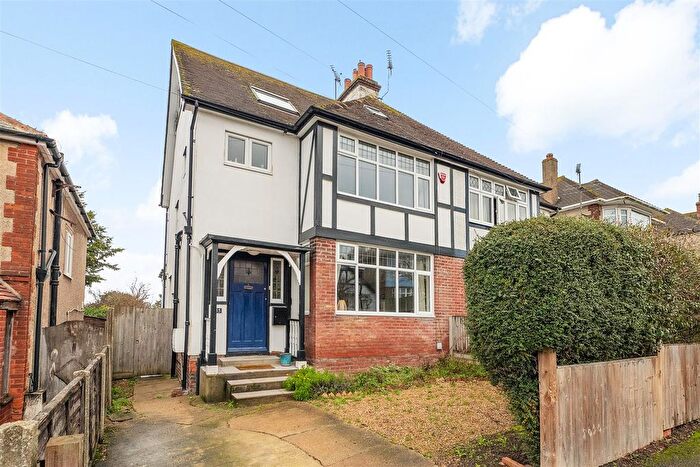
Houses for sale & to rent in Gorrell, Whitstable
House Prices in Gorrell
Properties in Gorrell have an average house price of £398,704.00 and had 223 Property Transactions within the last 3 years¹.
Gorrell is an area in Whitstable, Kent with 2,655 households², where the most expensive property was sold for £1,138,000.00.
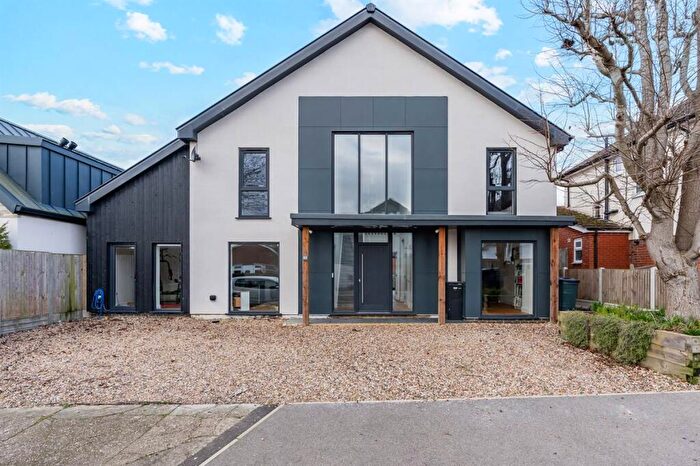
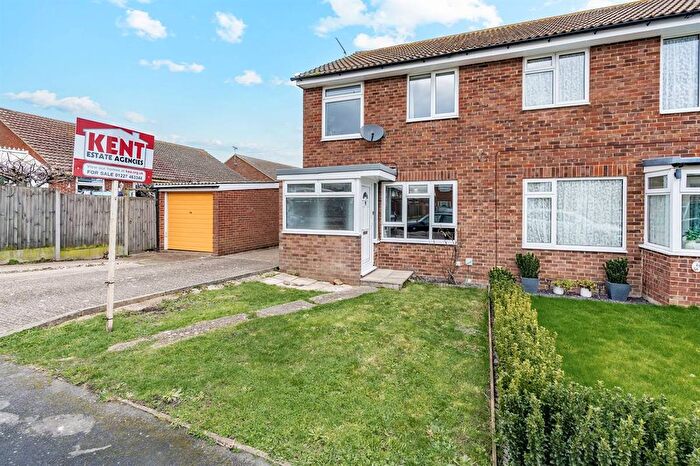
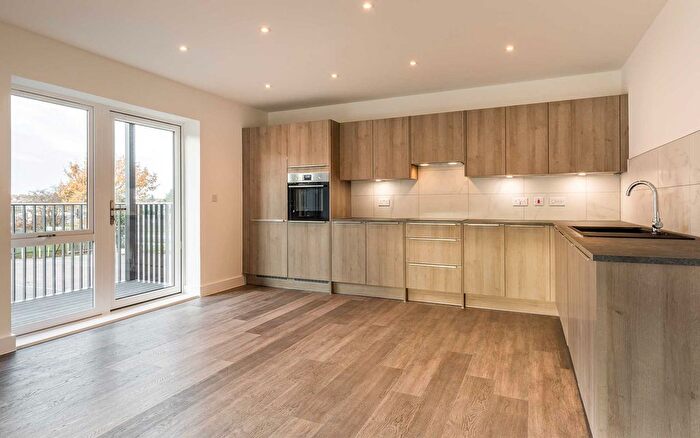
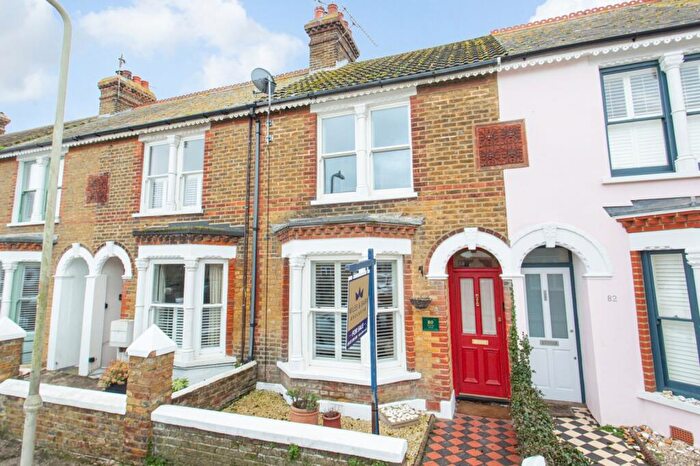
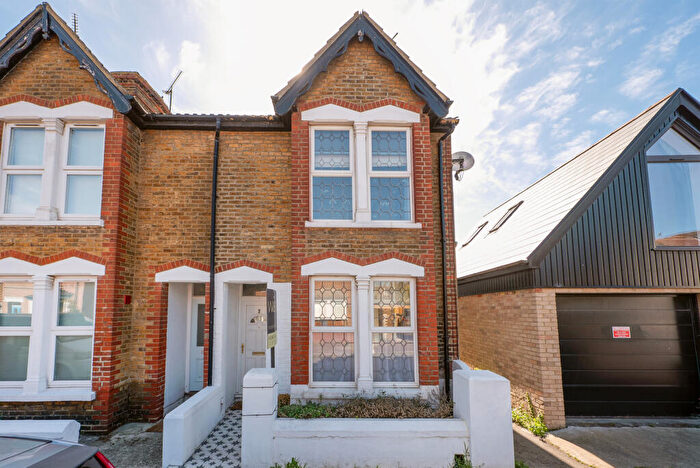
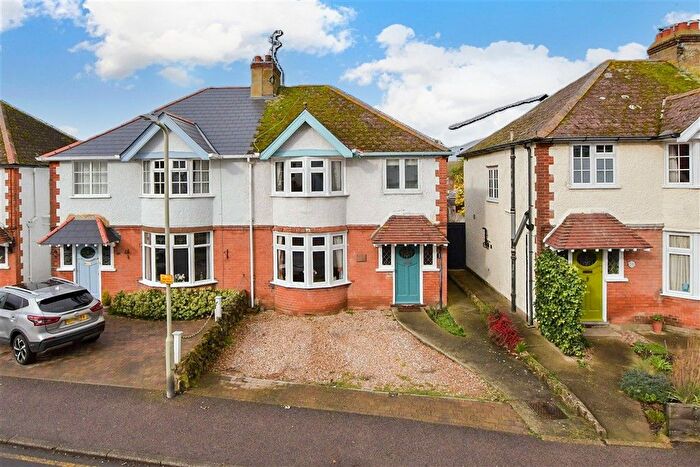
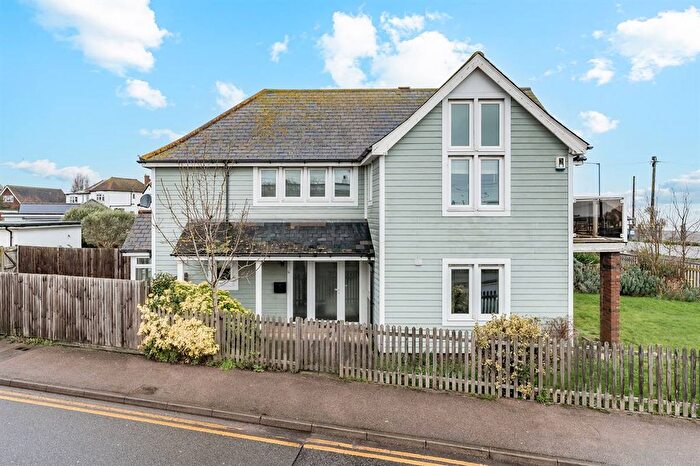
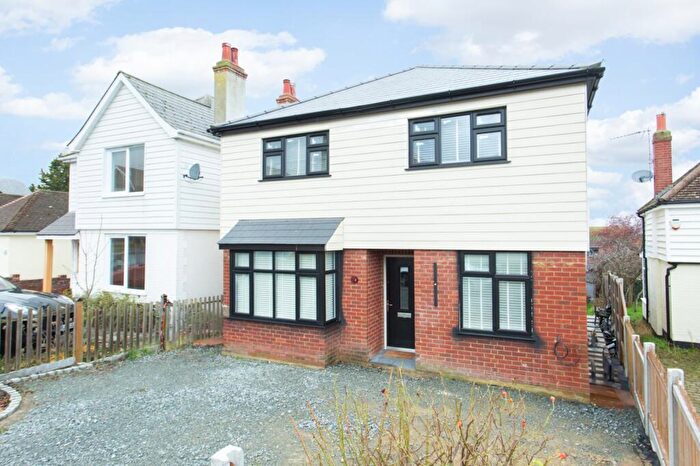
Properties for sale in Gorrell
Roads and Postcodes in Gorrell
Navigate through our locations to find the location of your next house in Gorrell, Whitstable for sale or to rent.
| Streets | Postcodes |
|---|---|
| All Saints Close | CT5 1SB CT5 1SD |
| Aurelie Way | CT5 3RT |
| Aurum Close | CT5 3FN |
| Barton Mews | CT5 1FS |
| Bayview Road | CT5 4NP |
| Bellevue Road | CT5 1PU CT5 1PY CT5 1QA CT5 1PX |
| Belmont Road | CT5 1QJ CT5 1QP CT5 1FY CT5 1QN CT5 1QW |
| Belon Drive | CT5 3FG |
| Belton Close | CT5 4LG |
| Benacre Road | CT5 4NY |
| Bogshole Lane | CT5 3AT CT5 3AS CT5 3QH |
| Bonners Alley | CT5 1BL |
| Borstal Avenue | CT5 4NX |
| Borstal Hill | CT5 4NA CT5 4NB CT5 4NU CT5 4NS |
| Britten Gardens | CT5 1SW |
| Butterworth Road | CT5 1SN CT5 1SP CT5 1SQ |
| Canterbury Road | CT5 4HG CT5 4HH CT5 4HJ CT5 4HQ CT5 4RT |
| Clapham Hill | CT5 3DJ CT5 3DL CT5 3DQ |
| Clifford Road | CT5 1PW |
| Clovelly Road | CT5 4NR |
| Coastguard Alley | CT5 1FP |
| Cranleigh Gardens | CT5 4RJ CT5 4RL |
| Deane Close | CT5 4JW |
| Deborah Close | CT5 1PS |
| Doggerel Acre | CT5 1QU |
| Douglas Avenue | CT5 1RT CT5 1RU |
| Downs Avenue | CT5 1RP CT5 1RR CT5 1RS |
| Duncan Close | CT5 4QP |
| Duncan Road | CT5 4NH |
| Elgar Avenue | CT5 1SH |
| Essex Street | CT5 4HP CT5 4HW CT5 4WB |
| Eversleigh Rise | CT5 3RN CT5 3RP |
| Farm House Close | CT5 1PZ |
| Firbanks | CT5 3EH |
| Forge Lane | CT5 4HR |
| Golden Hill | CT5 1PR CT5 1QH CT5 3AR |
| Gordon Road | CT5 4NE CT5 4NF CT5 4NG |
| Gorrell Road | CT5 1RN CT5 1RW |
| Gosselin Street | CT5 4LA CT5 4LQ |
| Granary Place | CT5 4RW |
| Green Lane | CT5 4JE |
| Grimshill Road | CT5 4LH CT5 4LJ CT5 4LL CT5 4LN CT5 4RH CT5 4RX |
| Grosvenor Road | CT5 4NN |
| Harbour Street | CT5 1AJ CT5 1BZ |
| Harwich Street | CT5 4HT CT5 4HU |
| High Street | CT5 1AU CT5 1BG CT5 1BH |
| Hill View Road | CT5 4HX |
| Hilltop | CT5 4QE |
| Holst Lane | CT5 1SS |
| Horsebridge Road | CT5 1BU |
| Hunters Chase | CT5 4QD |
| Invicta Road | CT5 1PN |
| Joseph Wilson Industrial Estate | CT5 3PS |
| Kent Street | CT5 4HS |
| Kings Avenue | CT5 1RZ |
| Kingsley Road | CT5 4LE |
| Linden Avenue | CT5 1RX |
| Marlborough Road | CT5 3DH |
| Maugham Court | CT5 4RR |
| Mill Stream Close | CT5 1RG |
| Millers Court | CT5 4QB |
| Millfield Manor | CT5 1RL |
| Millstrood Road | CT5 1PP CT5 1PT CT5 1QB CT5 1QF CT5 1QG CT5 1QQ CT5 1SJ CT5 3EF |
| Milne Avenue | CT5 1TE |
| Montpelier Avenue | CT5 3DE |
| Neptune Gap | CT5 1EY |
| Norman Road | CT5 4JY CT5 4JZ CT5 4QL |
| Oakwood Mews | CT5 4QT |
| Old Bridge Road | CT5 1RB CT5 1RH CT5 1RJ CT5 1RQ CT5 1RD CT5 1RF |
| Old Printworks Close | CT5 4GZ |
| Olympia Way | CT5 3FF CT5 3FH |
| Orchard Grove | CT5 4FW |
| Oxford Street | CT5 1DE |
| Pacific Close | CT5 3FJ |
| Paddock View | CT5 4JN |
| Parry Close | CT5 1ST |
| Pean Hill | CT5 3AY CT5 3AZ CT5 3BH |
| Pierpoint Road | CT5 4NW |
| Red Lion Lane | CT5 1FG |
| Regency Close | CT5 1QT |
| Regent Street | CT5 1AR |
| Saddleton Grove | CT5 4LY |
| Saddleton Road | CT5 4JB CT5 4JD CT5 4JG CT5 4JH CT5 4JJ CT5 4JL CT5 4JQ |
| Salisbury Road | CT5 4JF |
| Sea Street | CT5 1GA |
| Seeshill Close | CT5 4JT |
| Seymour Avenue | CT5 1RY CT5 1SA CT5 1SE |
| Skinners Alley | CT5 1QR |
| South View Road | CT5 4NT |
| St Andrews Close | CT5 4JP |
| St Davids Close | CT5 1QD |
| St Francis Close | CT5 4FJ |
| St Georges Close | CT5 4FL |
| St James Gardens | CT5 4HZ |
| St Lukes Close | CT5 4FB |
| St Marks Close | CT5 1QE |
| St Patricks Close | CT5 4FH |
| St Vincents Close | CT5 4FF |
| Stanley Road | CT5 4NJ CT5 4NQ |
| Station Approach | CT5 1QS |
| Station Road | CT5 1JZ CT5 1SF |
| Swanfield Road | CT5 4HL CT5 4HN |
| Sydney Road | CT5 4JR CT5 4JS CT5 4JU CT5 4JX |
| Terrys Lane | CT5 1AX |
| Thanet Way | CT5 3DG CT5 3FS |
| The Halt | CT5 3EQ |
| The Orchard | CT5 4LD |
| The Oysters | CT5 1ND |
| The Pines | CT5 1FQ |
| The Saltings | CT5 1ER CT5 1ES |
| The Sidings | CT5 1JY |
| Thurston Park | CT5 1RE |
| Vale Road | CT5 4HY |
| Vicarage Gardens | CT5 4FG |
| Victoria Street | CT5 1JB |
| Walmer Road | CT5 4LB CT5 4LF |
| Wellington Street | CT5 3DF |
| Wheatley Road | CT5 1FT |
| Wicketts End | CT5 1WD |
| Willow Court | CT5 1QL |
| Windmill Road | CT5 4NL |
| CT5 1FU CT5 1UZ CT5 1WA CT5 3GH CT5 3RG CT5 3WF CT5 4GW CT5 4WL CT5 9BQ CT5 9BS CT5 9DB CT5 9DJ CT5 9DP CT5 9DQ CT5 9DR CT5 9DS CT5 9DW CT5 9DZ CT5 9EA CT5 9EB |
Transport near Gorrell
- FAQ
- Price Paid By Year
- Property Type Price
Frequently asked questions about Gorrell
What is the average price for a property for sale in Gorrell?
The average price for a property for sale in Gorrell is £398,704. This amount is 13% lower than the average price in Whitstable. There are 4,387 property listings for sale in Gorrell.
What streets have the most expensive properties for sale in Gorrell?
The streets with the most expensive properties for sale in Gorrell are Clovelly Road at an average of £1,138,000, Benacre Road at an average of £697,400 and Clifford Road at an average of £663,500.
What streets have the most affordable properties for sale in Gorrell?
The streets with the most affordable properties for sale in Gorrell are Belon Drive at an average of £173,250, Maugham Court at an average of £222,500 and Wheatley Road at an average of £227,000.
Which train stations are available in or near Gorrell?
Some of the train stations available in or near Gorrell are Whitstable, Chestfield and Swalecliffe and Herne Bay.
Property Price Paid in Gorrell by Year
The average sold property price by year was:
| Year | Average Sold Price | Price Change |
Sold Properties
|
|---|---|---|---|
| 2025 | £378,108 | -9% |
67 Properties |
| 2024 | £413,603 | 3% |
86 Properties |
| 2023 | £400,114 | 0,3% |
70 Properties |
| 2022 | £398,841 | 7% |
92 Properties |
| 2021 | £369,683 | 6% |
164 Properties |
| 2020 | £346,600 | 4% |
96 Properties |
| 2019 | £332,794 | 5% |
107 Properties |
| 2018 | £317,013 | 0,5% |
132 Properties |
| 2017 | £315,444 | 3% |
97 Properties |
| 2016 | £304,676 | 7% |
124 Properties |
| 2015 | £284,157 | 18% |
149 Properties |
| 2014 | £233,886 | 11% |
182 Properties |
| 2013 | £207,147 | -0,5% |
135 Properties |
| 2012 | £208,125 | -4% |
118 Properties |
| 2011 | £215,495 | 1% |
141 Properties |
| 2010 | £212,455 | 12% |
84 Properties |
| 2009 | £187,913 | -10% |
78 Properties |
| 2008 | £207,197 | 2% |
72 Properties |
| 2007 | £202,630 | -2% |
219 Properties |
| 2006 | £206,059 | 5% |
157 Properties |
| 2005 | £196,150 | 10% |
112 Properties |
| 2004 | £176,316 | 10% |
166 Properties |
| 2003 | £158,591 | 17% |
100 Properties |
| 2002 | £131,303 | 16% |
115 Properties |
| 2001 | £110,695 | 16% |
97 Properties |
| 2000 | £93,345 | 23% |
107 Properties |
| 1999 | £72,175 | 0,3% |
111 Properties |
| 1998 | £71,928 | 9% |
84 Properties |
| 1997 | £65,493 | 13% |
112 Properties |
| 1996 | £56,739 | -2% |
98 Properties |
| 1995 | £58,006 | - |
81 Properties |
Property Price per Property Type in Gorrell
Here you can find historic sold price data in order to help with your property search.
The average Property Paid Price for specific property types in the last three years are:
| Property Type | Average Sold Price | Sold Properties |
|---|---|---|
| Flat | £206,073.00 | 34 Flats |
| Semi Detached House | £372,471.00 | 80 Semi Detached Houses |
| Detached House | £531,697.00 | 76 Detached Houses |
| Terraced House | £354,484.00 | 33 Terraced Houses |

