
Houses for sale & to rent in KT9 2PH, Chessington Parade, Chessington South, Chessington
House Prices in KT9 2PH, Chessington Parade, Chessington South
Properties in KT9 2PH have no sales history available within the last 3 years. KT9 2PH is a postcode in Chessington Parade located in Chessington South, an area in Chessington, Kingston upon Thames London Borough, with 6 households².
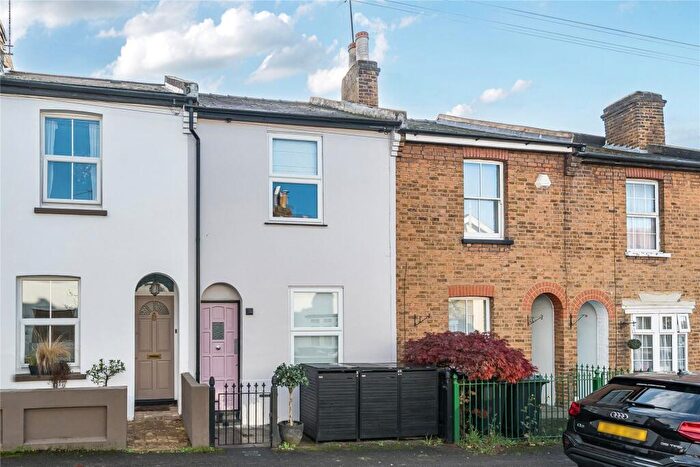
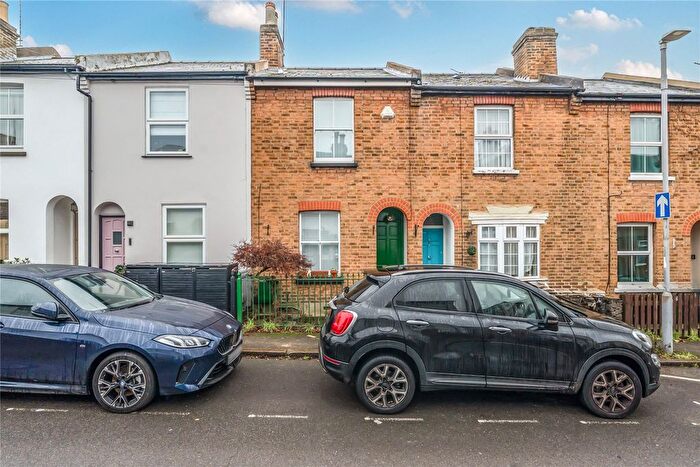
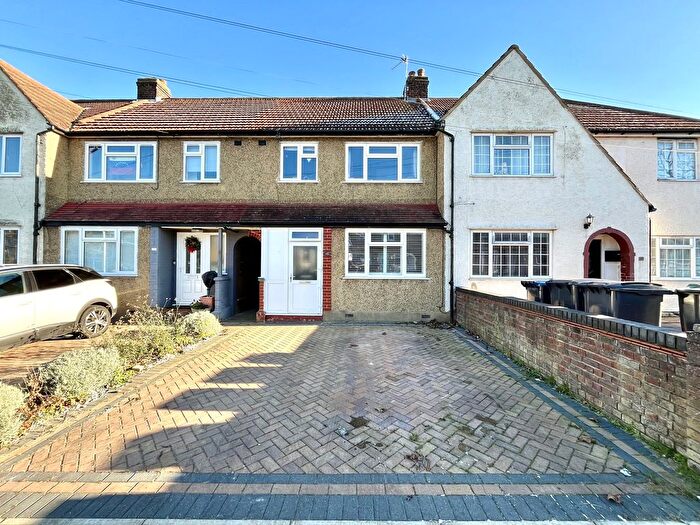
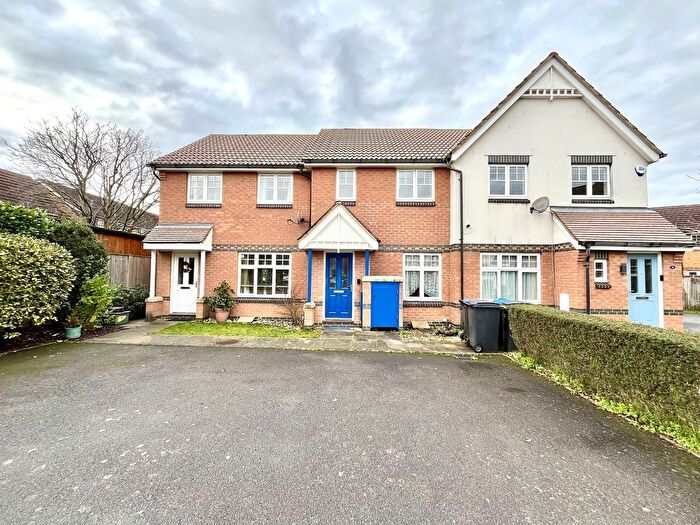
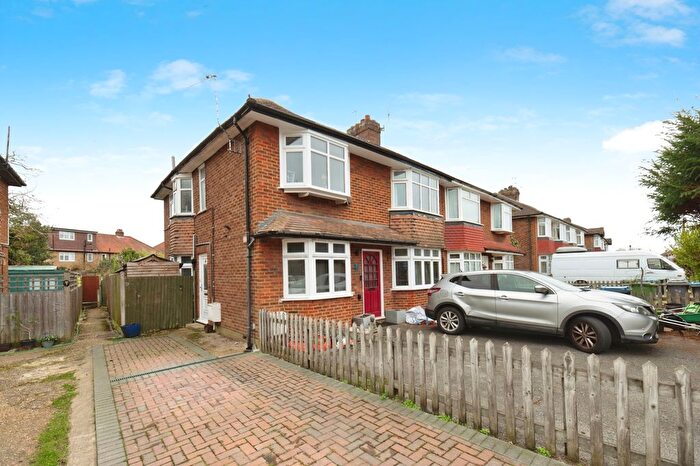
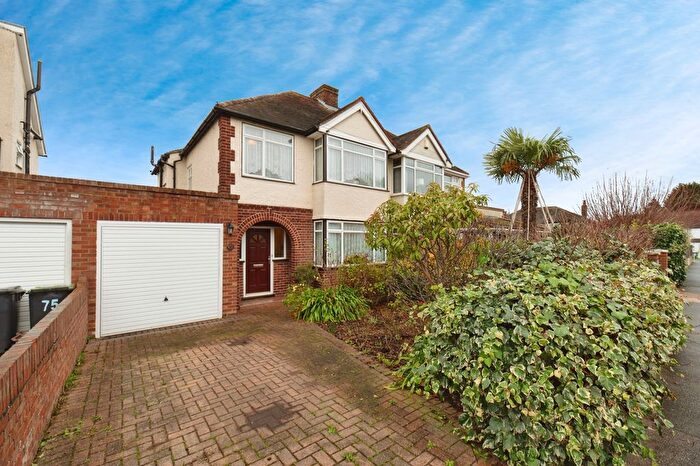
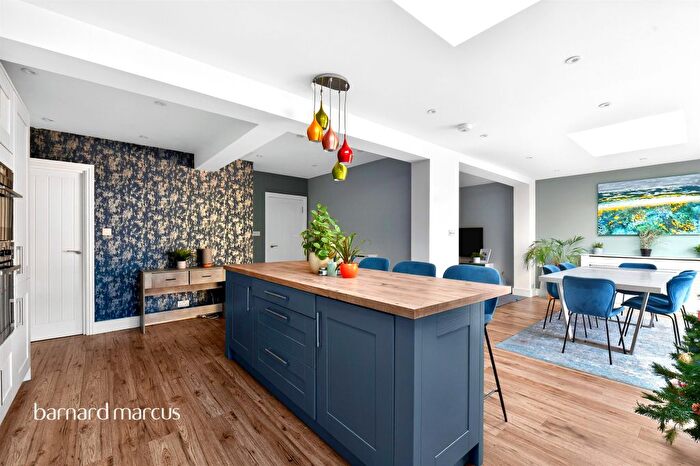
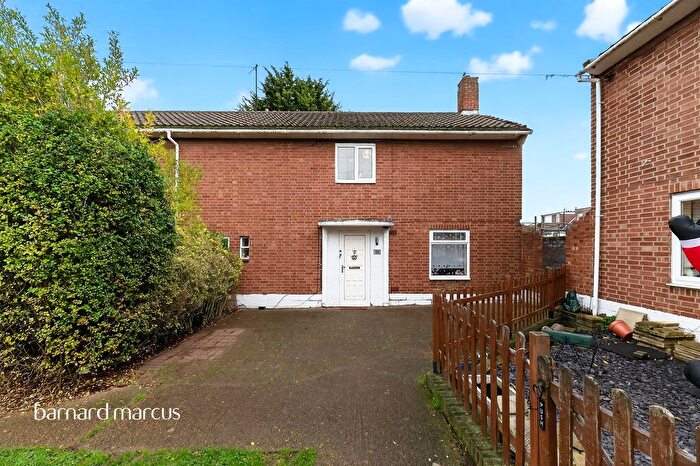
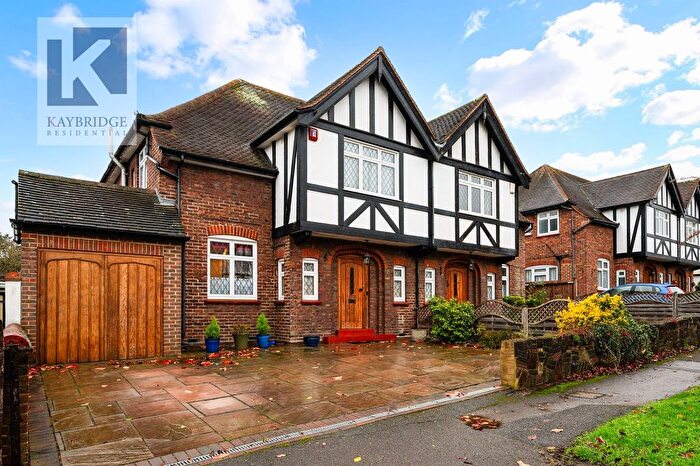
Properties for sale near KT9 2PH, Chessington Parade
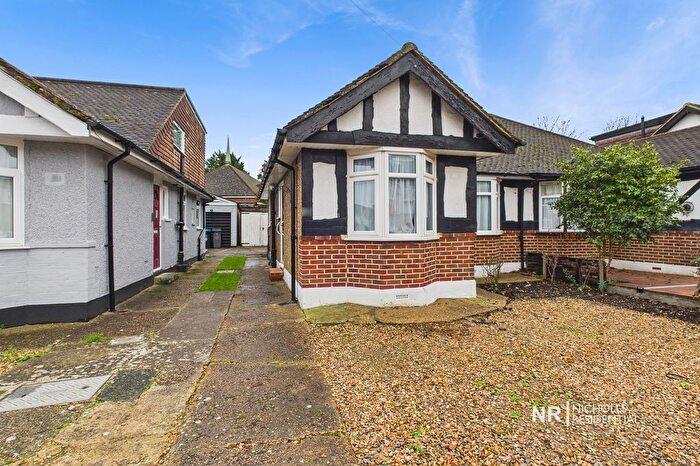
![]()
If you are looking to sell your house, let it out, or receive a property valuation, an expert can help you.
Click the button below to get started.


Price Paid in Chessington Parade, KT9 2PH, Chessington South
1A Chessington Parade, KT9 2PH, Chessington South Chessington
Property 1A has been sold 1 time. The last time it was sold was in 01/02/2008 and the sold price was £160,000.00.
This is a Terraced House which was sold as a leasehold in 01/02/2008
| Date | Price | Property Type | Tenure | Classification |
|---|---|---|---|---|
| 01/02/2008 | £160,000.00 | Terraced House | leasehold | Established Building |
3A Chessington Parade, KT9 2PH, Chessington South Chessington
Property 3A has been sold 2 times. The last time it was sold was in 12/11/2002 and the sold price was £155,000.00.
This terraced house, sold as a freehold on 12/11/2002, is a 49 sqm top-floor flat with an EPC rating of E.
| Date | Price | Property Type | Tenure | Classification |
|---|---|---|---|---|
| 12/11/2002 | £155,000.00 | Terraced House | freehold | Established Building |
| 15/10/1996 | £120,000.00 | Terraced House | freehold | Established Building |
Transport near KT9 2PH, Chessington Parade
-
 Chessington North Station
 -
Chessington South Station
-
Tolworth Station
-
Hinchley Wood Station
-
Claygate Station
-
Surbiton Station
-
Thames Ditton Station
-
Esher Station
-
Ewell West Station
-
Malden Manor Station
House price paid reports for KT9 2PH, Chessington Parade
Click on the buttons below to see price paid reports by year or property price:
- Price Paid By Year
Property Price Paid in KT9 2PH, Chessington Parade by Year
The average sold property price by year was:
| Year | Average Sold Price | Price Change |
Sold Properties
|
|---|---|---|---|
| 2008 | £160,000 | 3% |
1 Property |
| 2002 | £155,000 | 23% |
1 Property |
| 1996 | £120,000 | - |
1 Property |