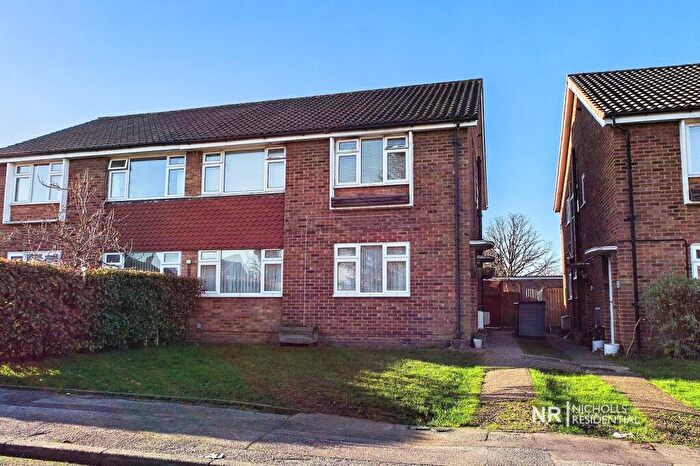
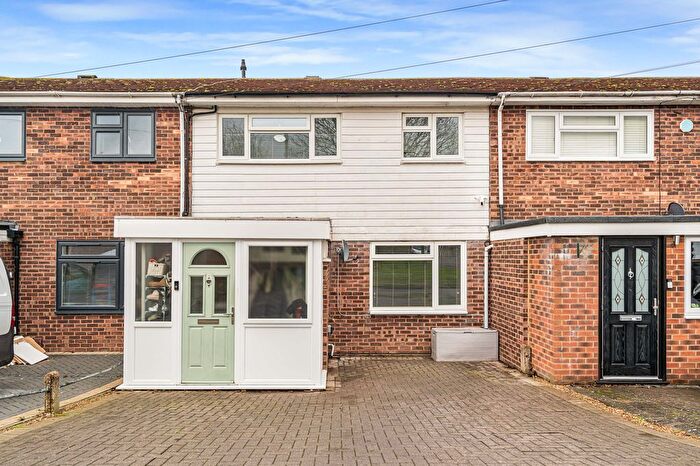
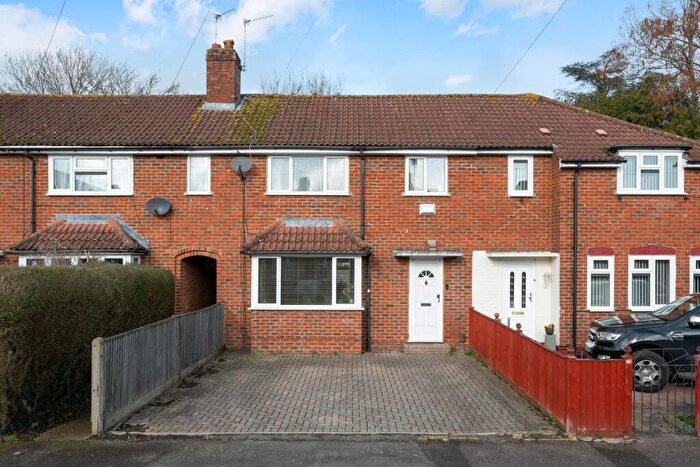
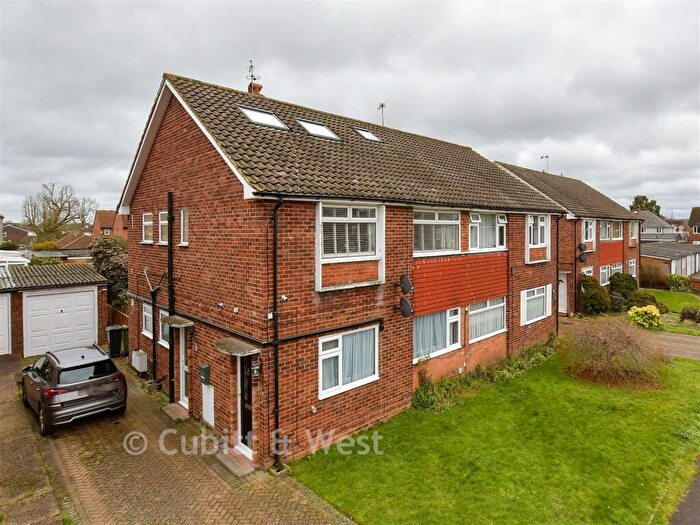
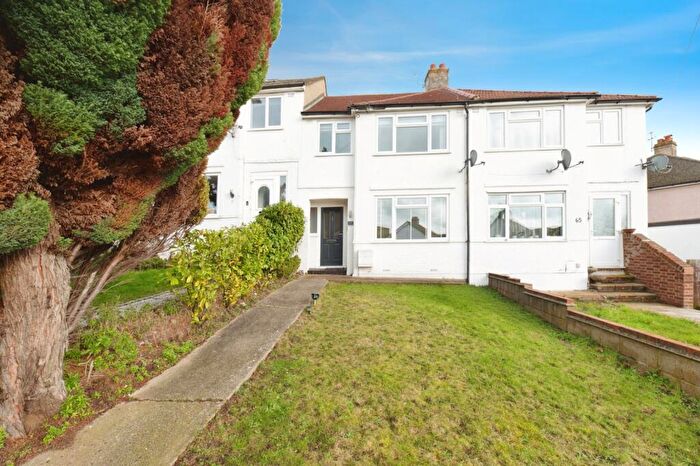
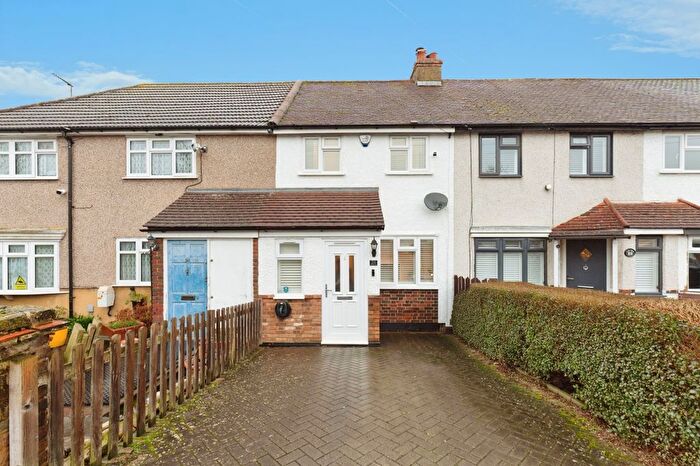
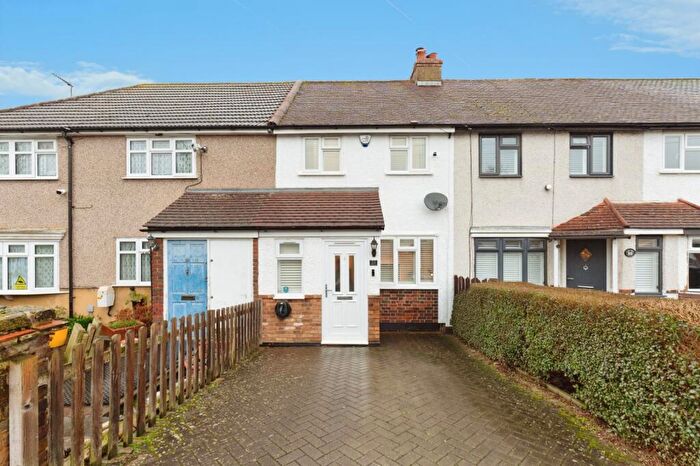
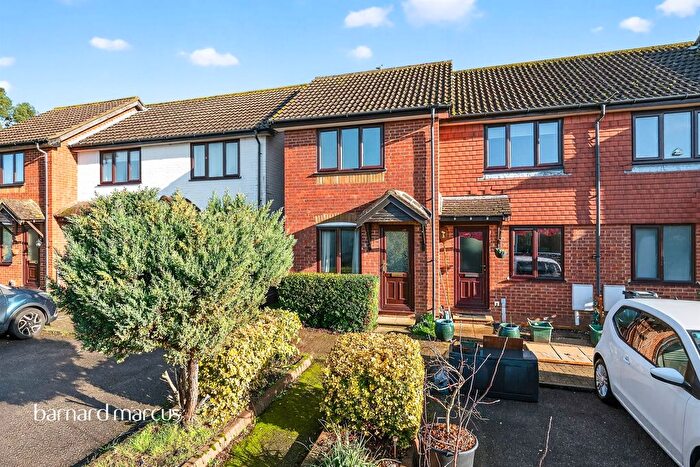
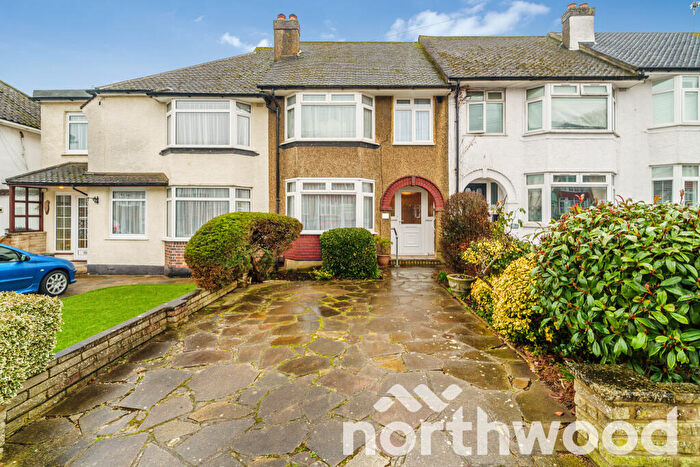
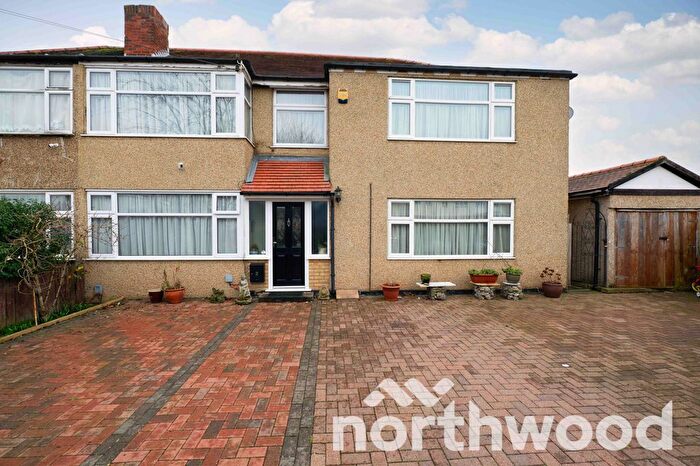
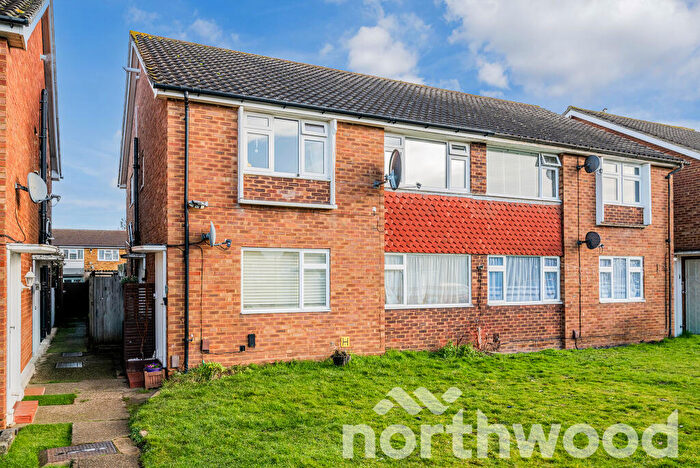
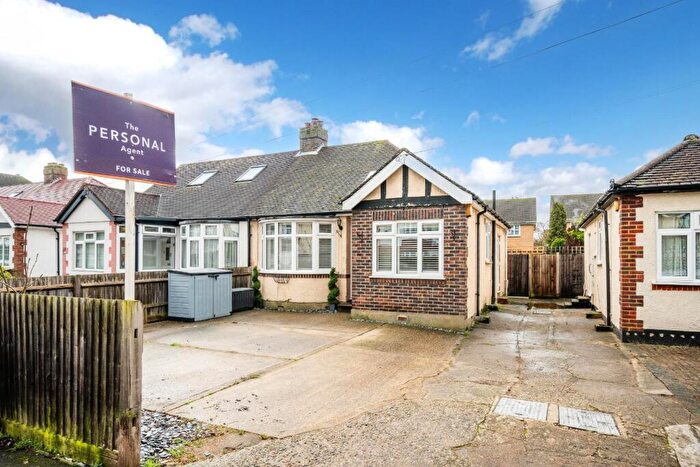
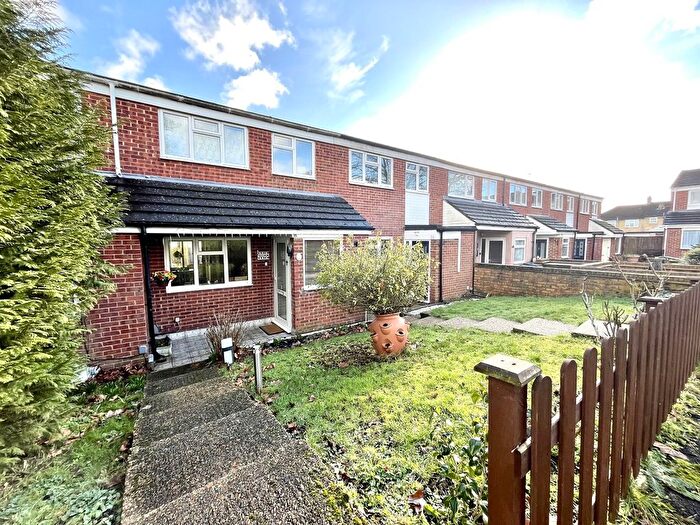
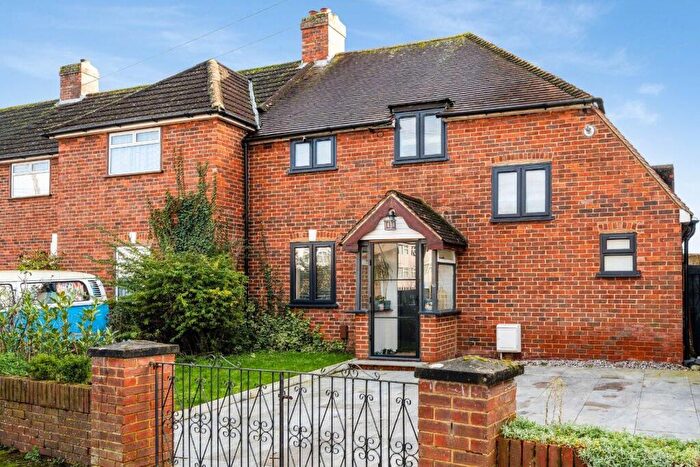
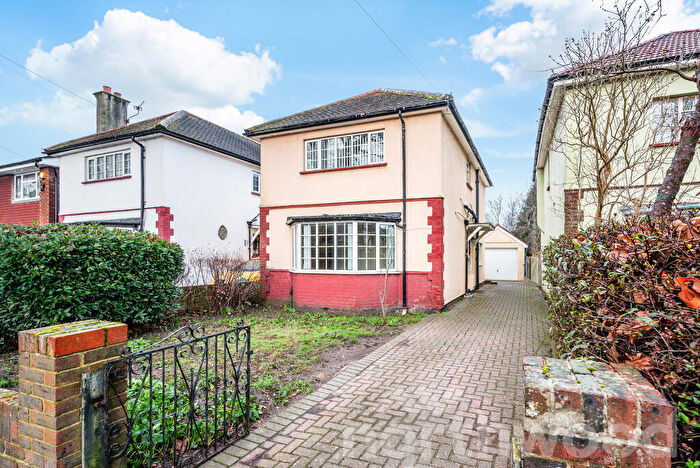
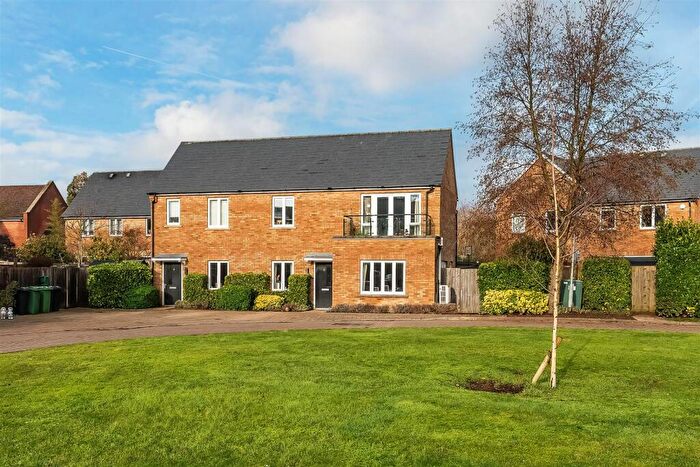
Houses for sale & to rent in Ruxley, Epsom
House Prices in Ruxley
Properties in Ruxley have an average house price of £445,222.00 and had 235 Property Transactions within the last 3 years¹.
Ruxley is an area in Epsom, Surrey with 2,513 households², where the most expensive property was sold for £1,315,000.00.
Properties for sale in Ruxley
Roads and Postcodes in Ruxley
Navigate through our locations to find the location of your next house in Ruxley, Epsom for sale or to rent.
| Streets | Postcodes |
|---|---|
| Albury Close | KT19 7LT |
| Alpine Close | KT19 9FJ KT19 9FL |
| Amis Avenue | KT19 9HU KT19 9HY KT19 9HZ |
| Ash Court | KT19 9PU |
| Bourne Way | KT19 9PP |
| Brumfield Road | KT19 9PA |
| Carnforth Close | KT19 9HQ |
| Cherwell Court | KT19 9QB |
| Chessington Close | KT19 9EQ |
| Chessington Road | KT19 9EJ KT19 9ES KT19 9HF KT19 9HH KT19 9HJ KT19 9JB KT19 9JF KT19 9JH |
| Collier Close | KT19 9JG KT19 9JQ |
| Colne Court | KT19 9PT |
| Cox Lane | KT19 9LR KT19 9LZ KT19 9NA KT19 9PB KT19 9PD KT19 9PH KT19 9PL KT19 9FX KT19 9PJ KT19 9PS KT19 9FY |
| Crane Court | KT19 9QD |
| Cyclamen Way | KT19 9LY |
| Derek Avenue | KT19 9HP KT19 9HR KT19 9HT |
| Derek Close | KT19 9NT |
| Devon Way | KT19 9HS |
| Fendall Road | KT19 9NZ |
| Gatley Avenue | KT19 9NE KT19 9NF KT19 9NG KT19 9NJ KT19 9NQ |
| Godwin Close | KT19 9LD |
| Grove Close | KT19 7NN KT19 7NP KT19 7NW |
| Hardwick Close | KT19 9NR |
| Hartford Road | KT19 9JD |
| Hemmings Mead | KT19 9AZ |
| Hendon Grove | KT19 7LH |
| Hogsmill Way | KT19 9PE |
| Holman Road | KT19 9PG KT19 9PQ |
| Hook Road | KT19 8QG |
| Horton Lane | KT19 8PT |
| Iris Road | KT19 9NH KT19 9NU KT19 9NL |
| Jackson Way | KT19 7LG |
| Jasmin Road | KT19 9DX KT19 9DY KT19 9DZ KT19 9EA |
| Jenner Way | KT19 7LJ |
| John Watkin Close | KT19 7LN KT19 7LW |
| Kelvin Close | KT19 9JE |
| Lady Forsdyke Way | KT19 7LF |
| Lady Harewood Way | KT19 7LE |
| Larch Crescent | KT19 9EL |
| Larkspur Way | KT19 9LS KT19 9LU KT19 9LX |
| Lavender Road | KT19 9EB |
| Longford Court | KT19 9PX |
| Magnolia Way | KT19 9LT |
| Mckenzie Way | KT19 7ND |
| Medina Square | KT19 7NS |
| Millais Way | KT19 9PF |
| Mole Court | KT19 9PZ |
| Monro Place | KT19 7LD |
| Nelson Walk | KT19 7LR |
| Nightingale Drive | KT19 9EN |
| Oak Tree Close | KT19 9FG |
| Oakwood Avenue | KT19 7LL KT19 7LP |
| Orchard Close | KT19 9NS |
| Pemberley Chase | KT19 9LE KT19 9LL KT19 9LP |
| Pemberley Close | KT19 9LW |
| Poplar Crescent | KT19 9ER |
| Poplar Farm Close | KT19 9EH |
| Rowden Road | KT19 9PN KT19 9PW |
| Ruxley Close | KT19 9ND |
| Ruxley Lane | KT19 9EX KT19 9EY KT19 9EZ KT19 9HA KT19 9HB KT19 9JN KT19 9JS KT19 9JT KT19 9JW KT19 9JX KT19 9FF |
| Ruxley Mews | KT19 9NB |
| Sandy Mead | KT19 7NG KT19 7NH KT19 7NQ |
| Scott Close | KT19 9NY |
| Silvergate | KT19 9GZ |
| South View | KT19 7LA KT19 7LB |
| Stanton Close | KT19 9NP |
| Sycamore Close | KT19 9FQ |
| Wandle Court | KT19 9PR |
| Watersedge | KT19 9QA |
| Wesley Close | KT19 9FN |
| Wey Court | KT19 9PY |
| Woodland Walk | KT19 9FH |
| KT19 9FU KT19 9QF |
Transport near Ruxley
-
Chessington North Station
-
Tolworth Station
-
Chessington South Station
-
Ewell West Station
-
Stoneleigh Station
-
Malden Manor Station
-
Epsom Station
-
Ewell East Station
-
Worcester Park Station
-
Surbiton Station
- FAQ
- Price Paid By Year
- Property Type Price
Frequently asked questions about Ruxley
What is the average price for a property for sale in Ruxley?
The average price for a property for sale in Ruxley is £445,222. This amount is 22% lower than the average price in Epsom. There are 1,370 property listings for sale in Ruxley.
What streets have the most expensive properties for sale in Ruxley?
The streets with the most expensive properties for sale in Ruxley are Mckenzie Way at an average of £1,060,000, Lady Harewood Way at an average of £1,038,333 and Nelson Walk at an average of £999,950.
What streets have the most affordable properties for sale in Ruxley?
The streets with the most affordable properties for sale in Ruxley are Ash Court at an average of £180,000, Alpine Close at an average of £235,000 and Godwin Close at an average of £280,000.
Which train stations are available in or near Ruxley?
Some of the train stations available in or near Ruxley are Chessington North, Tolworth and Chessington South.
Property Price Paid in Ruxley by Year
The average sold property price by year was:
| Year | Average Sold Price | Price Change |
Sold Properties
|
|---|---|---|---|
| 2025 | £444,476 | -2% |
66 Properties |
| 2024 | £452,513 | 3% |
90 Properties |
| 2023 | £437,537 | -3% |
79 Properties |
| 2022 | £450,138 | 11% |
74 Properties |
| 2021 | £398,936 | -4% |
141 Properties |
| 2020 | £416,048 | 5% |
92 Properties |
| 2019 | £397,068 | -13% |
82 Properties |
| 2018 | £447,657 | 13% |
86 Properties |
| 2017 | £391,534 | 0,3% |
100 Properties |
| 2016 | £390,553 | 9% |
107 Properties |
| 2015 | £354,072 | 9% |
107 Properties |
| 2014 | £323,199 | 15% |
120 Properties |
| 2013 | £275,574 | 2% |
140 Properties |
| 2012 | £269,338 | 2% |
106 Properties |
| 2011 | £263,151 | -10% |
107 Properties |
| 2010 | £290,587 | 12% |
91 Properties |
| 2009 | £254,799 | -0,3% |
74 Properties |
| 2008 | £255,525 | -9% |
56 Properties |
| 2007 | £278,601 | 8% |
190 Properties |
| 2006 | £255,517 | 8% |
171 Properties |
| 2005 | £234,242 | -0,1% |
105 Properties |
| 2004 | £234,444 | 15% |
187 Properties |
| 2003 | £199,156 | -14% |
123 Properties |
| 2002 | £227,479 | -5% |
244 Properties |
| 2001 | £238,000 | 21% |
316 Properties |
| 2000 | £187,706 | 45% |
174 Properties |
| 1999 | £103,059 | 9% |
135 Properties |
| 1998 | £93,613 | 11% |
119 Properties |
| 1997 | £83,366 | 10% |
150 Properties |
| 1996 | £74,852 | 3% |
106 Properties |
| 1995 | £72,783 | - |
76 Properties |
Property Price per Property Type in Ruxley
Here you can find historic sold price data in order to help with your property search.
The average Property Paid Price for specific property types in the last three years are:
| Property Type | Average Sold Price | Sold Properties |
|---|---|---|
| Semi Detached House | £500,768.00 | 68 Semi Detached Houses |
| Detached House | £797,179.00 | 24 Detached Houses |
| Terraced House | £419,841.00 | 44 Terraced Houses |
| Flat | £333,026.00 | 99 Flats |

