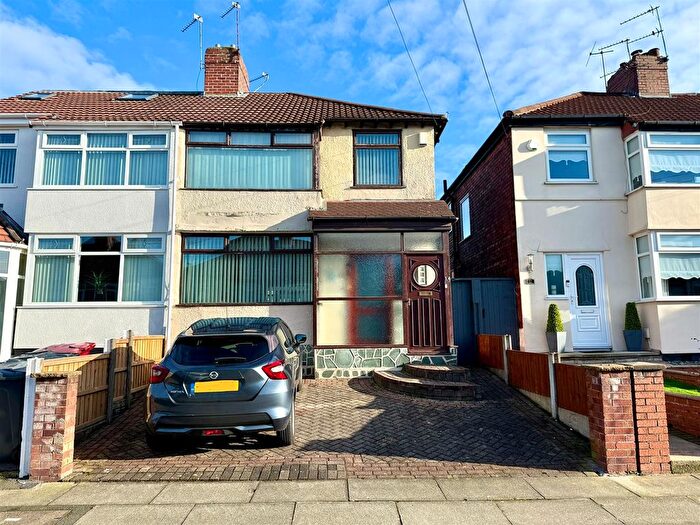
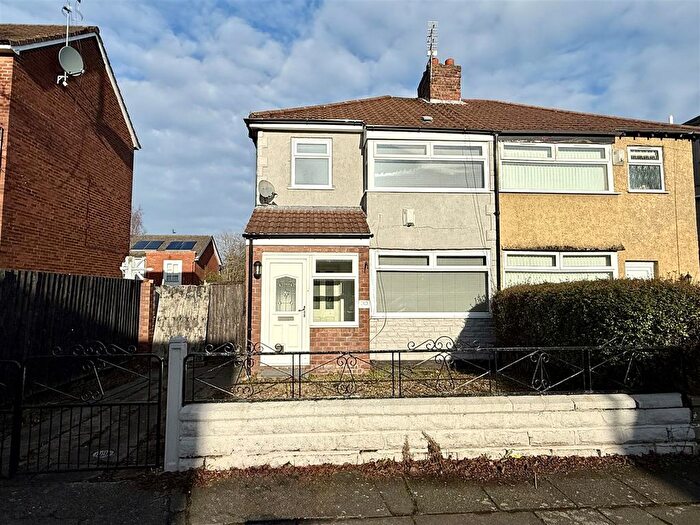
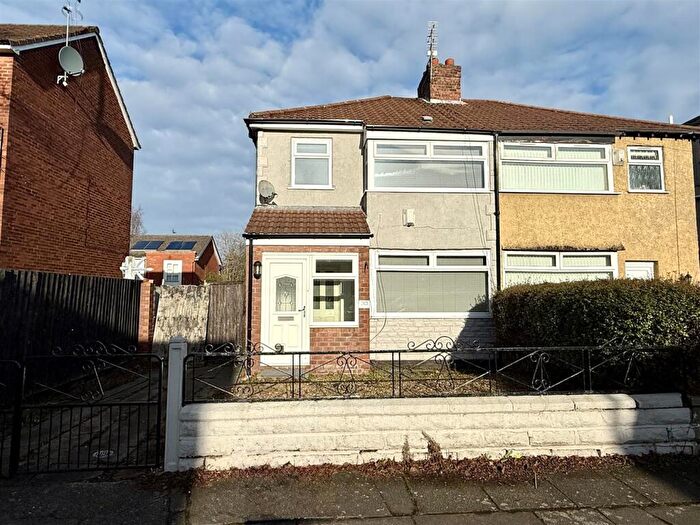
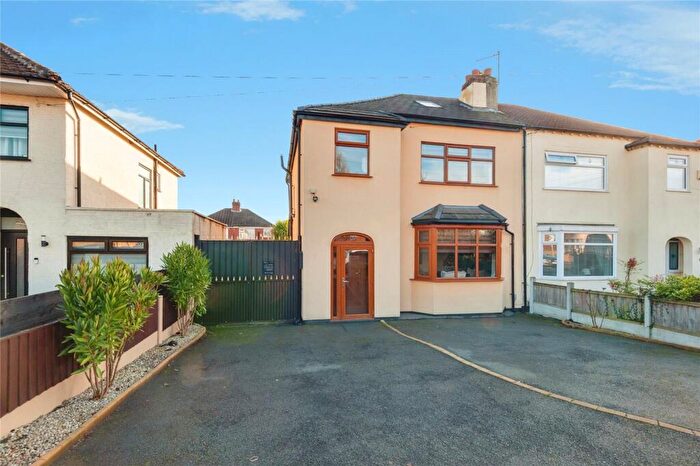
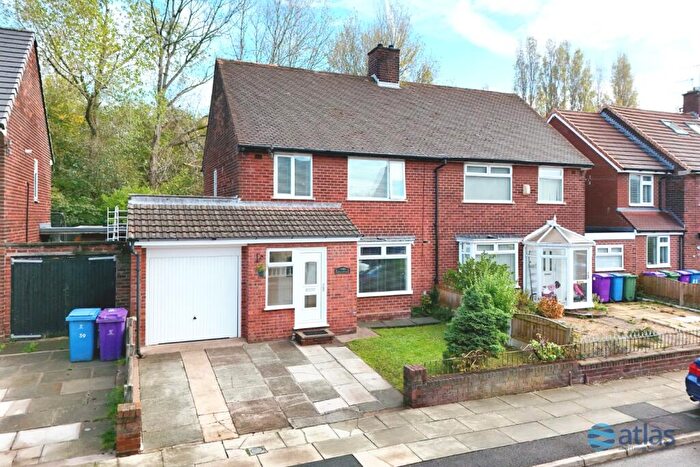
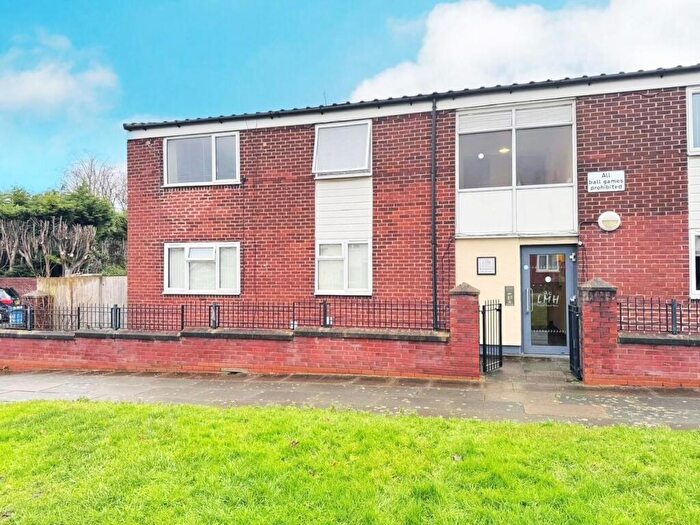
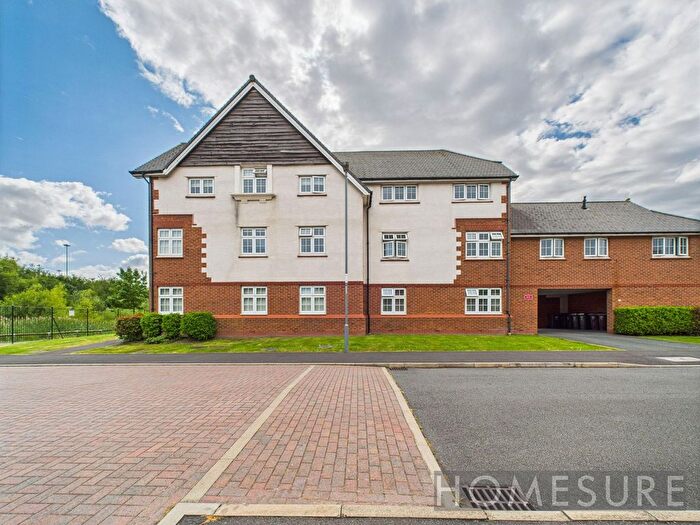
Houses for sale & to rent in Swanside, Liverpool
House Prices in Swanside
Properties in Swanside have an average house price of £220,961.00 and had 251 Property Transactions within the last 3 years¹.
Swanside is an area in Liverpool, Knowsley with 2,641 households², where the most expensive property was sold for £550,000.00.
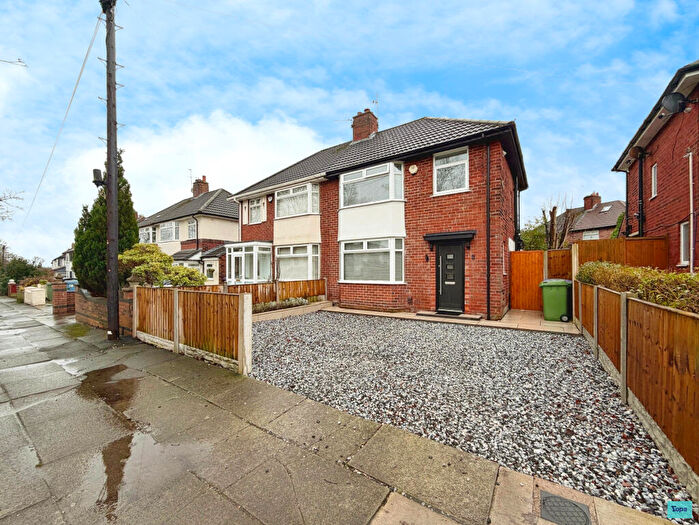
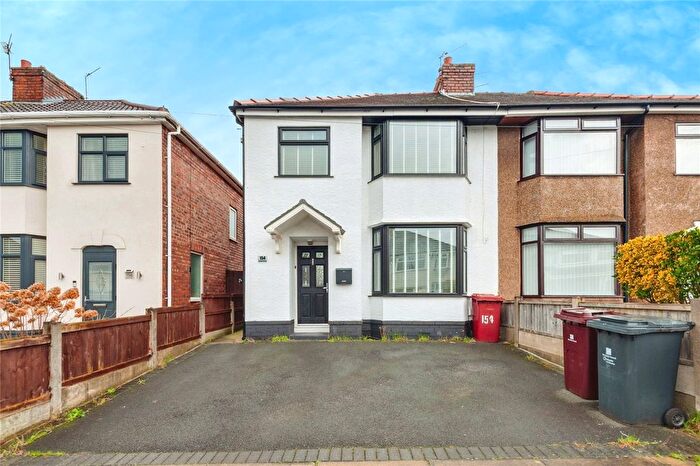
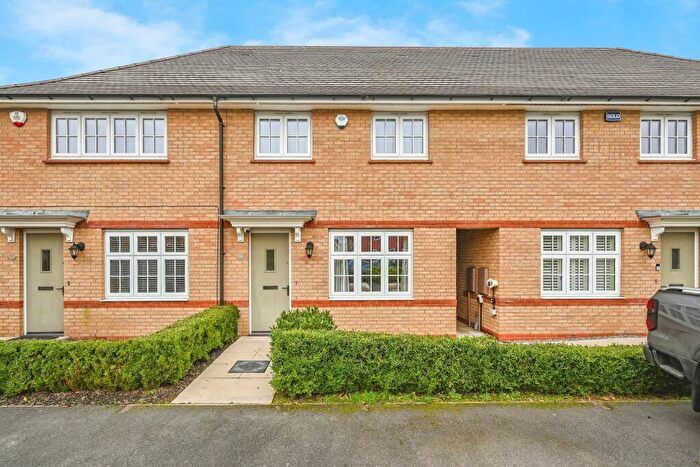
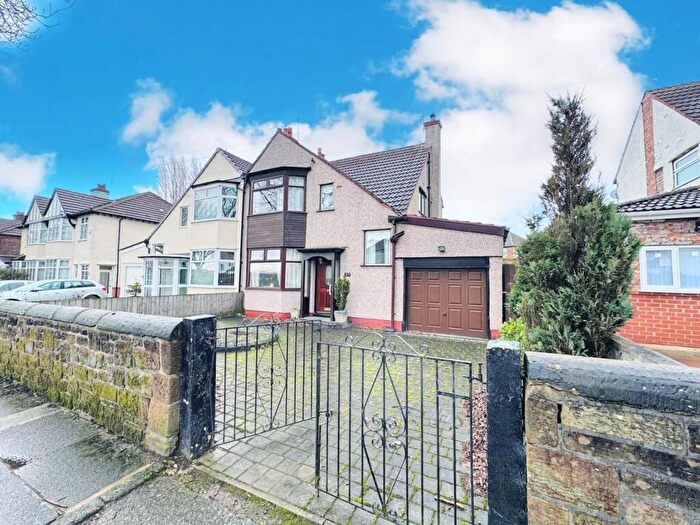
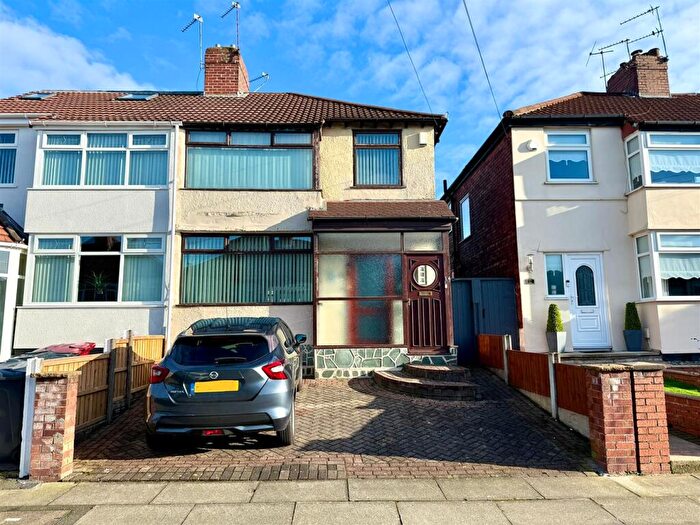
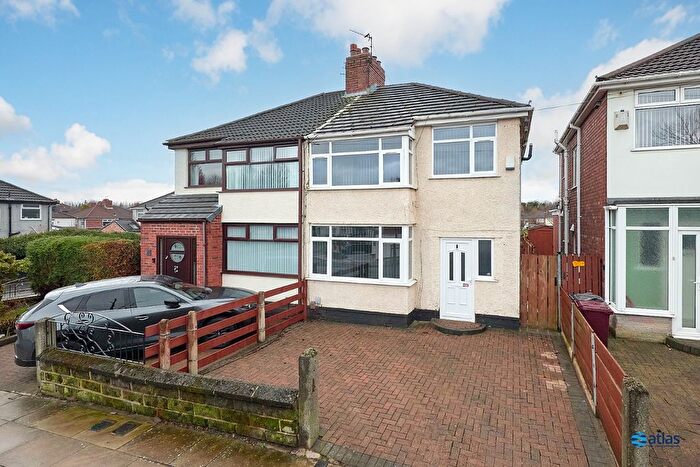
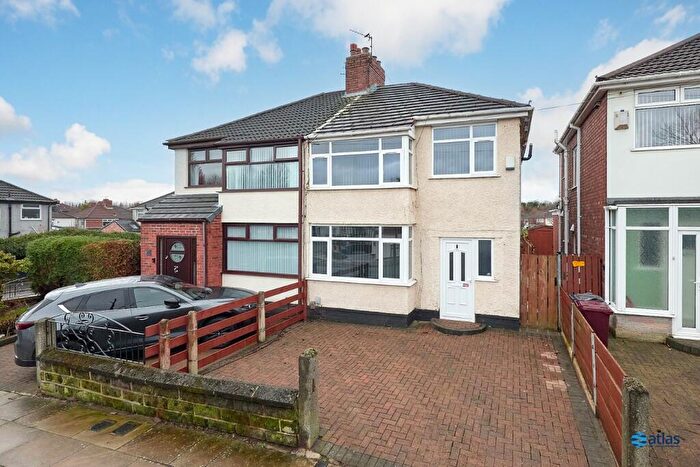
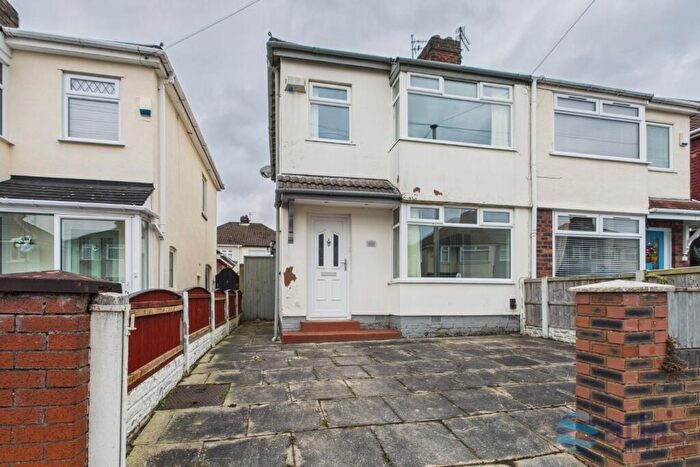
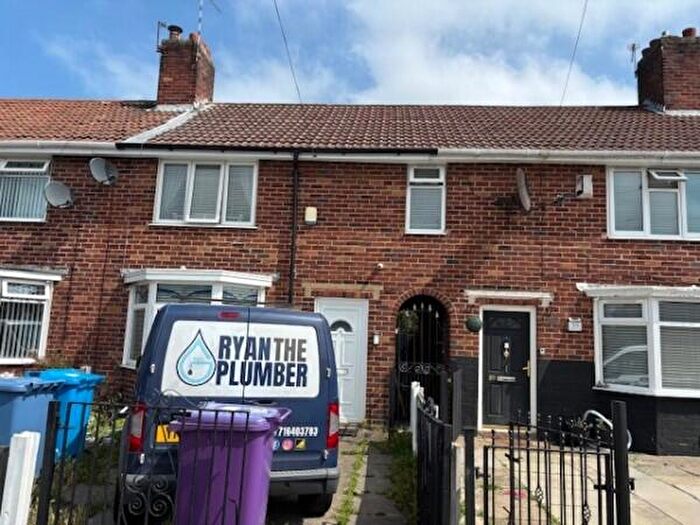
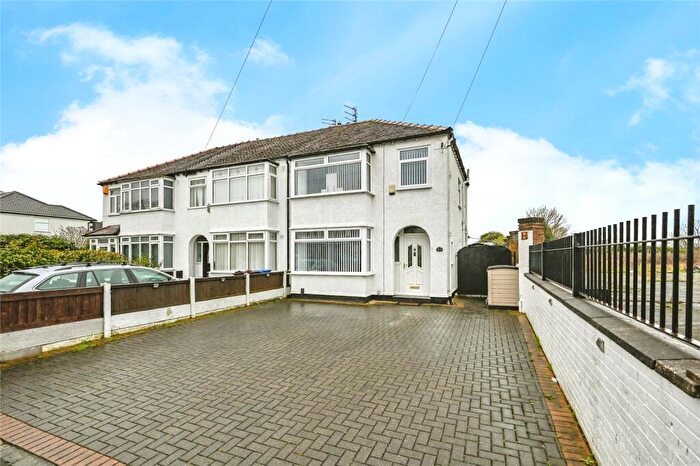
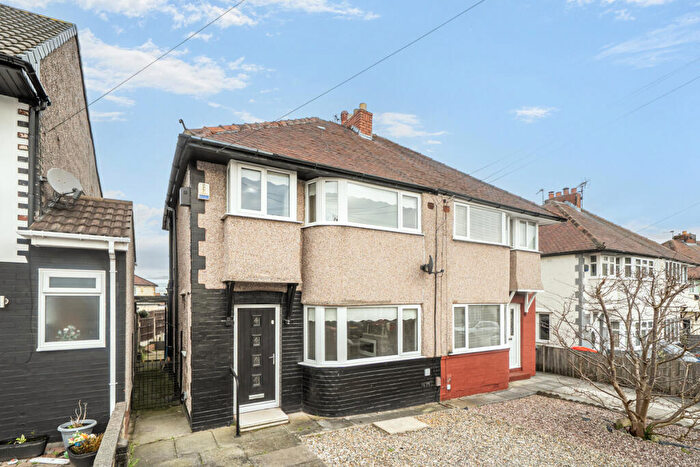
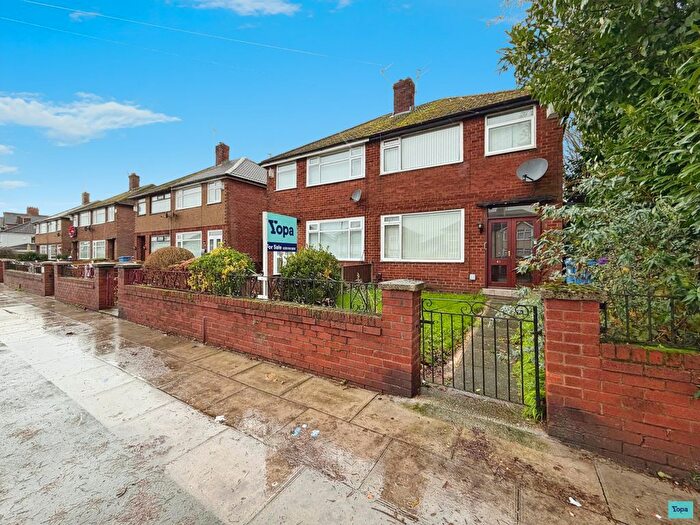
Properties for sale in Swanside
Roads and Postcodes in Swanside
Navigate through our locations to find the location of your next house in Swanside, Liverpool for sale or to rent.
| Streets | Postcodes |
|---|---|
| Adcote Close | L14 0JB |
| Ashfield Way | L14 7AD |
| Bedburn Drive | L36 4NL |
| Beechburn Road | L36 4NE L36 4NF L36 4NX |
| Berrydale Road | L14 7AH L14 7AJ L14 7AL |
| Bradfield Road | L14 7AQ |
| Campbell Drive | L14 7QE L14 7QF L14 7QG L14 7QQ |
| Charles Walk | L14 0JA |
| Childwall Lane | L14 6TU L14 6TX L14 6TY |
| Childwall Parade | L14 6TT |
| Coronation Avenue | L14 7NS |
| Coronation Drive | L14 7NT L14 7NU |
| Corwen Crescent | L14 6TA L14 6TB |
| Crowther Road | L14 7BB |
| Derwent Way | L14 7AN |
| Easton Road | L36 4NZ L36 4PA L36 4PD |
| Evercroft Road | L14 7AF |
| Evington Drive | L14 7AA |
| Fairfield Avenue | L36 4JE L36 4JF |
| Fairfield Close | L36 4NR |
| Fairfield Crescent | L36 4JG L36 4JQ |
| Friars Way | L14 7AU L14 7AZ L14 7BA |
| Gordon Drive | L14 7PU L14 7PX L14 7PY L14 7PZ |
| Greystone Crescent | L14 6UJ |
| Greystone Road | L14 6UD L14 6UE L14 6UF L14 6UG L14 6UH L14 6UQ |
| Hilary Avenue | L14 6TJ L14 6TL L14 6TN L14 6TW L14 6UP L14 6UR L14 6US |
| Holly Bank Avenue | L14 7AB L14 7AG |
| Howden Drive | L36 4NU |
| Jeffereys Drive | L36 4NT |
| Leyfield Way | L14 7AE |
| Malvern Avenue | L14 6TR L14 6TS |
| Malvern Crescent | L14 6TP |
| Marwood Road | L14 7BE L14 7AW L14 7AY |
| Mayfair Avenue | L14 0JY L14 0JZ |
| Merchant Grove | L14 7BF |
| Merton Drive | L36 4NS |
| Milton Avenue | L14 6TE L14 6TF L14 6TG L14 6TQ L14 7PB L14 7PD |
| Norbreck Avenue | L14 6UN L14 6UW |
| Oakvale Road | L14 7AP |
| Page Moss Lane | L14 0JL |
| Penrose Avenue East | L14 6UU |
| Penrose Avenue West | L14 6UT |
| Pilch Lane | L14 0JG L14 0JH L14 0JQ L14 0PN L14 7QD |
| Pilch Lane East | L36 4NN L36 4NP L36 4NW |
| Priorswood Grove | L14 7AR L14 7AX |
| Regent Avenue | L14 6UL |
| Reva Road | L14 6UA L14 6UB |
| Ringwood Avenue | L14 6TH |
| Sandown Avenue | L14 7AS |
| Sexton Way | L14 6UX |
| Stuart Drive | L14 7PT |
| Swanside Avenue | L14 7NP L14 7NR |
| Swanside Parade | L14 7QH |
| Swanside Road | L14 7NJ L14 7NL L14 7NN L14 7NW |
| Thingwall Avenue | L14 5PD |
| Thingwall Hall Drive | L14 5PE L14 5PF |
| Thingwall Lane | L14 7NY L14 7PA L14 7NZ |
| Thurstan Grove | L14 7BD |
| Trent Avenue | L14 0JU L14 0JX |
| Treswell Road | L14 7AT |
| Turnacre | L14 7QW |
| Western Avenue | L36 4PP |
| Westfield Avenue | L14 6UY L14 6UZ |
| Westwick Place | L36 4PW |
| Willoughby Road | L14 6XA L14 6XB |
| Windsor Road | L36 4NQ |
| Wyndham Avenue | L14 0LA L14 6TD |
Transport near Swanside
-
Broad Green Station
-
Roby Station
-
Huyton Station
-
Wavertree Technology Park Station
-
Mossley Hill Station
-
Edge Hill Station
- FAQ
- Price Paid By Year
- Property Type Price
Frequently asked questions about Swanside
What is the average price for a property for sale in Swanside?
The average price for a property for sale in Swanside is £220,961. This amount is 22% higher than the average price in Liverpool. There are 1,425 property listings for sale in Swanside.
What streets have the most expensive properties for sale in Swanside?
The streets with the most expensive properties for sale in Swanside are Holly Bank Avenue at an average of £430,625, Thurstan Grove at an average of £425,000 and Oakvale Road at an average of £413,333.
What streets have the most affordable properties for sale in Swanside?
The streets with the most affordable properties for sale in Swanside are Childwall Parade at an average of £75,000, Windsor Road at an average of £82,000 and Greystone Road at an average of £163,437.
Which train stations are available in or near Swanside?
Some of the train stations available in or near Swanside are Broad Green, Roby and Huyton.
Property Price Paid in Swanside by Year
The average sold property price by year was:
| Year | Average Sold Price | Price Change |
Sold Properties
|
|---|---|---|---|
| 2025 | £222,760 | -2% |
70 Properties |
| 2024 | £227,718 | 7% |
101 Properties |
| 2023 | £210,856 | 2% |
80 Properties |
| 2022 | £207,314 | 7% |
121 Properties |
| 2021 | £191,837 | 8% |
148 Properties |
| 2020 | £176,702 | -11% |
123 Properties |
| 2019 | £195,611 | 12% |
148 Properties |
| 2018 | £172,648 | -9% |
192 Properties |
| 2017 | £188,609 | 7% |
162 Properties |
| 2016 | £175,327 | -2% |
159 Properties |
| 2015 | £179,001 | 12% |
170 Properties |
| 2014 | £158,328 | 2% |
131 Properties |
| 2013 | £154,520 | 23% |
122 Properties |
| 2012 | £119,175 | 5% |
58 Properties |
| 2011 | £113,609 | -1% |
47 Properties |
| 2010 | £114,963 | -2% |
60 Properties |
| 2009 | £117,416 | -14% |
58 Properties |
| 2008 | £134,307 | -4% |
65 Properties |
| 2007 | £139,743 | 5% |
88 Properties |
| 2006 | £132,834 | 3% |
74 Properties |
| 2005 | £129,186 | 9% |
69 Properties |
| 2004 | £117,203 | 21% |
82 Properties |
| 2003 | £92,599 | 16% |
96 Properties |
| 2002 | £78,134 | 28% |
104 Properties |
| 2001 | £55,915 | 10% |
109 Properties |
| 2000 | £50,337 | 6% |
92 Properties |
| 1999 | £47,212 | 1% |
108 Properties |
| 1998 | £46,759 | 3% |
100 Properties |
| 1997 | £45,401 | -2% |
108 Properties |
| 1996 | £46,297 | 8% |
100 Properties |
| 1995 | £42,625 | - |
74 Properties |
Property Price per Property Type in Swanside
Here you can find historic sold price data in order to help with your property search.
The average Property Paid Price for specific property types in the last three years are:
| Property Type | Average Sold Price | Sold Properties |
|---|---|---|
| Semi Detached House | £207,585.00 | 191 Semi Detached Houses |
| Detached House | £409,282.00 | 23 Detached Houses |
| Terraced House | £189,261.00 | 21 Terraced Houses |
| Flat | £151,531.00 | 16 Flats |

