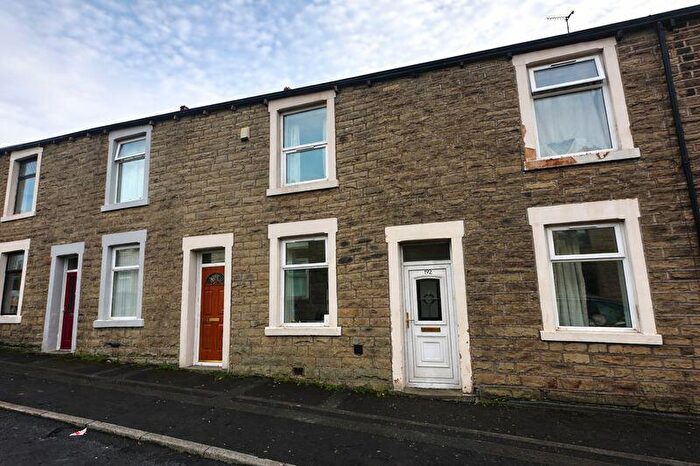
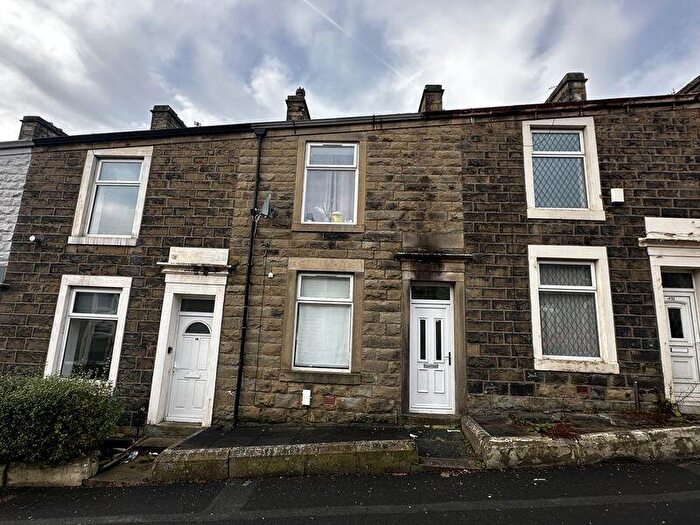
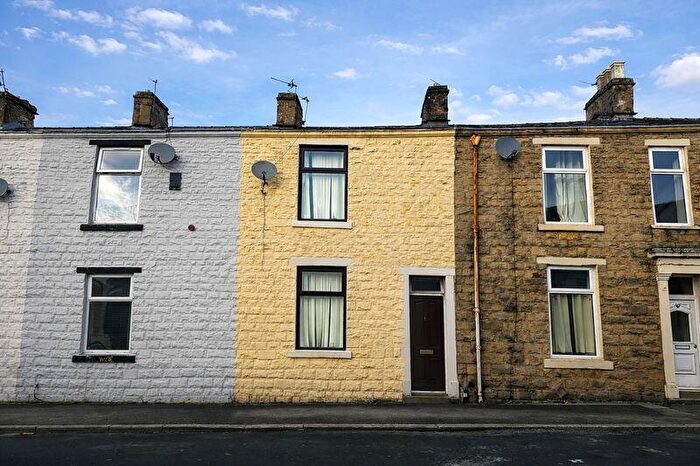
Houses for sale & to rent in Milnshaw, Accrington
House Prices in Milnshaw
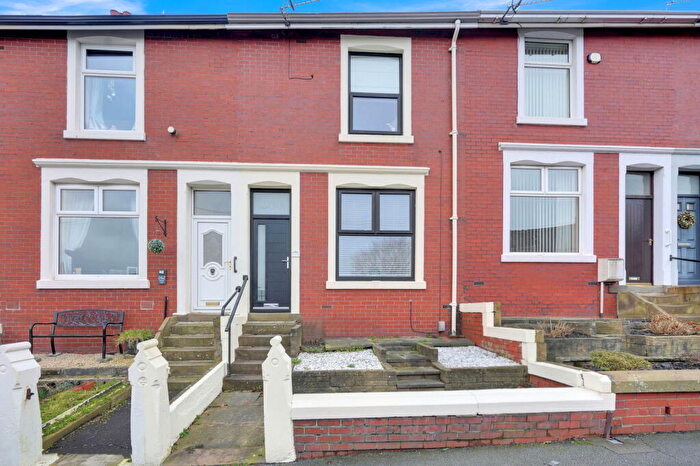
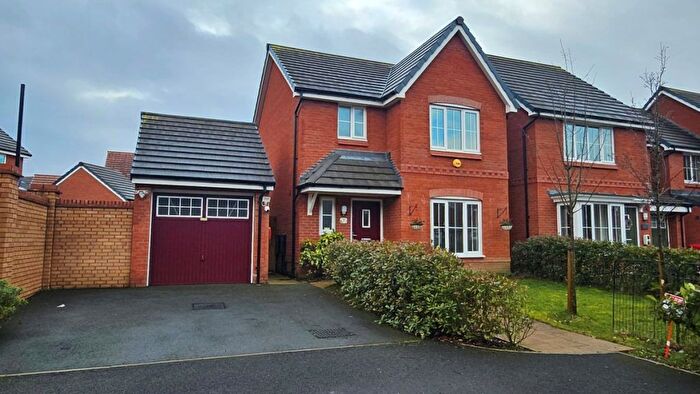
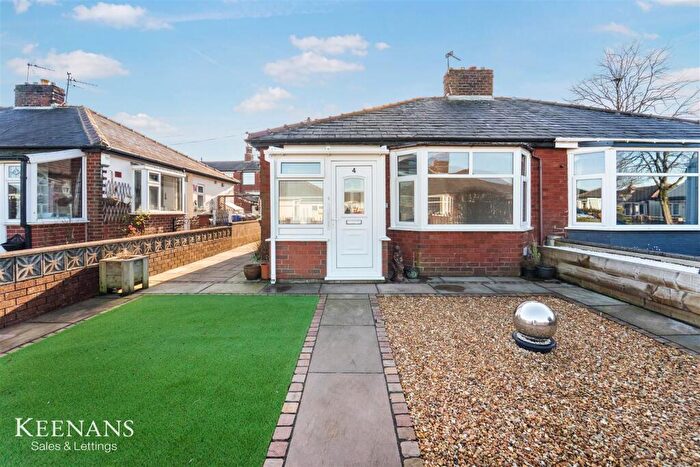
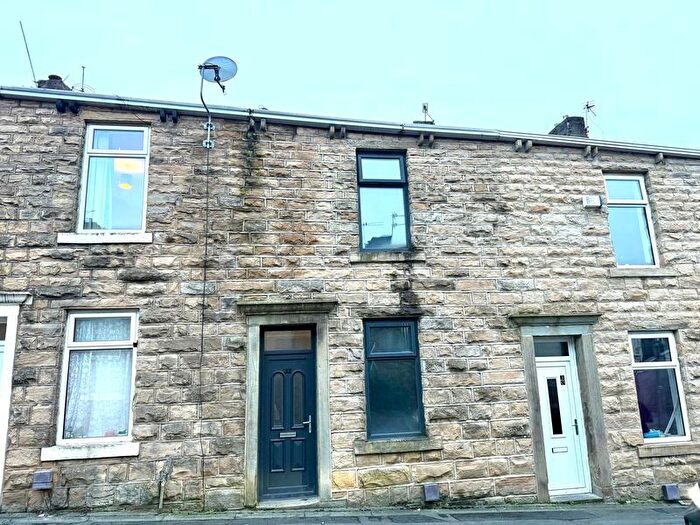
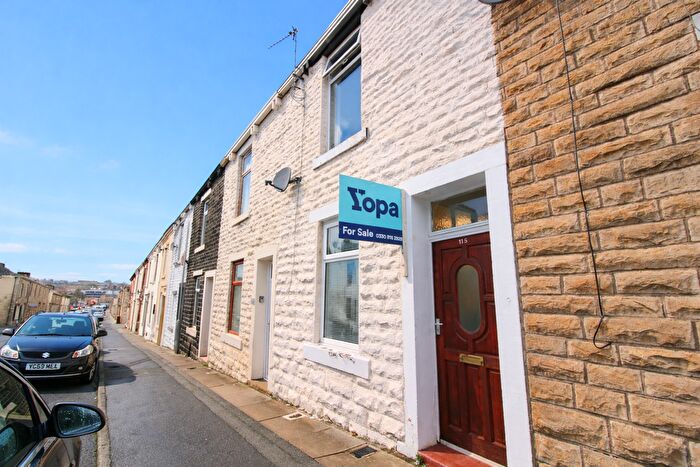
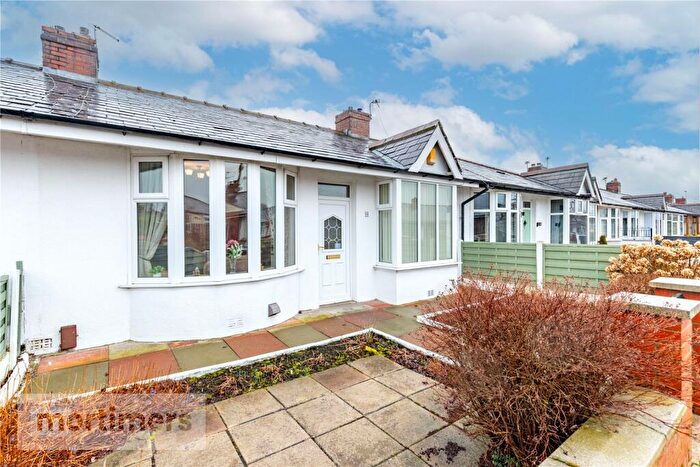
Properties in Milnshaw have an average house price of £130,681.00 and had 221 Property Transactions within the last 3 years¹.
Milnshaw is an area in Accrington, Lancashire with 1,982 households², where the most expensive property was sold for £390,000.00.
Properties for sale in Milnshaw
Roads and Postcodes in Milnshaw
Navigate through our locations to find the location of your next house in Milnshaw, Accrington for sale or to rent.
| Streets | Postcodes |
|---|---|
| Aitken Street | BB5 6AX |
| Banbury Close | BB5 4BZ |
| Belgarth Road | BB5 6AH |
| Bowler Avenue | BB5 5FX |
| Cheltenham Avenue | BB5 6BG |
| Claremont Road | BB5 5BN |
| Cleveleys Road | BB5 5ET |
| Clifton Avenue | BB5 6BE |
| Cromwell Avenue | BB5 5AG |
| David Lloyd Way | BB5 5FW |
| Devonshire Street | BB5 1DW |
| East Crescent | BB5 5BS |
| Eccles Street | BB5 4BP |
| Ellerbeck Road | BB5 5AN |
| Enterprise Court | BB5 6TS |
| Entwisle Road | BB5 5AE |
| Eton Avenue | BB5 6BH |
| Evesham Close | BB5 4DA |
| Garden Street | BB5 1DB |
| Gloucester Avenue | BB5 4BG |
| Hambledon Mill Park | BB5 5FP BB5 5FQ |
| Harrow Avenue | BB5 6BQ |
| Hawksworth Road | BB5 5AR |
| Haywood Close | BB5 5DA |
| Haywood Road | BB5 5AW BB5 5BP BB5 6AT BB5 6AS |
| Hereford Close | BB5 4BB |
| Kings Road | BB5 6BS |
| Lancaster Avenue | BB5 4BH |
| Laneside Avenue | BB5 5AT |
| Langham Avenue | BB5 5BG |
| Lime Road | BB5 6BJ BB5 6BN |
| Link Lane | BB5 1AE |
| Livingstone Road | BB5 5BX |
| Lupin Close | BB5 4SD |
| Lupin Road | BB5 4BX |
| Malvern Close | BB5 4DD |
| Marlborough Road | BB5 5AX BB5 6AY BB5 6BL BB5 5BE |
| Mather Avenue | BB5 5AU |
| Meadow Bank | BB5 6AZ |
| Moss Hall Road | BB5 5AS BB5 5AZ |
| Newhouse Road | BB5 6NA BB5 6NT |
| Nutter Road | BB5 6BB |
| Orange Street | BB5 5AQ |
| Owen Street | BB5 6AU |
| Pansy Street North | BB5 4BJ |
| Pansy Street South | BB5 4BS |
| Pilot Street | BB5 5AH |
| Pollard Street | BB5 6BA |
| Poulton Avenue | BB5 5EP |
| Queens Road | BB5 6AP BB5 6AR BB5 6AW |
| Queens Road West | BB5 4BA BB5 4BQ BB5 4FF |
| Queensborough Road | BB5 5AP |
| Radnor Street | BB5 5AL |
| Ralph Avenue | BB5 5BA |
| Ramsbottom Street | BB5 1BZ |
| Ribblesdale Avenue | BB5 5BH BB5 5BQ BB5 5BW |
| Ribbleton Drive | BB5 5BJ |
| Rugby Avenue | BB5 6BW |
| Stratford Way | BB5 4DB |
| Strawberry Bank | BB5 6AN |
| Talbot Road | BB5 5EW |
| Thorneyholme Road | BB5 5BB BB5 6BD BB5 5BD |
| Thornton Close | BB5 5ER |
| Warwick Avenue | BB5 4BD |
| West Crescent | BB5 5BU |
| Westwood Street | BB5 4BL |
| Whalley Road | BB5 1BS BB5 1BX BB5 5AA BB5 5AD BB5 5DF BB5 5DQ BB5 1BT BB5 5AB BB5 5DE |
| Whitaker Street | BB5 5AJ |
| Winchester Avenue | BB5 6BP |
| Worcester Avenue | BB5 4BE |
| Wyresdale Avenue | BB5 5ES |
| York Place | BB5 4BU |
| York Street | BB5 1DN |
Transport near Milnshaw
- FAQ
- Price Paid By Year
- Property Type Price
Frequently asked questions about Milnshaw
What is the average price for a property for sale in Milnshaw?
The average price for a property for sale in Milnshaw is £130,681. This amount is 4% lower than the average price in Accrington. There are 738 property listings for sale in Milnshaw.
What streets have the most expensive properties for sale in Milnshaw?
The streets with the most expensive properties for sale in Milnshaw are Wyresdale Avenue at an average of £285,000, Queens Road at an average of £206,778 and Poulton Avenue at an average of £194,918.
What streets have the most affordable properties for sale in Milnshaw?
The streets with the most affordable properties for sale in Milnshaw are Ribbleton Drive at an average of £57,500, West Crescent at an average of £79,500 and Orange Street at an average of £84,000.
Which train stations are available in or near Milnshaw?
Some of the train stations available in or near Milnshaw are Accrington, Huncoat and Church and Oswaldtwistle.
Property Price Paid in Milnshaw by Year
The average sold property price by year was:
| Year | Average Sold Price | Price Change |
Sold Properties
|
|---|---|---|---|
| 2025 | £142,475 | 11% |
74 Properties |
| 2024 | £126,203 | 2% |
76 Properties |
| 2023 | £123,183 | -4% |
71 Properties |
| 2022 | £128,224 | 10% |
104 Properties |
| 2021 | £115,860 | 3% |
112 Properties |
| 2020 | £112,119 | 4% |
59 Properties |
| 2019 | £107,715 | 11% |
73 Properties |
| 2018 | £96,066 | -15% |
71 Properties |
| 2017 | £110,727 | -8% |
102 Properties |
| 2016 | £120,125 | 17% |
128 Properties |
| 2015 | £100,082 | 14% |
70 Properties |
| 2014 | £85,591 | -8% |
59 Properties |
| 2013 | £92,520 | -9% |
49 Properties |
| 2012 | £100,444 | 13% |
60 Properties |
| 2011 | £86,973 | -10% |
54 Properties |
| 2010 | £95,613 | 7% |
42 Properties |
| 2009 | £89,231 | -21% |
48 Properties |
| 2008 | £107,688 | -9% |
61 Properties |
| 2007 | £116,917 | 10% |
119 Properties |
| 2006 | £104,990 | 14% |
110 Properties |
| 2005 | £90,693 | 13% |
117 Properties |
| 2004 | £79,001 | 28% |
96 Properties |
| 2003 | £56,834 | 17% |
103 Properties |
| 2002 | £47,105 | 2% |
130 Properties |
| 2001 | £45,989 | 8% |
86 Properties |
| 2000 | £42,346 | 1% |
79 Properties |
| 1999 | £42,000 | 15% |
58 Properties |
| 1998 | £35,604 | -1% |
79 Properties |
| 1997 | £35,862 | -4% |
68 Properties |
| 1996 | £37,414 | -6% |
83 Properties |
| 1995 | £39,780 | - |
72 Properties |
Property Price per Property Type in Milnshaw
Here you can find historic sold price data in order to help with your property search.
The average Property Paid Price for specific property types in the last three years are:
| Property Type | Average Sold Price | Sold Properties |
|---|---|---|
| Semi Detached House | £157,628.00 | 64 Semi Detached Houses |
| Detached House | £185,295.00 | 22 Detached Houses |
| Terraced House | £109,077.00 | 134 Terraced Houses |
| Flat | £99,500.00 | 1 Flat |

