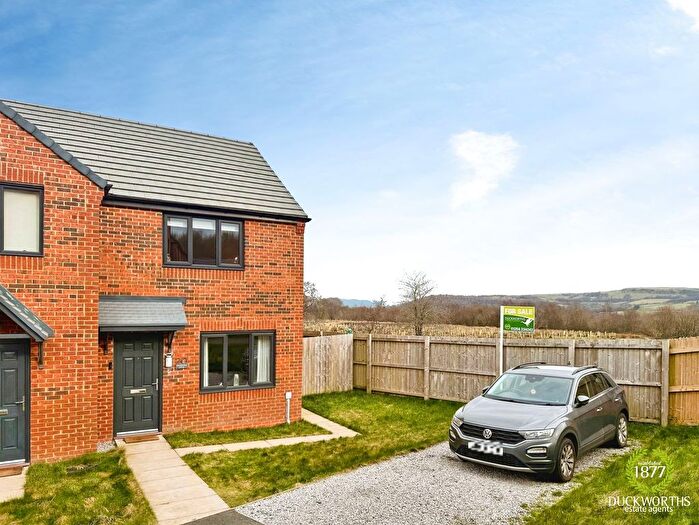
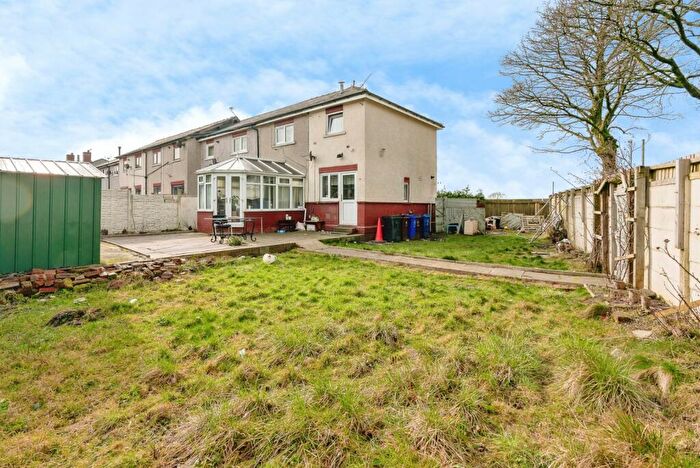
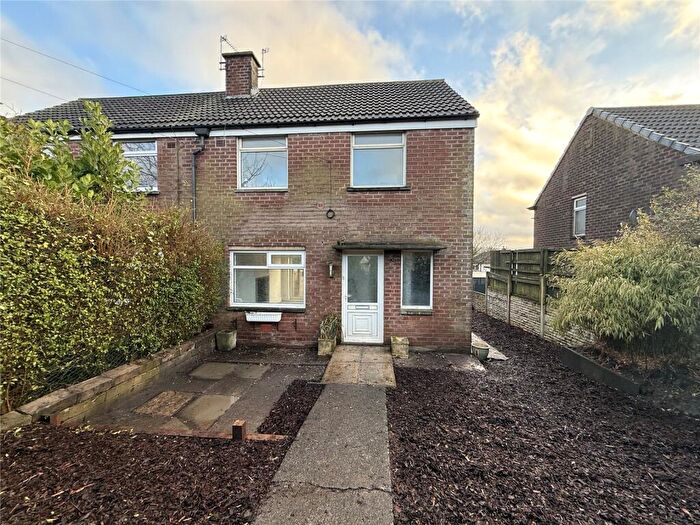
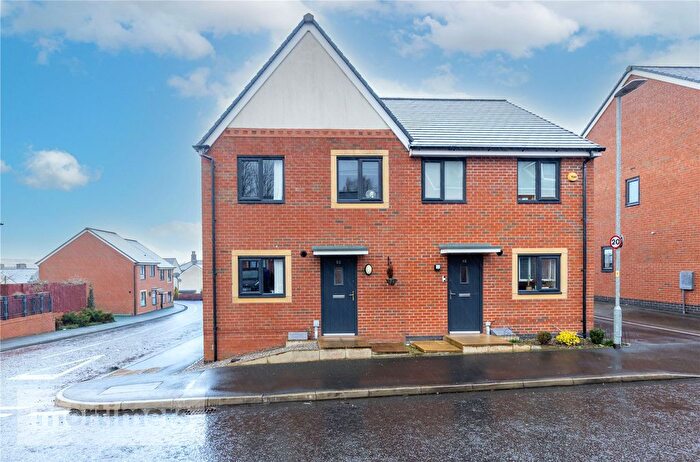
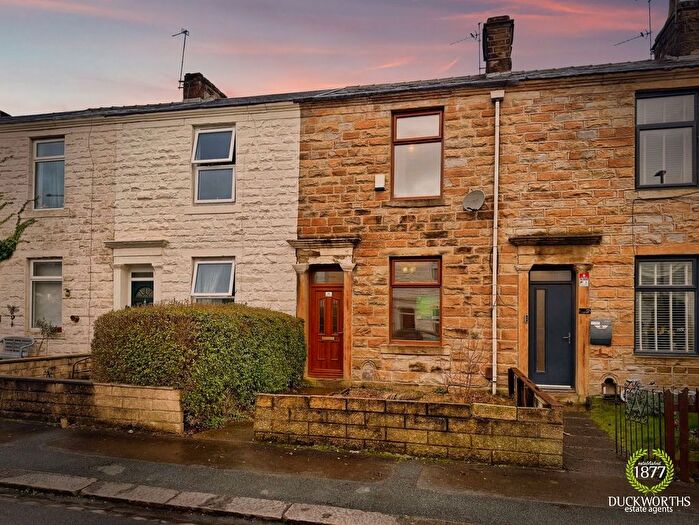
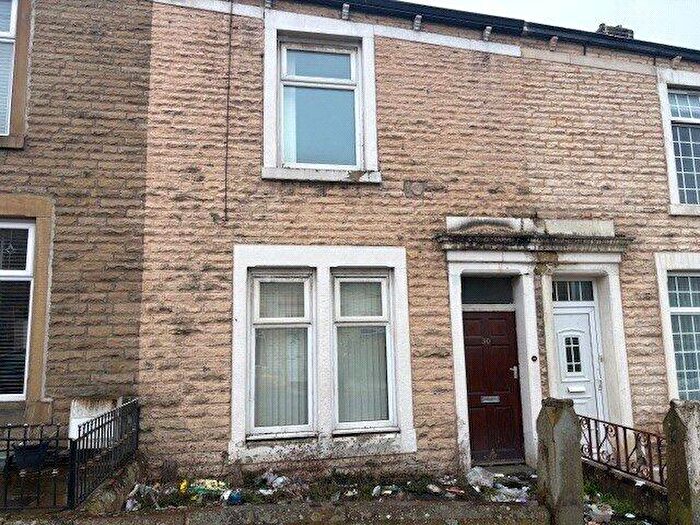
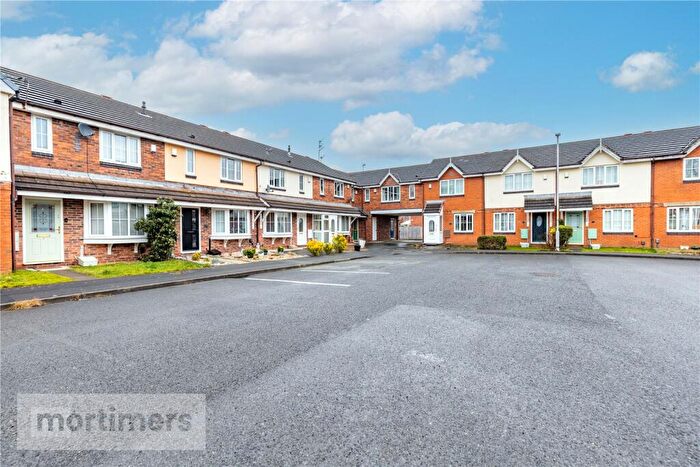
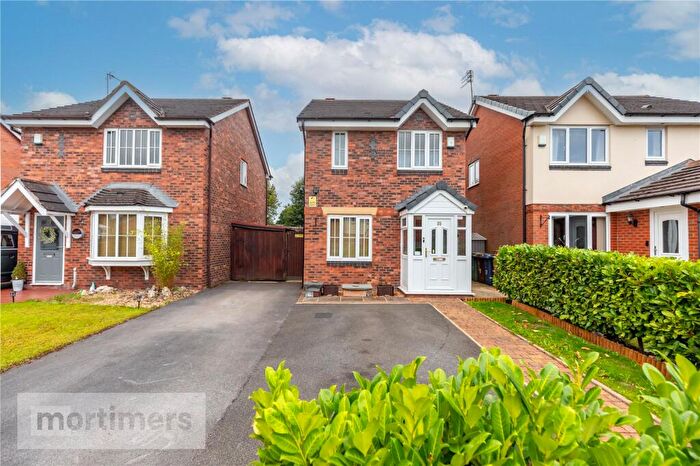
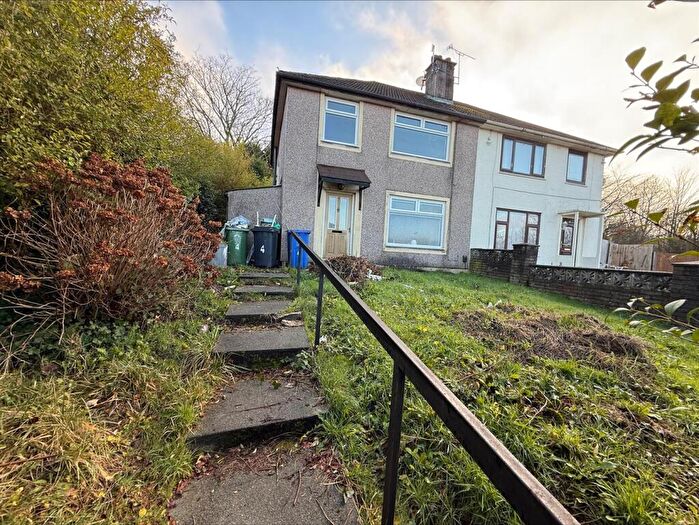
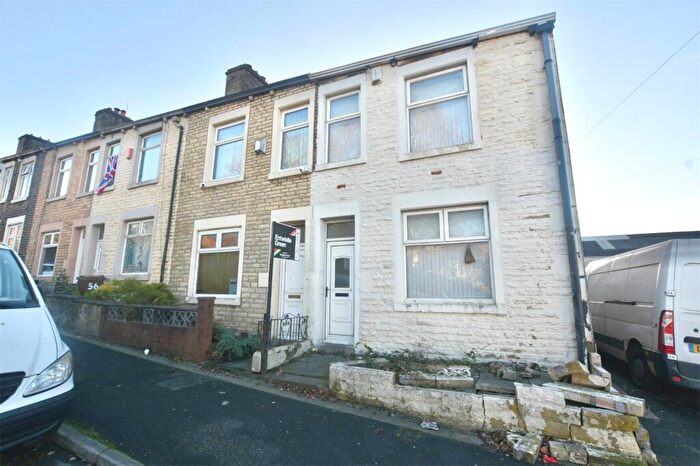
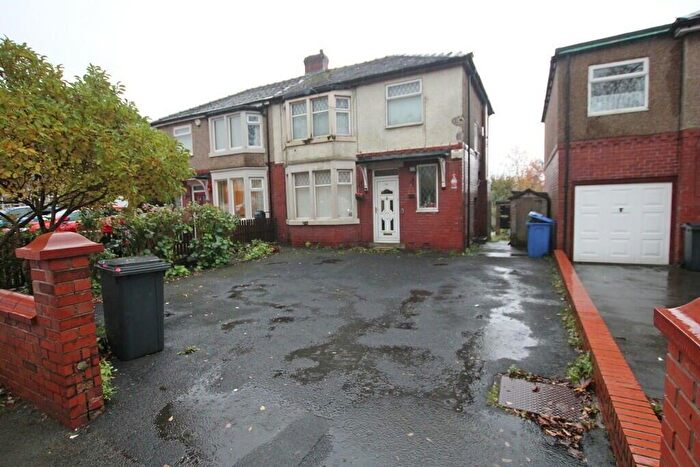
Houses for sale & to rent in Spring Hill, Accrington
House Prices in Spring Hill
Properties in Spring Hill have an average house price of £91,106.00 and had 183 Property Transactions within the last 3 years¹.
Spring Hill is an area in Accrington, Lancashire with 1,993 households², where the most expensive property was sold for £265,000.00.
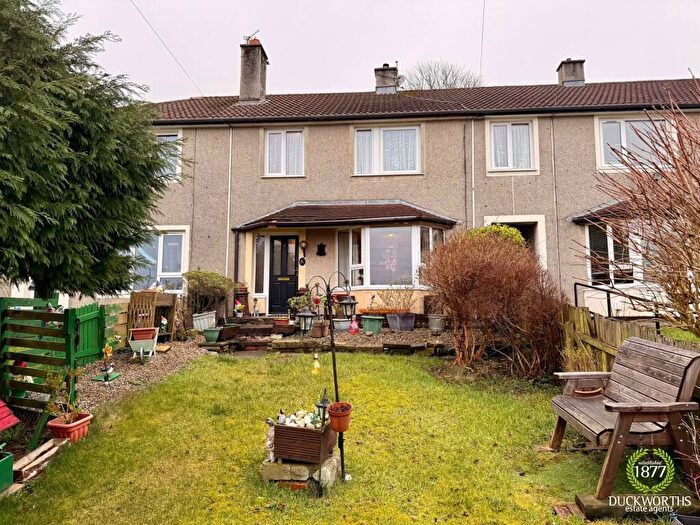
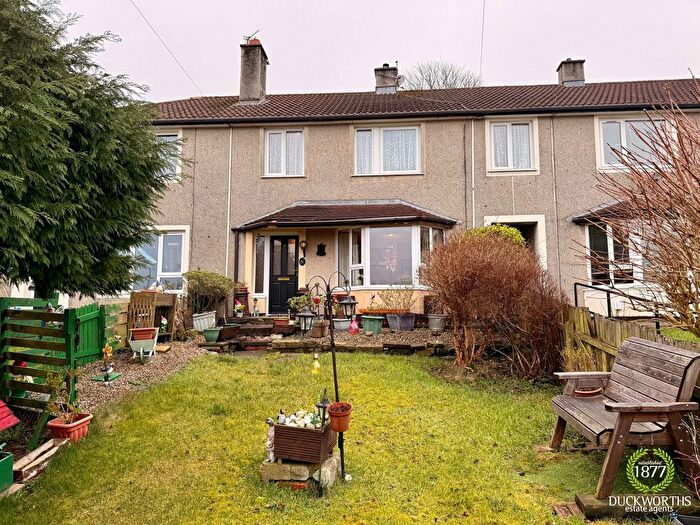
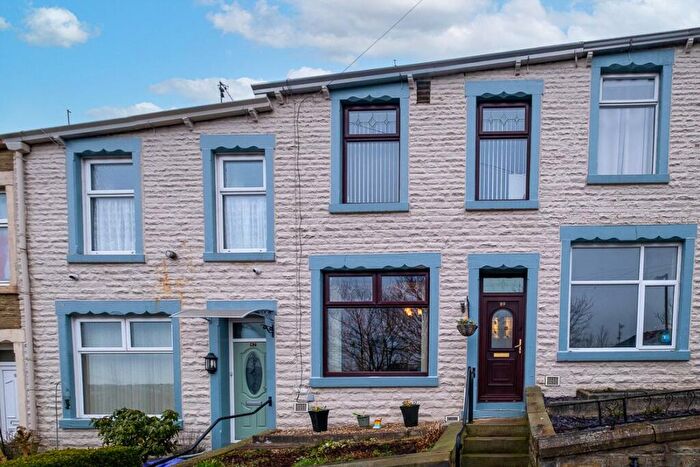
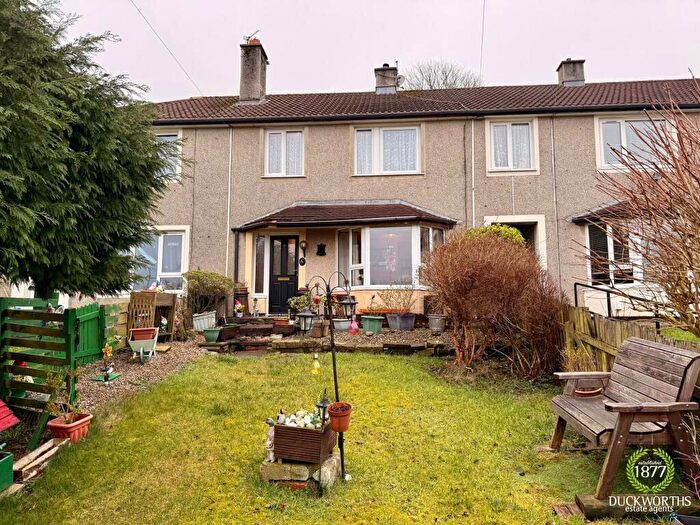
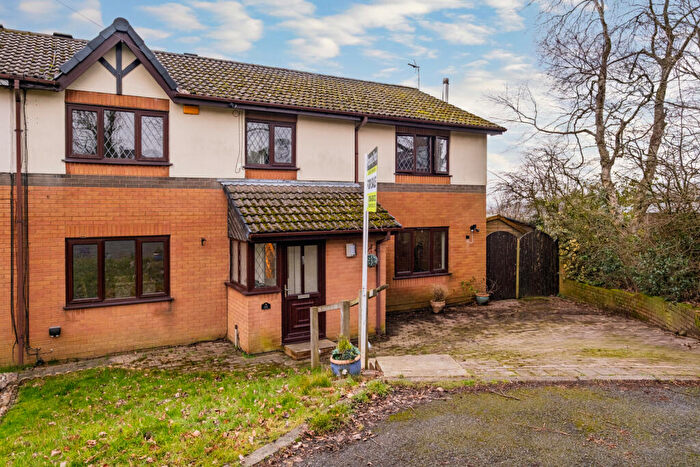
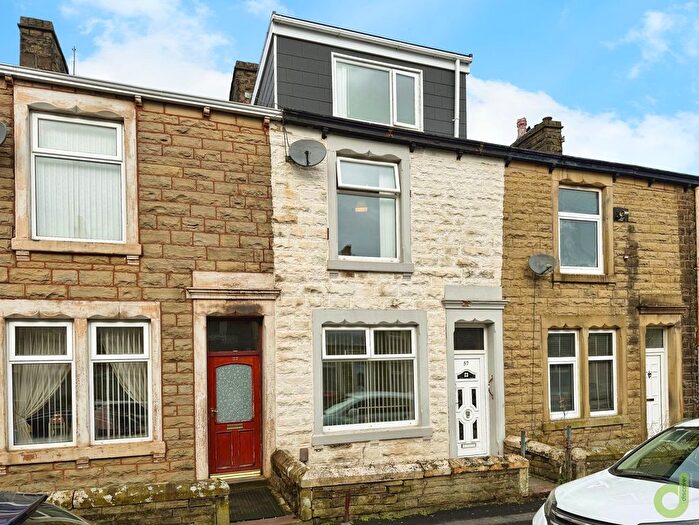
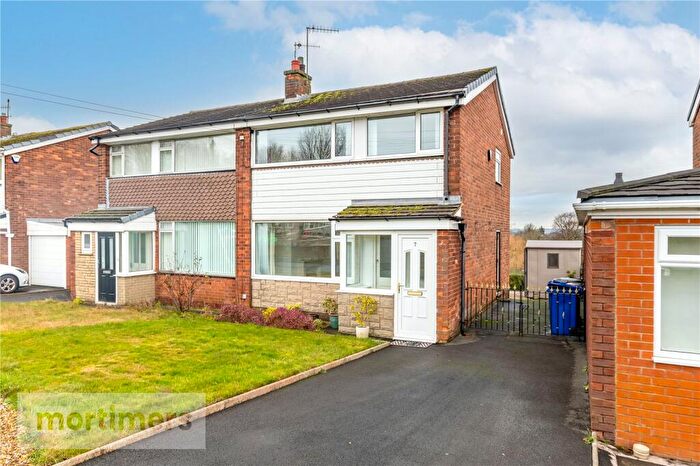
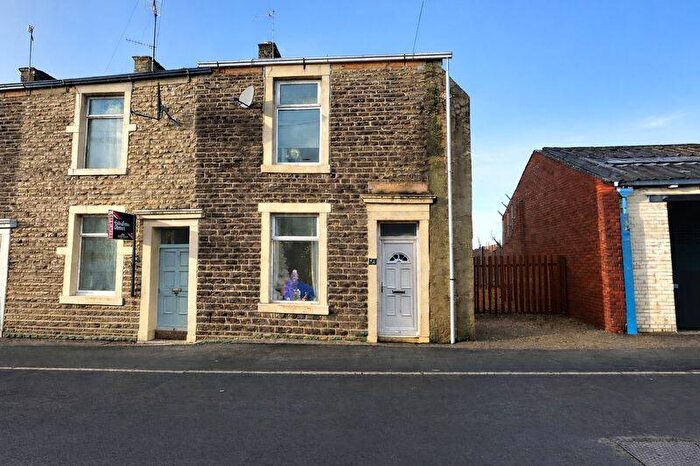
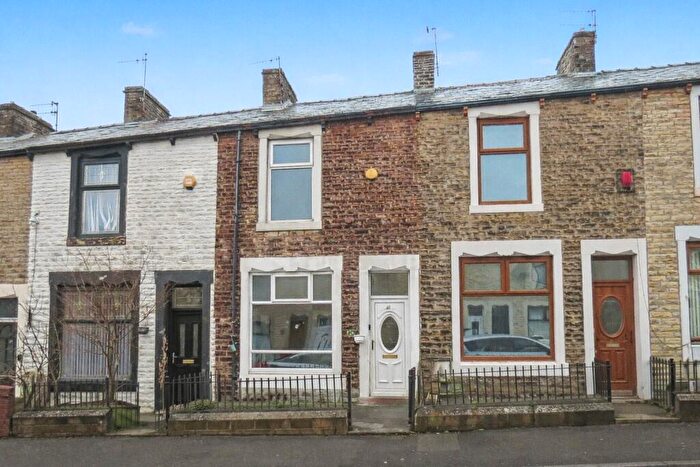
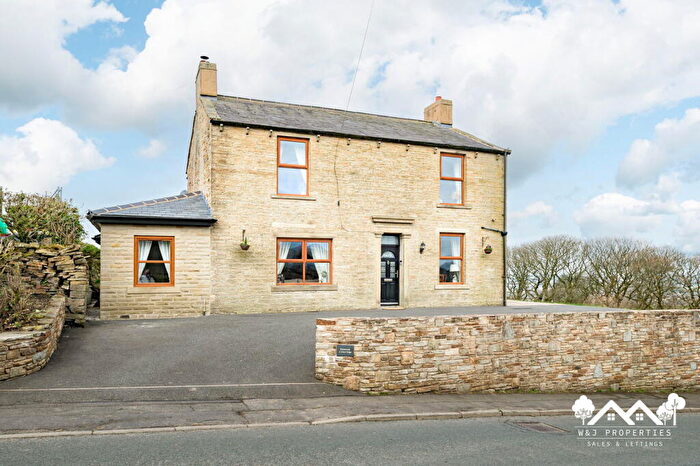
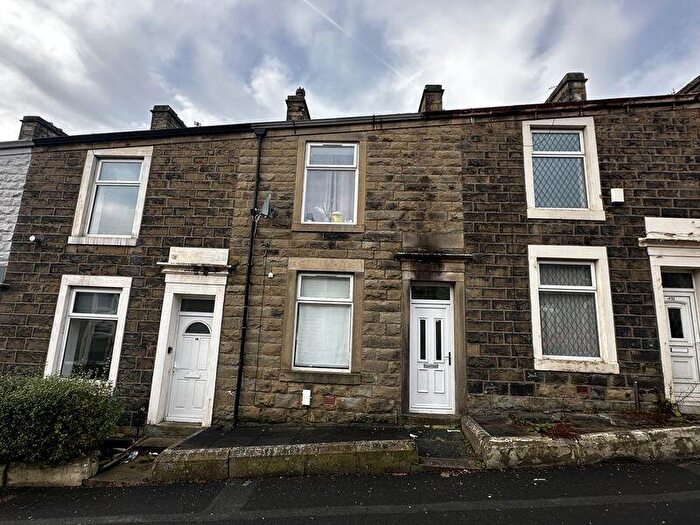
Properties for sale in Spring Hill
Roads and Postcodes in Spring Hill
Navigate through our locations to find the location of your next house in Spring Hill, Accrington for sale or to rent.
| Streets | Postcodes |
|---|---|
| Abbeydale Way | BB5 0EN |
| Arncliffe Avenue | BB5 0JR |
| Ashley Court | BB5 5NT |
| Barden Road | BB5 0JY |
| Bath Street | BB5 0PR |
| Beech Grove | BB5 0NE |
| Broadfield Road | BB5 0NL |
| Brocklehurst Avenue | BB5 0NU |
| Carter Street | BB5 0PY |
| Cartmel Avenue | BB5 0NW |
| Charter Street | BB5 0LF |
| Chestnut Grove | BB5 0ND |
| Clarence Road | BB5 0NA |
| Coal Pit Lane | BB5 0FJ |
| Coniston Avenue | BB5 0JZ |
| Cravenwood Close | BB5 0EE |
| Crosley Grove | BB5 0NX |
| Downham Drive | BB5 0NR |
| Dunnyshop Avenue | BB5 0LZ |
| Edleston Street | BB5 0HG |
| Elizabeth Street | BB5 0HH |
| Exchange Street | BB5 0JD BB5 0LE BB5 0FU |
| Fairclough Road | BB5 0NB |
| Fairfield Street | BB5 0LD |
| Fern Gore Avenue | BB5 0NF |
| Fife Street | BB5 0HZ |
| Fraser Street | BB5 0HX |
| Gayle Way | BB5 0JX |
| George Street | BB5 0HD |
| Gordon Avenue | BB5 0JA |
| Hartley Avenue | BB5 0NN |
| High Street | BB5 0PS |
| Higher Antley Street | BB5 0QB |
| Hope Street | BB5 0PL |
| Hopwood Street | BB5 0QF |
| Kingston Avenue | BB5 0JQ |
| Laurel Close | BB5 0HT |
| Lindadale Avenue | BB5 0NG |
| Lindadale Close | BB5 0NQ |
| Lonsdale Street | BB5 0HJ |
| Lydia Street | BB5 0PX |
| Lynton Road | BB5 0JU |
| Major Street | BB5 0PN BB5 0QE |
| Malham Avenue | BB5 0JL |
| Marsden Street | BB5 0PU |
| Maya Gardens | BB5 0HB |
| Miller Fold Avenue | BB5 0NT |
| Moorhouse Avenue | BB5 0JG |
| Moorhouse Close | BB5 0JS |
| Mount Street | BB5 0PJ |
| Orchard Drive | BB5 0FA |
| Ormerod Street | BB5 0PF BB5 0QG BB5 9SA BB5 9SB BB5 9SD BB5 9SE BB5 9SF BB5 9SG BB5 9SJ BB5 9SL BB5 9SN BB5 9SP BB5 9SQ BB5 9SR BB5 9SS BB5 9ST BB5 9SU BB5 9SW BB5 9SX BB5 9SY BB5 9SZ BB5 9TA BB5 9TB BB5 9TD |
| Park Crescent | BB5 0LW |
| Pendleton Avenue | BB5 0JW |
| Perth Street | BB5 0QD |
| Pickup Street | BB5 0EY |
| Primrose Street | BB5 0HU |
| Rawson Avenue | BB5 0JE |
| Reeth Way | BB5 0JT |
| Richmond Hill Street | BB5 0PZ |
| Richmond Road | BB5 0HY BB5 0JB BB5 0JN |
| Riley Street | BB5 0PT |
| Rimington Avenue | BB5 0NP |
| Rose Place | BB5 0LP |
| Rose Street | BB5 0QA |
| Sharples Street | BB5 0HQ |
| Slaidburn Drive | BB5 0JJ |
| Spring Hill Road | BB5 0EX |
| Spring Street | BB5 0HE BB5 0HF |
| Springfield Avenue | BB5 0EZ |
| Springvale | BB5 0HW |
| St James Court East | BB5 0DW |
| Stevenson Street East | BB5 0FX |
| Stevenson Street West | BB5 0HA |
| Victoria Street | BB5 0PG |
| Walker Avenue | BB5 0JF |
| Willows Lane | BB5 0LR BB5 0NH BB5 0NJ |
| Woodview Drive | BB5 0FS |
| Wordsworth Road | BB5 0LU |
| Worston Close | BB5 0JP |
| BB5 0FT |
Transport near Spring Hill
- FAQ
- Price Paid By Year
- Property Type Price
Frequently asked questions about Spring Hill
What is the average price for a property for sale in Spring Hill?
The average price for a property for sale in Spring Hill is £91,106. This amount is 33% lower than the average price in Accrington. There are 499 property listings for sale in Spring Hill.
What streets have the most expensive properties for sale in Spring Hill?
The streets with the most expensive properties for sale in Spring Hill are Bath Street at an average of £265,000, Orchard Drive at an average of £217,500 and Rimington Avenue at an average of £187,500.
What streets have the most affordable properties for sale in Spring Hill?
The streets with the most affordable properties for sale in Spring Hill are Richmond Road at an average of £39,950, George Street at an average of £42,000 and Hope Street at an average of £58,333.
Which train stations are available in or near Spring Hill?
Some of the train stations available in or near Spring Hill are Accrington, Church and Oswaldtwistle and Huncoat.
Property Price Paid in Spring Hill by Year
The average sold property price by year was:
| Year | Average Sold Price | Price Change |
Sold Properties
|
|---|---|---|---|
| 2025 | £92,839 | -4% |
44 Properties |
| 2024 | £96,729 | 13% |
72 Properties |
| 2023 | £83,925 | 3% |
67 Properties |
| 2022 | £81,512 | 7% |
95 Properties |
| 2021 | £75,601 | 25% |
93 Properties |
| 2020 | £56,959 | -14% |
71 Properties |
| 2019 | £64,650 | 5% |
73 Properties |
| 2018 | £61,489 | 1% |
71 Properties |
| 2017 | £61,155 | 10% |
85 Properties |
| 2016 | £54,889 | -2% |
64 Properties |
| 2015 | £55,922 | 8% |
65 Properties |
| 2014 | £51,304 | -4% |
94 Properties |
| 2013 | £53,283 | -11% |
60 Properties |
| 2012 | £59,304 | -7% |
36 Properties |
| 2011 | £63,454 | -10% |
57 Properties |
| 2010 | £69,776 | 5% |
46 Properties |
| 2009 | £66,020 | -4% |
30 Properties |
| 2008 | £68,760 | -17% |
68 Properties |
| 2007 | £80,268 | 20% |
149 Properties |
| 2006 | £64,580 | -8% |
159 Properties |
| 2005 | £69,908 | 23% |
165 Properties |
| 2004 | £53,788 | 52% |
191 Properties |
| 2003 | £25,991 | 18% |
168 Properties |
| 2002 | £21,280 | -5% |
116 Properties |
| 2001 | £22,386 | -12% |
94 Properties |
| 2000 | £25,062 | -34% |
85 Properties |
| 1999 | £33,635 | 43% |
79 Properties |
| 1998 | £19,315 | -1% |
63 Properties |
| 1997 | £19,466 | -0,4% |
107 Properties |
| 1996 | £19,552 | -7% |
85 Properties |
| 1995 | £20,987 | - |
66 Properties |
Property Price per Property Type in Spring Hill
Here you can find historic sold price data in order to help with your property search.
The average Property Paid Price for specific property types in the last three years are:
| Property Type | Average Sold Price | Sold Properties |
|---|---|---|
| Semi Detached House | £124,918.00 | 22 Semi Detached Houses |
| Detached House | £200,703.00 | 8 Detached Houses |
| Terraced House | £80,513.00 | 153 Terraced Houses |

