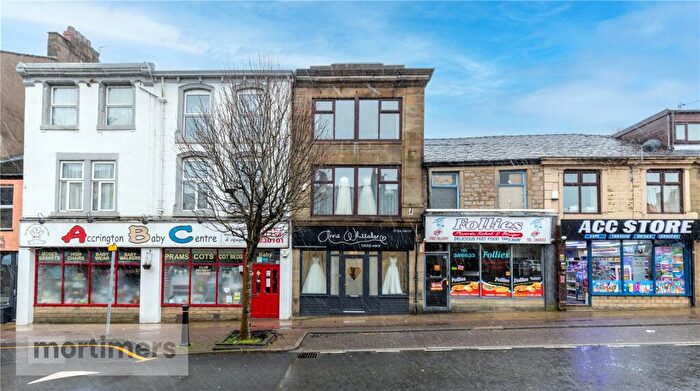
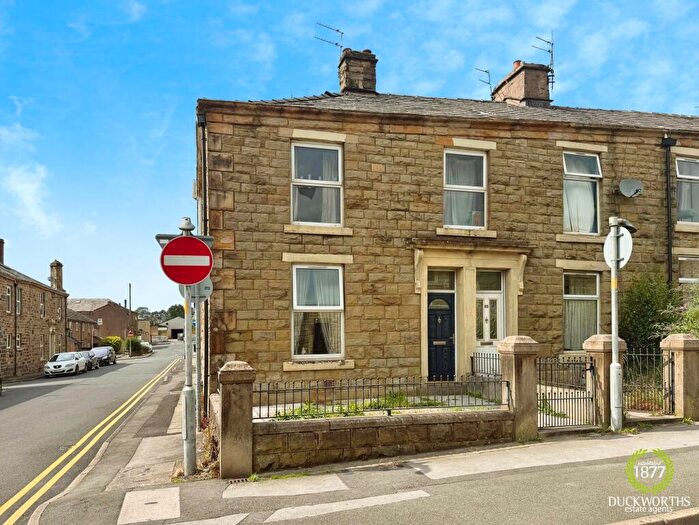
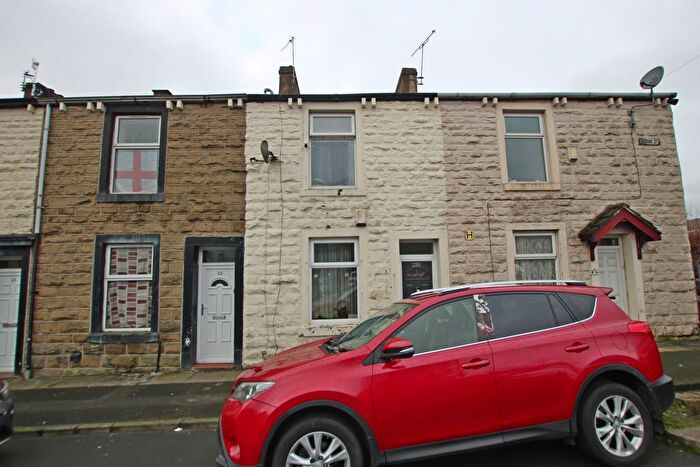
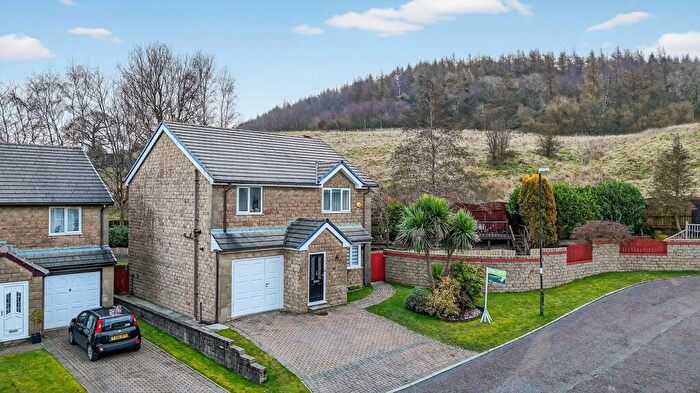
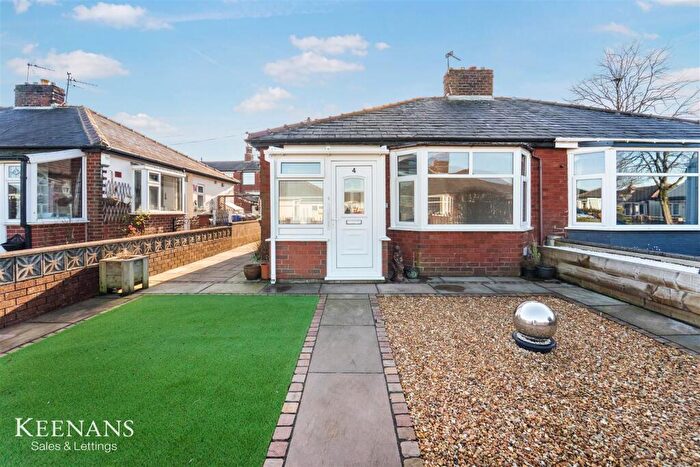
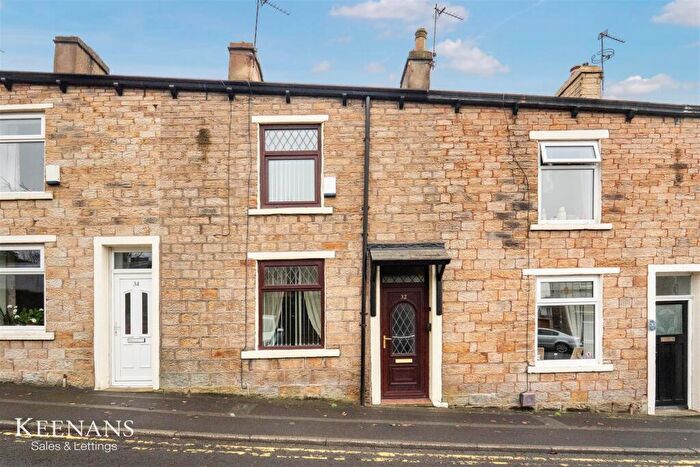
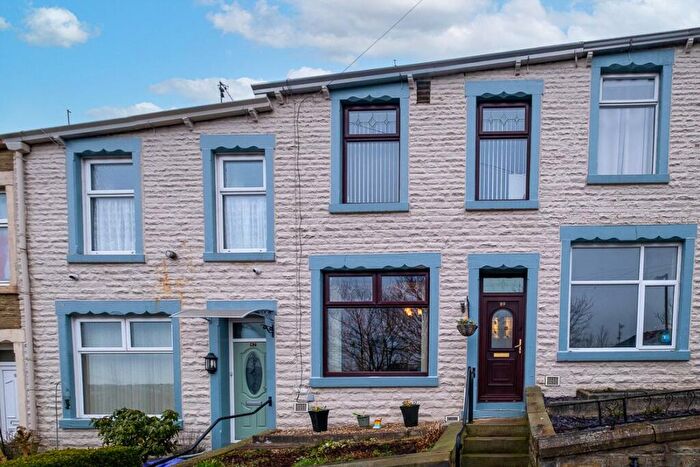
Houses for sale & to rent in Peel, Accrington
House Prices in Peel
Properties in Peel have an average house price of £86,283.00 and had 266 Property Transactions within the last 3 years¹.
Peel is an area in Accrington, Lancashire with 2,128 households², where the most expensive property was sold for £186,500.00.
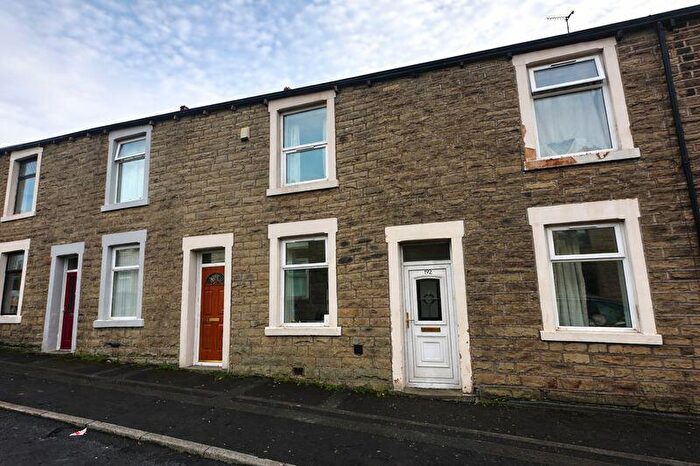
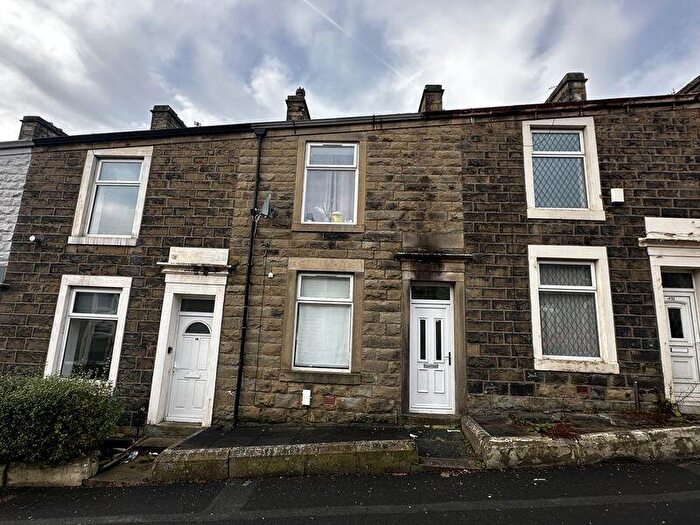
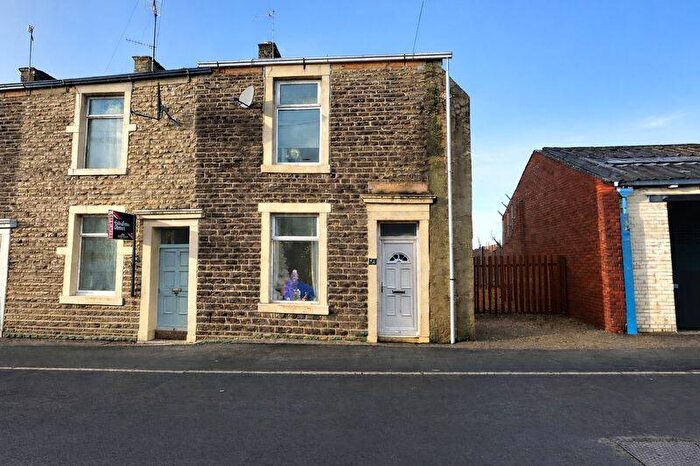
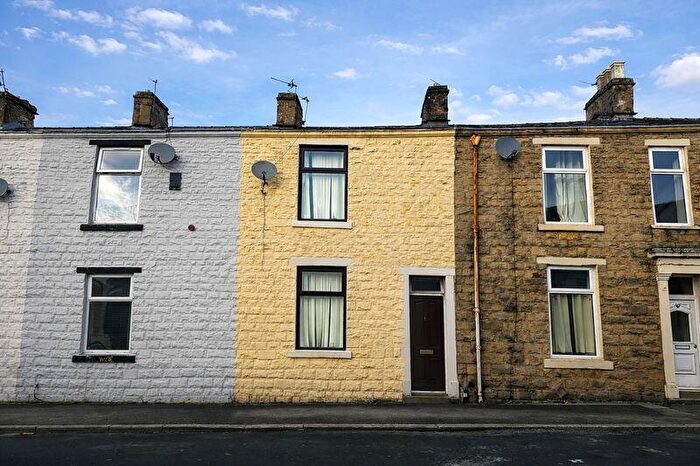
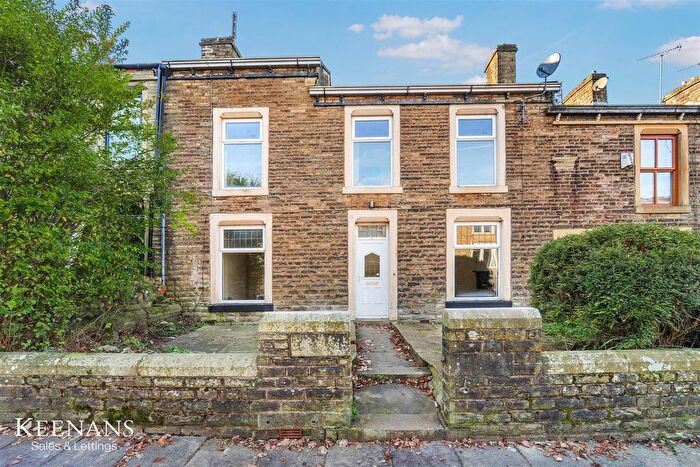
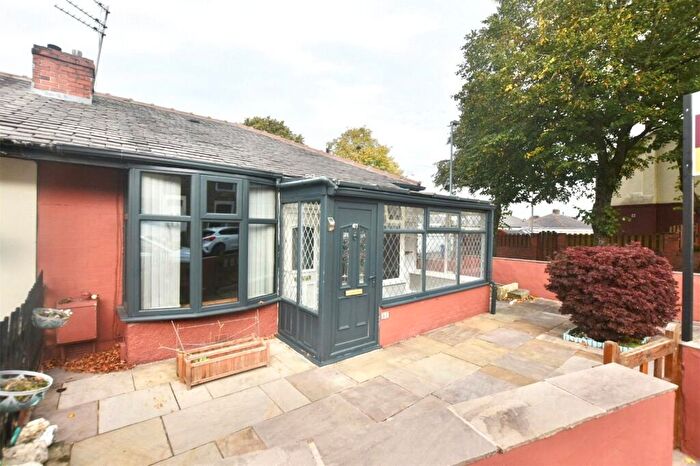
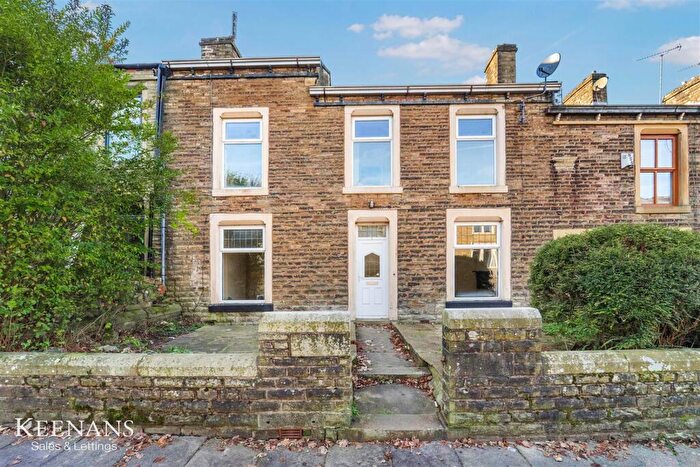
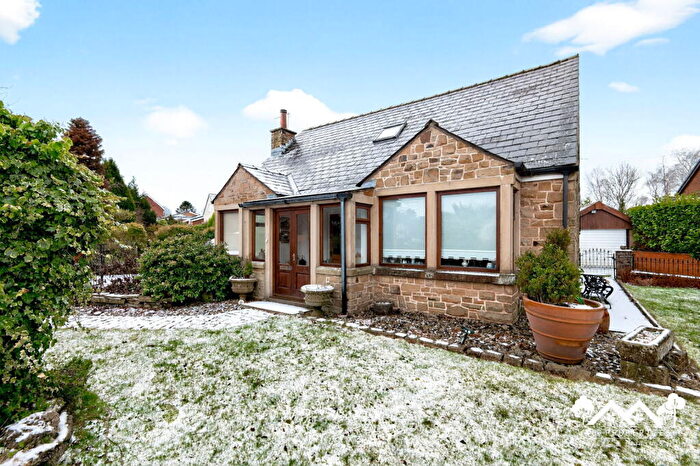
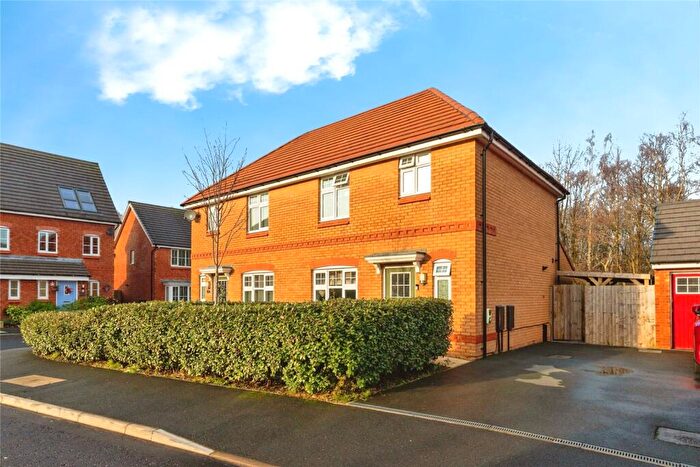
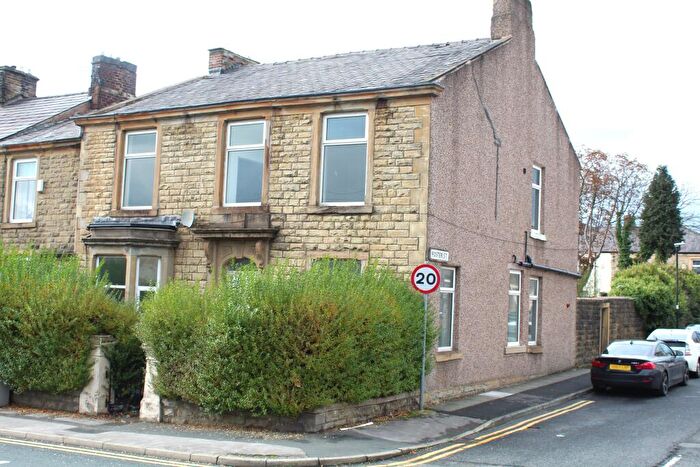
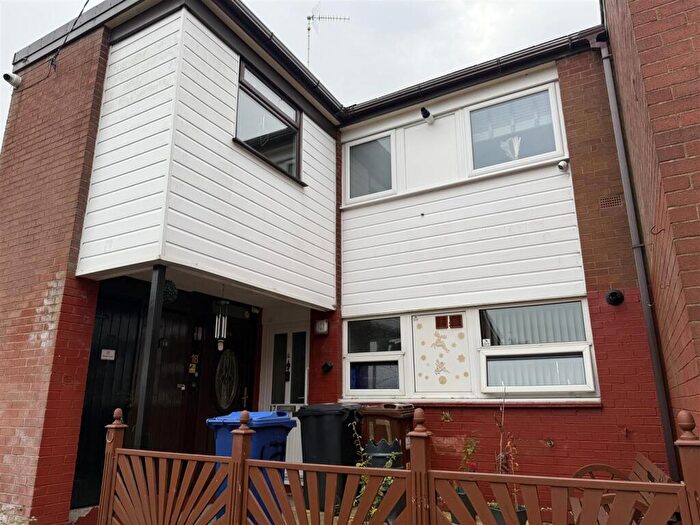
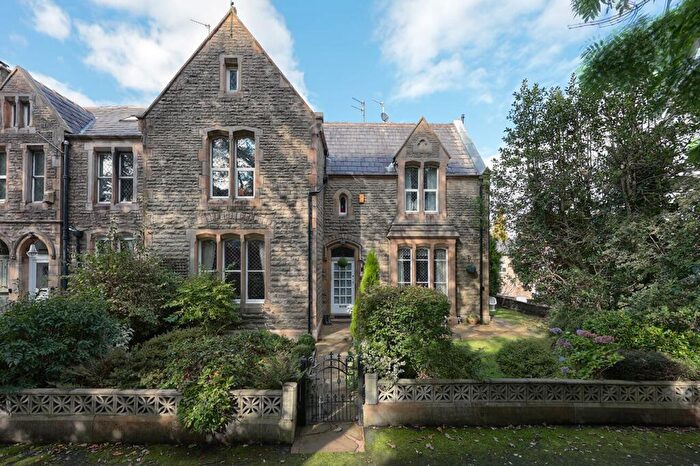
Properties for sale in Peel
Roads and Postcodes in Peel
Navigate through our locations to find the location of your next house in Peel, Accrington for sale or to rent.
| Streets | Postcodes |
|---|---|
| Abbey Street | BB5 1EH BB5 1EN |
| Addison Street | BB5 6AG |
| Alice Street | BB5 6EJ BB5 6QR |
| Annie Street | BB5 6AQ |
| Arago Street | BB5 6DX |
| Arnold Street | BB5 1AN BB5 6AF |
| Avenue Parade | BB5 6PJ BB5 6PN BB5 6QA BB5 6QB |
| Barnes Street | BB5 6RN |
| Bertha Street | BB5 6TE |
| Bold Street | BB5 6RH BB5 6SR BB5 6SS BB5 6SW |
| Bradford Street | BB5 6TB |
| Bradshaw Street East | BB5 1AL |
| Burnley Road | BB5 1AF BB5 1AG BB5 6DH BB5 6DW |
| Cambridge Street | BB5 6ED BB5 6QF BB5 6QY |
| Cedar Street | BB5 6SG BB5 6SQ |
| Clarendon Street | BB5 6SZ BB5 6TA BB5 6QE |
| Derby Street | BB5 1BP |
| Dowry Street | BB5 1AP BB5 1AW |
| Eastgate | BB5 6PU BB5 6PW BB5 6RQ |
| Essex Street | BB5 6QX |
| Foster Street | BB5 6AJ BB5 6DU |
| Friar Court | BB5 1AJ |
| Gillies Street | BB5 6RR |
| Hodder Street | BB5 6SX |
| Hood Street | BB5 1BW |
| Horne Street | BB5 1BL |
| Lee Street | BB5 6RP |
| Lodge Street | BB5 6EH BB5 6EQ |
| Manor Brook | BB5 6ES |
| Manor Street | BB5 6DZ BB5 6EA BB5 6EE |
| Mansion Street South | BB5 6SH |
| Maudsley Street | BB5 6AD |
| Meadow Street | BB5 1BJ |
| Norfolk Street | BB5 6EP |
| Oswald Street | BB5 6SJ BB5 6SL |
| Park Street | BB5 6PZ BB5 6RS BB5 6SF BB5 6PG |
| Penny House Lane | BB5 6AL |
| Percy Street | BB5 6TQ |
| Plantation Street | BB5 6RT BB5 6RZ |
| Railway View | BB5 1BR |
| Robert Street | BB5 6DY |
| Spencer Street | BB5 6ST BB5 6SY |
| Stanley Street | BB5 6PQ BB5 6PR BB5 6QD BB5 6QG BB5 6QQ |
| Sultan Street | BB5 6EL BB5 6EN |
| Sydney Street | BB5 6EG |
| Turkey Street | BB5 6EW |
| Washington Street | BB5 6PH BB5 6RA BB5 6TF BB5 6TG BB5 6SN |
| Water Street | BB5 6PX BB5 6QU BB5 6QZ |
| Whalley Road | BB5 1AR BB5 1AA |
| William Street | BB5 6DT |
| Windsor Street | BB5 6EF |
Transport near Peel
- FAQ
- Price Paid By Year
- Property Type Price
Frequently asked questions about Peel
What is the average price for a property for sale in Peel?
The average price for a property for sale in Peel is £86,283. This amount is 36% lower than the average price in Accrington. There are 758 property listings for sale in Peel.
What streets have the most expensive properties for sale in Peel?
The streets with the most expensive properties for sale in Peel are Alice Street at an average of £154,500, Plantation Street at an average of £140,000 and Bertha Street at an average of £138,500.
What streets have the most affordable properties for sale in Peel?
The streets with the most affordable properties for sale in Peel are Abbey Street at an average of £50,000, Derby Street at an average of £56,437 and Hood Street at an average of £63,500.
Which train stations are available in or near Peel?
Some of the train stations available in or near Peel are Accrington, Huncoat and Church and Oswaldtwistle.
Property Price Paid in Peel by Year
The average sold property price by year was:
| Year | Average Sold Price | Price Change |
Sold Properties
|
|---|---|---|---|
| 2025 | £92,205 | 9% |
70 Properties |
| 2024 | £83,848 | -1% |
92 Properties |
| 2023 | £84,450 | 0,4% |
104 Properties |
| 2022 | £84,118 | 13% |
122 Properties |
| 2021 | £73,330 | 12% |
114 Properties |
| 2020 | £64,530 | 5% |
101 Properties |
| 2019 | £61,615 | -6% |
122 Properties |
| 2018 | £65,400 | 1% |
98 Properties |
| 2017 | £65,042 | 1% |
98 Properties |
| 2016 | £64,338 | 11% |
85 Properties |
| 2015 | £57,341 | 13% |
83 Properties |
| 2014 | £49,776 | -20% |
96 Properties |
| 2013 | £59,690 | -13% |
71 Properties |
| 2012 | £67,431 | 2% |
45 Properties |
| 2011 | £65,844 | -0,1% |
53 Properties |
| 2010 | £65,941 | 2% |
59 Properties |
| 2009 | £64,527 | -26% |
64 Properties |
| 2008 | £81,533 | 3% |
83 Properties |
| 2007 | £79,281 | 16% |
181 Properties |
| 2006 | £66,783 | 3% |
213 Properties |
| 2005 | £64,711 | 28% |
173 Properties |
| 2004 | £46,797 | 26% |
218 Properties |
| 2003 | £34,858 | 20% |
236 Properties |
| 2002 | £27,765 | 2% |
184 Properties |
| 2001 | £27,323 | 9% |
149 Properties |
| 2000 | £24,790 | -2% |
146 Properties |
| 1999 | £25,252 | -1% |
120 Properties |
| 1998 | £25,455 | -5% |
113 Properties |
| 1997 | £26,605 | 10% |
141 Properties |
| 1996 | £24,073 | -2% |
109 Properties |
| 1995 | £24,469 | - |
130 Properties |
Property Price per Property Type in Peel
Here you can find historic sold price data in order to help with your property search.
The average Property Paid Price for specific property types in the last three years are:
| Property Type | Average Sold Price | Sold Properties |
|---|---|---|
| Semi Detached House | £136,277.00 | 9 Semi Detached Houses |
| Terraced House | £84,532.00 | 257 Terraced Houses |

